UNITED STATES
SECURITIES AND EXCHANGE COMMISSION
Washington, DC 20549
FORM 10-K
(Mark one) |
| |
ý | ANNUAL REPORT PURSUANT TO SECTION 13 OR 15(d) OF THE SECURITIES EXCHANGE ACT OF 1934 |
|
| |
For the fiscal year ended | December 31, 2014 |
or
|
| |
o | TRANSITION REPORT PURSUANT TO SECTION 13 OR 15(d) OF THE SECURITIES EXCHANGE ACT OF 1934 |
|
| | | |
For the transition period from | | to | |
Commission file number 1-14023 (Corporate Office Properties Trust)
Commission file number 333-189188 (Corporate Office Properties, L.P.)
Corporate Office Properties Trust
Corporate Office Properties, L.P.
(Exact name of registrant as specified in its charter)
|
| | | | |
Corporate Office Properties Trust | | Maryland | | 23-2947217 |
| | (State or other jurisdiction of | | (IRS Employer |
| | incorporation or organization) | | Identification No.) |
Corporate Office Properties, L.P. | | Delaware | | 23-2930022 |
| | (State or other jurisdiction of | | (IRS Employer |
| | incorporation or organization) | | Identification No.) |
|
| | |
6711 Columbia Gateway Drive, Suite 300, Columbia, MD | 21046 |
(Address of principal executive offices) | | (Zip Code) |
Registrant’s telephone number, including area code: (443) 285-5400
________________________________________
Securities registered pursuant to Section 12(b) of the Act:
|
| | |
(Title of Each Class) | | (Name of Exchange on Which Registered |
Common Shares of beneficial interest, $0.01 par value | | New York Stock Exchange |
Series L Cumulative Redeemable Preferred Shares of beneficial interest, $0.01 par value | | New York Stock Exchange |
Securities registered pursuant to Section 12(g) of the Act: None
Indicate by check mark if the registrant is a well-known seasoned issuer, as defined in Rule 405 of the Securities Act.
Corporate Office Properties Trust ý Yes o No
Corporate Office Properties, L.P. ý Yes o No
Indicate by check mark if the registrant is not required to file reports pursuant to Section 13 or Section 15(d) of the Exchange Act.
Corporate Office Properties Trust o Yes ý No
Corporate Office Properties, L.P. o Yes ý No
Indicate by check mark whether the registrant: (1) has filed all reports required to be filed by Section 13 or 15(d) of the Securities Exchange Act of 1934 during the preceding 12 months (or for such shorter period that the registrant was required to file such reports), and (2) has been subject to such filing requirements for the past 90 days.
Corporate Office Properties Trust ý Yes o No
Corporate Office Properties, L.P. ý Yes o No
Indicate by check mark whether the registrant has submitted electronically and posted on its corporate Web site, if any, every Interactive Data File required to be submitted and posted pursuant to Rule 405 of Regulation S-T during the preceding 12 months (or for such shorter period that the registrant was required to submit and post such files).
Corporate Office Properties Trust ý Yes o No
Corporate Office Properties, L.P. ý Yes o No
Indicate by check mark if disclosure of delinquent filers pursuant to Item 405 of Regulation S-K is not contained herein, and will not be contained, to the best of registrant’s knowledge, in definitive proxy or information statements incorporated by reference in Part III of this Form 10-K or any amendment to this Form 10-K. o
Indicate by check mark whether the registrant is a large accelerated filer, an accelerated filer, a non-accelerated filer, or a smaller reporting company. See the definitions of “large accelerated filer,” “accelerated filer” and “smaller reporting company” in Rule 12b-2 of the Exchange Act (Check one):
Corporate Office Properties Trust |
| | | | | | |
Large accelerated filer x | | Accelerated filer o | | Non-accelerated filer o | | Smaller reporting company o |
| | | | (Do not check if a smaller reporting company) | | |
Corporate Office Properties, L.P.
|
| | | | | | |
Large accelerated filer o | | Accelerated filer o | | Non-accelerated filer x | | Smaller reporting company o |
| | | | (Do not check if a smaller reporting company) | | |
Indicate by check mark whether the registrant is a shell company (as defined in Rule 12b-2 of the Exchange Act)
Corporate Office Properties Trust o Yes ý No
Corporate Office Properties, L.P. o Yes ý No
The aggregate market value of the voting and nonvoting shares of common stock held by non-affiliates of Corporate Office Properties Trust was approximately $1.6 billion, as calculated using the closing price of such shares on the New York Stock Exchange and the number of outstanding shares as of June 30, 2014. For purposes of calculating this amount only, affiliates are defined as Trustees, executive owners and beneficial owners of more than 10% of Corporate Office Properties Trust’s outstanding common shares, $0.01 par value. At January 30, 2015, 93,414,408 of Corporate Office Properties Trust’s common shares were outstanding.
The aggregate market value of the voting and nonvoting common units of limited partnership interest held by non-affiliates of Corporate Office Properties, L.P. was approximately $99.5 million, as calculated using the closing price of the common shares of Corporate Office Properties Trust (into which common units not held by Corporate Office Properties Trust are exchangeable) on the New York Stock Exchange and the number of outstanding units as of June 30, 2014.
Portions of the proxy statement of Corporate Office Properties Trust for its 2014 Annual Meeting of Shareholders to be filed within 120 days after the end of the fiscal year covered by this Form 10-K are incorporated by reference into Part III of this Form 10-K. EXPLANATORY NOTE
This report combines the annual reports on Form 10-K for the year ended December 31, 2014 of Corporate Office Properties Trust (“COPT”) and subsidiaries (collectively, the “Company”) and Corporate Office Properties, L.P. (“COPLP”) and subsidiaries (collectively, the “Operating Partnership”). Unless stated otherwise or the context otherwise requires, “we,” “our,” and “us” refer collectively to COPT, COPLP and their subsidiaries.
COPT is a real estate investment trust, or REIT, and the sole general partner of COPLP. As of December 31, 2014, COPT owned approximately 96.0% of the outstanding common units and approximately 95.5% of the outstanding preferred units in COPLP. The remaining common and preferred units are owned by a trustee of COPT and certain non-affiliated investors. As the sole general partner of COPLP, COPT controls COPLP and can cause it to enter into major transactions including acquisitions, dispositions and refinancings and cause changes in its line of business, capital structure and distribution policies.
There are a few differences between the Company and the Operating Partnership which are reflected in this Form 10-K. We believe it is important to understand the differences between the Company and the Operating Partnership in the context of how the Company and the Operating Partnership operate as an interrelated, consolidated company. COPT is a real estate investment trust, whose only material asset is its ownership of partnership interests of COPLP. As a result, COPT does not conduct business itself, other than acting as the sole general partner of COPLP, issuing public equity from time to time and guaranteeing certain debt of COPLP. COPT itself is not directly obligated under any indebtedness but guarantees some of the debt of COPLP. COPLP owns substantially all of the assets of COPT either directly or through its subsidiaries, conducts almost all of the operations of the business and is structured as a limited partnership with no publicly traded equity. Except for net proceeds from public equity issuances by COPT, which are contributed to COPLP in exchange for partnership units, COPLP generates the capital required by COPT’s business through COPLP’s operations, by COPLP’s direct or indirect incurrence of indebtedness or through the issuance of partnership units.
Noncontrolling interests and shareholders’ equity and partners’ capital are the main areas of difference between the consolidated financial statements of COPT and those of COPLP. The common limited partnership interests in COPLP not owned by COPT are accounted for as partners’ capital in COPLP’s consolidated financial statements and as noncontrolling interests in COPT’s consolidated financial statements. COPLP’s consolidated financial statements also reflect COPT’s noncontrolling interests in certain real estate partnerships, limited liability companies (“LLCs”), business trusts and corporations; the differences between shareholders’ equity, partners’ capital and noncontrolling interests result from the differences in the equity issued at the COPT and COPLP levels and in COPT’s noncontrolling interests in these real estate partnerships, LLCs, business trusts and corporations. The only other significant differences between the consolidated financial statements of COPT and those of COPLP are assets in connection with a non-qualified elective deferred compensation plan (comprised primarily of mutual funds and equity securities) and the corresponding liability to the plan’s participants that are held directly by COPT.
We believe combining the annual reports on Form 10-K of the Company and the Operating Partnership into this single report results in the following benefits:
| |
• | combined reports better reflect how management and the analyst community view the business as a single operating unit; |
| |
• | combined reports enhance investors’ understanding of the Company and the Operating Partnership by enabling them to view the business as a whole and in the same manner as management; |
| |
• | combined reports are more efficient for the Company and the Operating Partnership and result in savings in time, effort and expense; and |
| |
• | combined reports are more efficient for investors by reducing duplicative disclosure and providing a single document for their review. |
To help investors understand the significant differences between the Company and the Operating Partnership, this report presents the following separate sections for each of the Company and the Operating Partnership:
| |
• | consolidated financial statements; |
| |
• | the following notes to the consolidated financial statements: |
| |
• | Note 3, Fair Value Measurements of COPT and subsidiaries and COPLP and subsidiaries; |
| |
• | Note 14, Equity of COPT and subsidiaries; |
| |
• | Note 15, Equity of COPLP and subsidiaries; |
| |
• | Note 21, Earnings per Share of COPT and subsidiaries and Earnings per Unit of COPLP and subsidiaries; and |
| |
• | Note 22, Quarterly Data of COPT and subsidiaries and COPLP and subsidiaries. |
| |
• | “Item 7: Management’s Discussion and Analysis of Financial Condition and Results of Operations - Liquidity and Capital Resources of COPT”; and |
| |
• | “Item 7: Management’s Discussion and Analysis of Financial Condition and Results of Operations - Liquidity and Capital Resources of the Operating Partnership.” |
This report also includes separate sections under Part II, Item 9A. Controls and Procedures and separate Exhibit 31 and Exhibit 32 certifications for each of COPT and COPLP to establish that the Chief Executive Officer and the Chief Financial Officer of each entity have made the requisite certifications and that COPT and COPLP are compliant with Rule 13a-15 and Rule 15d-14 of the Securities Exchange Act of 1934, as amended (the “Exchange Act”), and 18 U.S.C. §1350.
Table of Contents
Form 10-K
FORWARD-LOOKING STATEMENTS
This Form 10-K contains “forward-looking” statements, within the meaning of federal securities law, that are based on our current expectations, estimates and projections about future events and financial trends affecting the financial condition and operations of our business. Additionally, documents we subsequently file with the SEC and incorporated by reference will contain forward-looking statements.
Forward-looking statements can be identified by the use of words such as “may,” “will,” “should,” “could,” “believe,” “anticipate,” “expect,” “estimate,” “plan” or other comparable terminology. Forward-looking statements are inherently subject to risks and uncertainties, many of which we cannot predict with accuracy and some of which we might not even anticipate. Although we believe that the expectations, estimates and projections reflected in such forward-looking statements are based on reasonable assumptions at the time made, we can give no assurance that these expectations, estimates and projections will be achieved. Future events and actual results may differ materially from those discussed in the forward-looking statements. We caution readers that forward-looking statements reflect our opinion only as of the date on which they were made. You should not place undue reliance on forward-looking statements. The following factors, among others, could cause actual results and future events to differ materially from those set forth or contemplated in the forward-looking statements:
| |
• | general economic and business conditions, which will, among other things, affect office property and data center demand and rents, tenant creditworthiness, interest rates, financing availability and property values; |
| |
• | adverse changes in the real estate markets, including, among other things, increased competition with other companies; |
| |
• | governmental actions and initiatives, including risks associated with the impact of a prolonged government shutdown or budgetary reductions or impasses, such as a reduction in rental revenues, non-renewal of leases and/or a curtailment of demand for additional space by our strategic customers; |
| |
• | our ability to borrow on favorable terms; |
| |
• | risks of real estate acquisition and development activities, including, among other things, risks that development projects may not be completed on schedule, that tenants may not take occupancy or pay rent or that development or operating costs may be greater than anticipated; |
| |
• | risks of investing through joint venture structures, including risks that our joint venture partners may not fulfill their financial obligations as investors or may take actions that are inconsistent with our objectives; |
| |
• | changes in our plans for properties or views of market economic conditions or failure to obtain development rights, either of which could result in recognition of significant impairment losses; |
| |
• | our ability to satisfy and operate effectively under Federal income tax rules relating to real estate investment trusts and partnerships; |
| |
• | the dilutive effects of issuing additional common shares; |
| |
• | our ability to achieve projected results; and |
| |
• | environmental requirements. |
We undertake no obligation to publicly update or supplement forward-looking statements, whether as a result of new information, future events or otherwise. For further information on these and other factors that could affect us and the statements contained herein, you should refer to the section below entitled “Item 1A. Risk Factors.”
PART I
Item 1. Business
OUR COMPANY
General. Corporate Office Properties Trust (“COPT”) and subsidiaries (collectively, the “Company”) is a fully-integrated and self-managed real estate investment trust (“REIT”). Corporate Office Properties, L.P. (“COPLP”) and subsidiaries (collectively, the “Operating Partnership”) is the entity through which COPT, the sole general partner of COPLP, conducts almost all of its operations and owns almost all of its assets. Unless otherwise expressly stated or the context otherwise requires, “we”, “us” and “our” as used herein refer to each of the Company and the Operating Partnership. We focus primarily on serving the specialized requirements of United States Government agencies and their contractors, most of whom are engaged in national security and information technology related activities. We generally acquire, develop, manage and lease office and data center properties concentrated in large office parks located near knowledge-based government demand drivers and/or in targeted markets or submarkets in the Greater Washington, DC/Baltimore region. As of December 31, 2014, our properties included the following:
| |
• | 173 operating office properties totaling 16.8 million square feet that were 91% occupied (excluding two properties serving as collateral for a nonrecourse mortgage loan in default, as discussed further below in the section entitled “Significant Developments”); |
| |
• | 13 office properties under, or contractually committed for, construction or redevelopment that we estimate will total approximately 1.6 million square feet upon completion; |
| |
• | 1,464 acres of land we control that we believe are potentially developable into approximately 18.3 million square feet; and |
| |
• | a partially operational, wholesale data center which upon completion and stabilization is expected to have a critical load of 19.25 megawatts. |
COPLP owns real estate both directly and through subsidiary partnerships and limited liability companies (“LLCs”). In addition to owning real estate, COPLP also owns subsidiaries that provide real estate services such as property management and construction and development services primarily for our properties but also for third parties. Some of these services are performed by a taxable REIT subsidiary (“TRS”).
Equity interests in COPLP are in the form of common and preferred units. As of December 31, 2014, COPT owned 96.0% of the outstanding COPLP common units (“common units”) and 95.5% of the outstanding COPLP preferred units (“preferred units”); the remaining common and preferred units in COPLP were owned by third parties. Common units in COPLP not owned by COPT carry certain redemption rights. The number of common units in COPLP owned by COPT is equivalent to the number of outstanding common shares of beneficial interest (“common shares”) of COPT, and the entitlement of all COPLP common units to quarterly distributions and payments in liquidation is substantially the same as those of COPT common shareholders. Similarly, in the case of each series of preferred units in COPLP held by COPT, there is a series of preferred shares of beneficial interest (“preferred shares”) in COPT that is equivalent in number and carries substantially the same terms as such series of COPLP preferred units. COPT’s common shares are publicly traded on the New York Stock Exchange (“NYSE”) under the ticker symbol “OFC”.
Because COPLP is managed by COPT, and COPT conducts substantially all of its operations through COPLP, we refer to COPT’s executive officers as COPLP’s executive officers, and although, as a partnership, COPLP does not have a board of trustees, we refer to COPT’s Board of Trustees as COPLP’s Board of Trustees.
We believe that COPT is organized and has operated in a manner that satisfies the requirements for taxation as a REIT under the Internal Revenue Code of 1986, as amended, and we intend to continue to operate COPT in such a manner. If COPT continues to qualify for taxation as a REIT, it generally will not be subject to Federal income tax on its taxable income (other than that of its TRS) that is distributed to its shareholders. A REIT is subject to a number of organizational and operational requirements, including a requirement that it distribute to its shareholders at least 90% of its annual taxable income.
Our executive offices are located at 6711 Columbia Gateway Drive, Suite 300, Columbia, Maryland 21046 and our telephone number is (443) 285-5400.
Our Internet address is www.copt.com. We make available on our Internet website free of charge our annual reports on Form 10-K, quarterly reports on Form 10-Q, current reports on Form 8-K and amendments to those reports filed or furnished pursuant to Section 13(a) or 15(d) of the Securities Exchange Act of 1934, as amended (the “Exchange Act”), as soon as reasonably possible after we file such material with the Securities and Exchange Commission (the “SEC”). In addition, we have made available on our Internet website under the heading “Corporate Governance” the charters for our Board of Trustees’ Audit, Nominating and Corporate Governance, Compensation and Investment Committees, as well as our Corporate
Governance Guidelines, Code of Business Conduct and Ethics and Code of Ethics for Financial Officers. We intend to make available on our website any future amendments or waivers to our Code of Business Conduct and Ethics and Code of Ethics for Financial Officers within four business days after any such amendments or waivers. The information on our Internet site is not part of this report.
The SEC maintains an Internet website that contains reports, proxy and information statements and other information regarding issuers that file electronically with the SEC. This Internet website can be accessed at www.sec.gov. The public may also read and copy paper filings that we have made with the SEC at the SEC’s Public Reference Room, located at 100 F Street, NE, Washington, DC 20549. Information on the operation of the Public Reference Room may be obtained by calling (800) SEC-0330.
Significant Developments
In 2014:
| |
• | we placed into service an aggregate of 692,000 square feet in five newly constructed properties that were 94.6% leased as of December 31, 2014; |
| |
• | we finished the period with occupancy of our portfolio of operating office properties at 90.9%; |
| |
• | COPLP issued a $300.0 million aggregate principal amount of 3.700% Senior Notes, which are unsecured and guaranteed by COPT, on May 14, 2014 at an initial offering price of 99.739% of their face value. The proceeds from the offering, after deducting underwriting discounts but before other offering expenses, were approximately $297.3 million. We used the net proceeds of the offering to repay borrowings under our Revolving Credit Facility, repay $50.0 million under an existing term loan facility, fund the redemption of our Series H Preferred Shares and for general corporate purposes; |
| |
• | COPT redeemed all of its outstanding Series H Preferred Shares on June 16, 2014 at a price of $25.00 per share, or $50.0 million in the aggregate, plus accrued and unpaid dividends thereon through the date of redemption, using proceeds from the 3.700% Senior Notes issuance. These shares accrued dividends equal to 7.5% of their liquidation preference. In connection with this redemption, COPLP redeemed the Series H Preferred Units previously owned by COPT that carried terms substantially the same as the Series H Preferred Shares. At the time of the redemption, we recognized a $1.8 million decrease to net income available to common shareholders/unitholders pertaining to the original issuance costs of the securities; |
| |
• | COPT completed a public offering of 5.52 million common shares in November at a price of $27.30 per share for net proceeds of $148.9 million, after underwriter discounts but before offering expenses, that were contributed to COPLP in exchange for 5.52 million common units. The net proceeds were used primarily to fund our defeasance of, and full satisfaction of our obligations with respect to, the secured nonrecourse mortgage loans discussed below, as well as costs related to the defeasance and satisfaction; |
| |
• | we completed in December the defeasance of, and full satisfaction of our obligations with respect to, (1) $103.0 million principal amount of secured nonrecourse mortgage loan due to mature on November 6, 2015 and bearing an interest rate of 5.53% and (2) $108.5 million principal amount of secured nonrecourse mortgage loan due to mature on January 1, 2016 and bearing an interest rate of 5.56%, as well as costs related to the defeasance and satisfaction. As a result, we recognized a loss on extinguishment of debt of $9.1 million; |
| |
• | a wholly owned subsidiary defaulted in April on the payment terms of a $150.0 million nonrecourse mortgage loan secured by two operating properties in Northern Virginia with an aggregate estimated fair value that was less than the loan balance. This loan had an interest rate of 10.65% (including the effect of default interest) and was originally scheduled to mature in 2017. In connection with the loan’s default proceedings, we expect to transfer title to the properties and be relieved of the debt obligation plus accrued interest in early 2015; and |
| |
• | we completed dispositions of eight operating properties in the Greater Baltimore region totaling 303,000 square feet that were 48.9% occupied for $28.8 million and sold land for $28.3 million. We used most of the proceeds from these sales for general corporate purposes. |
Effective February 3, 2015, Stephen E. Riffee, our Executive Vice President and Chief Financial Officer (“CFO”), left the Company to pursue other interests. Our Board of Trustees appointed Anthony Mifsud as Executive Vice President and CFO effective upon Mr. Riffee’s departure.
Business and Growth Strategies
Our primary objectives are to achieve sustainable growth in results of operations and to maximize shareholder value. This section sets forth key components of our business and growth strategies that we have in place to support these objectives.
Customer Strategy: We focus on serving the specialized requirements of United States Government agencies and their contractors, most of whom are engaged in national security and information technology related activities. These tenants’ missions generally pertain more to knowledge-based activities (such as cyber security, research and development and other highly technical defense and security areas) than to force structure (troops) and weapon system production. A high percentage of our revenue is concentrated in office and data center properties supporting this strategy, and we expect to maintain a high concentration through our:
| |
• | properties’ (existing buildings and developable land we control) proximity to defense installations and other knowledge-based government demand drivers, and our willingness to expand to new locations with similar proximities; |
| |
• | extensive experience in developing secured, specialized space, with the ability to satisfy the United States Government’s unique needs, including Sensitive Compartmented Information Facility (“SCIF”) and Anti-Terrorism Force Protection (“ATFP”) requirements; |
| |
• | depth of knowledge, specialized skills and credentialed personnel in operating highly specialized space with security-oriented needs; |
| |
• | strong relationships with our tenants; and |
| |
• | track record of providing service that exceeds customer expectations both in terms of the quality of the space we provide and our level of responsiveness to their needs. We believe that operating with such an emphasis on service enables us to be a landlord of choice with high quality customers and contributes to high levels of customer loyalty and retention. |
Market Strategy: In order to support our customer strategy, we focus on owning properties located near defense installations and other knowledge-based government demand drivers. We also focus on owning properties in targeted markets or submarkets in the Greater Washington, DC/Baltimore region with strong supply and demand fundamentals and proximity to growth attributes including, among others: (1) strong demand drivers; (2) diverse and growing economies marked by strong demographics and consistent job growth; (3) major transportation routes and public transportation; (4) a wide range of amenities and support services; (5) housing aligned with demographics of the workforce and decision makers; and/or (6) future acquisition and development opportunities, including infill locations.
Asset Management Strategy: We aggressively manage our portfolio to maximize the operating value and performance of each property through: (1) proactive property management and leasing; (2) achievement of operating efficiencies by increasing economies of scale and, where possible, aggregating vendor contracts to achieve volume pricing discounts; (3) renewing tenant leases and re-tenanting at increased rents where market conditions permit; and (4) redevelopment when we believe property conditions and market demand warrant. We may also seek to dispose of properties when they no longer meet our strategic objectives, or when capital markets and the circumstances pertaining to such holdings otherwise warrant, in order to maximize our return on invested capital and be better positioned for long-term growth.
We also aim to develop and operate our properties in a manner that minimizes adverse impact on the environment by: (1) constructing new buildings designed to use resources with a high level of efficiency and low impact on human health and the environment during their life cycles through our participation in the U.S. Green Building Council’s Leadership in Energy and Environmental Design (“LEED”) program; (2) investing in energy systems and other equipment that reduce energy consumption and property operating costs; and (3) adopting select LEED Existing Building (“EB”) prerequisites for much of our portfolio, including guidelines pertaining to cleaning and recycling practices and energy reduction.
Property Development and Acquisition Strategy: We pursue property development and acquisition opportunities for properties that fit our customer and market strategies. As a result, the focus of our development and acquisition activities includes properties that are either: (1) located near defense installations and other knowledge-based government demand drivers; or (2) located in markets or submarkets in the Greater Washington, DC/Baltimore region that we believe meet the criteria set forth above in our market strategy. We may also develop or acquire properties that do not align with our customer or market strategies but which we believe provide opportunities for favorable returns on investment given the associated risks.
We pursue development activities as market conditions and leasing opportunities support favorable risk-adjusted returns on investment. We typically seek to make acquisitions at attractive yields and below replacement cost, or that otherwise meet our strategic objectives. We also seek to increase operating cash flow of certain acquisitions by repositioning the properties and capitalizing on existing below market leases and expansion opportunities.
Capital Strategy: Our capital strategy is aimed at maintaining access to capital in the face of differing market conditions in the most cost-effective manner by:
| |
• | maintaining an investment grade rating to enable us to use debt comprised of unsecured, primarily fixed-rate debt (including the effect of interest rate swaps) from public markets and banks; |
| |
• | using secured nonrecourse debt from institutional lenders and banks, when appropriate; |
| |
• | managing our debt by monitoring, among other things: (1) our total and secured debt levels relative to our overall capital structure; (2) the relationship of certain measures of earnings to our debt level and to certain capital costs; (3) the timing of debt maturities to ensure that maturities in any year do not exceed levels that we believe we can refinance; and (4) the relationship of our variable-rate debt to our total debt; |
| |
• | using equity raised through issuances of common and preferred shares, issuances of common and preferred units in COPLP and, to a lesser extent, joint venture structures for certain investments; |
| |
• | paying dividends at a level that at least enables us to maintain our REIT status; |
| |
• | recycling proceeds from property sales under our asset management strategy (discussed above) to fund our investment activities and to reduce overall debt; and |
| |
• | continuously evaluating the ability of our capital resources to accommodate our plans for future growth. |
Industry Segments
We operate in two primary industries: commercial office properties and our wholesale data center. We classify our properties containing data center space as commercial office real estate when tenants significantly fund the data center infrastructure costs. As of December 31, 2014, our commercial office real estate operations were primarily located in the following geographical segments:
| |
• | Baltimore/Washington Corridor (primarily defined as the Maryland counties of Howard, Anne Arundel and Prince George’s); |
| |
• | Northern Virginia (defined as the Virginia counties of Fairfax and Loudoun); |
| |
• | Washington, DC - Capital Riverfront; |
| |
• | St. Mary’s & King George Counties (in Maryland and Virginia, respectively); |
| |
• | Greater Baltimore, Maryland (generally defined as the Maryland counties of Baltimore and Harford and Baltimore City); and |
| |
• | Greater Philadelphia, Pennsylvania (in Blue Bell, Pennsylvania). |
As of December 31, 2014, 155 of our office properties, or 86% of our square feet in operations, were located in the Greater Washington, DC/Baltimore region, which includes all the segments set forth above except for San Antonio, Huntsville and Greater Philadelphia. Our wholesale data center, which is comprised of one property in Manassas, Virginia, is reported as a separate segment.
For information relating to our segments, you should refer to Note 18 to our consolidated financial statements, which is included in a separate section at the end of this Annual Report on Form 10-K beginning on page F-1.
All of our operating portfolio square footage, occupancy and leasing statistics included below and elsewhere in this Annual Report on Form 10-K exclude the effect of the two properties serving as collateral for nonrecourse mortgage debt that was in default due to the expected debt extinguishment via conveyance of such properties (totaling 665,000 square feet that were 36.1% occupied as of December 31, 2014); effective April 1, 2014, all cash flows from such properties belong to the lender.
Employees
As of December 31, 2014, we had 378 employees, none of whom were parties to collective bargaining agreements. We believe that our relations with our employees are good.
Competition
The commercial real estate market is highly competitive. Numerous commercial properties compete with us for tenants. Some of the properties competing with ours may be newer or in more desirable locations, or the competing properties’ owners may be willing to accept lower rents than are acceptable to us. We also compete with our own tenants, many of whom have the right to sublease their space. The competitive environment for leasing is affected considerably by a number of factors including, among other things, changes in economic conditions and supply of and demand for space. These factors may make it difficult for us to lease existing vacant space and space associated with future lease expirations at rental rates that are sufficient to meeting our short-term capital needs.
We compete for the acquisition of commercial properties with many entities, including other publicly-traded commercial REITs. Competitors for such acquisitions may have substantially greater financial resources than ours. In addition, our competitors may be willing to accept lower returns on their investments or may be willing to incur higher leverage. If our competitors prevent us from buying properties that we have targeted for acquisition, we may not be able to meet our property acquisition goals.
We also compete with many entities, including other publicly-traded commercial REITs, for capital. This competition could adversely affect our ability to raise capital we may need to fulfill our capital strategy.
Item 1A. Risk Factors
Set forth below are risks and uncertainties relating to our business and the ownership of our securities. You should carefully consider each of these risks and uncertainties and all of the information in this Annual Report on Form 10-K and its Exhibits, including our consolidated financial statements and notes thereto for the year ended December 31, 2014, which are included in a separate section at the end of this report beginning on page F-1.
Our performance and value are subject to risks associated with our properties and with the real estate industry. Real estate investments are subject to various risks and fluctuations in value and demand, many of which are beyond our control. Our economic performance and the value of our real estate assets may decline due to conditions in the general economy and the real estate business which, in turn, could have an adverse effect on our financial position, results of operations, cash flows and ability to make expected distributions to our shareholders. These conditions include, but are not limited to:
| |
• | downturns in national, regional and local economic environments, including increases in the unemployment rate and inflation or deflation; |
| |
• | competition from other properties; |
| |
• | deteriorating local real estate market conditions, such as oversupply, reduction in demand and decreasing rental rates; |
| |
• | declining real estate valuations; |
| |
• | increasing vacancies and the need to periodically repair, renovate and re-lease space; |
| |
• | adverse developments concerning our tenants, which could affect our ability to collect rents and execute lease renewals; |
| |
• | government actions and initiatives, including risks associated with the impact of prolonged government shutdowns and budgetary reductions or impasses, such as a reduction of rental revenues, non-renewal of leases and/or a curtailment of demand for additional space by our strategic customers; |
| |
• | increasing operating costs, including insurance expenses, utilities, real estate taxes and other expenses, much of which we may not be able to pass through to tenants; |
| |
• | increasing interest rates and unavailability of financing on acceptable terms or at all; |
| |
• | trends in office real estate that may adversely affect future demand, including telecommuting and flexible workplaces that increase the population density per square foot; |
| |
• | adverse changes in taxation or zoning laws; |
| |
• | potential inability to secure adequate insurance; |
| |
• | adverse consequences resulting from civil disturbances, natural disasters, terrorist acts or acts of war; and |
| |
• | potential liability under environmental or other laws or regulations. |
We may suffer adverse consequences as a result of adverse economic conditions. Our business may be affected by adverse economic conditions in the United States economy or real estate industry as a whole or by the local economic conditions in the markets in which our properties are located, including the impact of high unemployment and constrained credit. Adverse economic conditions could increase the likelihood of tenants encountering financial difficulties, including bankruptcy, insolvency or general downturn of business, and as a result could increase the likelihood of tenants defaulting on their lease obligations to us. Such conditions also could increase the likelihood of our being unsuccessful in renewing tenants, renewing tenants on terms less favorable to us or being unable to lease newly constructed properties. In addition, such conditions could increase the level of risk that we may not be able to obtain new financing for development activities, acquisitions, refinancing of existing debt or other capital requirements at reasonable terms, if at all. As a result, adverse economic conditions could collectively have an adverse effect on our financial position, results of operations, cash flows and ability to make expected distributions to our equityholders.
We may suffer adverse consequences as a result of our reliance on rental revenues for our income. We earn revenue from renting our properties. Our operating costs do not necessarily fluctuate in relation to changes in our rental revenue. This means that our costs will not necessarily decline and may increase even if our revenues decline.
For new tenants or upon lease expiration for existing tenants, we generally must make improvements and pay other leasing costs for which we may not receive increased rents. We also make building-related capital improvements for which tenants may not reimburse us.
If our properties do not generate revenue sufficient to meet our operating expenses and capital costs, we may have to borrow additional amounts to cover these costs. In such circumstances, we would likely have lower profits or possibly incur losses. We may also find in such circumstances that we are unable to borrow to cover such costs, in which case our operations could be adversely affected. Moreover, there may be less or no cash available for distributions to our equityholders.
In addition, the competitive environment for leasing is affected considerably by a number of factors including, among other things, changes due to economic factors such as supply and demand. These factors may make it difficult for us to lease existing vacant space and space associated with future lease expirations at rental rates that are sufficient to meet our short-term capital needs.
We rely on the ability of our tenants to pay rent and would be harmed by their inability to do so. Our performance depends on the ability of our tenants to fulfill their lease obligations by paying their rental payments in a timely manner. If one or more of our major tenants, or a number of our smaller tenants, were to experience financial difficulties, including bankruptcy, insolvency, government shutdown, or general downturn of business, there could be an adverse effect on our financial position, results of operations, cash flows and ability to make expected distributions to our equityholders.
We may be adversely affected by developments concerning some of our major tenants and sector concentrations, including prolonged shutdowns of the United States Government and actual, or potential, reductions in government spending targeting United States Government agencies and defense contractors engaged in knowledge-based activities. As of December 31, 2014, our 20 largest tenants accounted for 65.3% of the total annualized rental revenue of our office properties, and the five largest of these tenants accounted for 46.0%. We calculated the annualized rental revenue by multiplying by 12 the sum of monthly contractual base rents and estimated monthly expense reimbursements under active leases in our portfolio of office properties as of December 31, 2014. Information regarding our five largest tenants is set forth below:
|
| | | | | | | | |
Tenant | |
Annualized Rental Revenue as of December 31, 2014 | | Percentage of Total Annualized Rental Revenue of Office Properties | |
Number of Leases |
| | (in thousands) | | | | |
United States of America | | $ | 123,117 |
| | 27.6% | | 58 |
Booz Allen Hamilton, Inc. | | 23,927 |
| | 5.4% | | 7 |
Northrop Grumman Corporation (1) | | 22,397 |
| | 5.0% | | 9 |
General Dynamics Corporation (1) | | 18,736 |
| | 4.2% | | 7 |
The Boeing Company (1) | | 17,171 |
| | 3.8% | | 11 |
| |
(1) | Includes affiliated organizations and agencies and predecessor companies. |
Most of our leases with the United States Government provide for a series of one-year terms or provide for early termination rights. The United States Government may terminate its leases if, among other reasons, the United States Congress fails to provide funding. If any of our four largest tenants fail to make rental payments to us, including as a result of a prolonged government shutdown, or if the United States Government elects to terminate some or all of its leases and the space cannot be re-leased on satisfactory terms, there would be an adverse effect on our financial performance and ability to make distributions to our equityholders.
As of December 31, 2014, 76.6% of the total annualized rental revenue of our office properties was from properties located near defense installations and other knowledge-based government demand drivers, or that were otherwise at least 50% occupied by United States Government agencies or defense contractors. We expect to maintain a high revenue concentration with United States Government agencies and defense contractors, most of whom are engaged in knowledge-based defense and security activities. A reduction in government spending targeting these activities could affect the ability of these tenants to fulfill lease obligations, decrease the likelihood that these tenants will renew their leases or enter into new leases and limit our future growth from these sectors. Moreover, uncertainty regarding the potential for future reduction in government spending targeting these activities could also decrease or delay leasing activity from tenants engaged in these activities. A reduction in government spending targeting knowledge-based defense and security activities and/or uncertainty regarding the potential for
future spending reductions could have an adverse effect on our results of operations, financial condition, cash flows and ability to make distributions to our equityholders.
We may suffer adverse consequences due to our inexperience in developing, managing and leasing wholesale data centers. We have significant experience in developing, managing and leasing single user data center space. However, we do not have the same depth and length of experience in relation to wholesale data centers, having acquired only one such center in 2010. This may increase the likelihood of us being unsuccessful in executing our plans with respect to that center or any similar centers that we may acquire or develop in the future. If we are unsuccessful in executing our wholesale data center plans, we could record an impairment loss, which would adversely affect our financial position and results of operations.
Most of our properties are geographically concentrated in the Mid-Atlantic region, particularly in the Greater Washington, DC/Baltimore region, or in particular office parks. We may suffer economic harm in the event of a decline in the real estate market or general economic conditions in those regions or parks. Most of our properties are located in the Mid-Atlantic region of the United States and, as of December 31, 2014, our properties located in the Greater Washington, DC/Baltimore region accounted for a combined 85.1% of our total annualized rental revenue from office properties. Our properties are also often concentrated in office parks in which we own most of the properties. Consequently, our portfolio of properties is not broadly distributed geographically. As a result, a decline in the real estate market or general economic conditions in the Mid-Atlantic region, the Greater Washington, DC/Baltimore region or the office parks in which our properties are located could have an adverse effect on our financial position, results of operations, cash flows and ability to make expected distributions to our equityholders.
We would suffer economic harm if we were unable to renew our leases on favorable terms. When leases expire, our tenants may not renew or may renew on terms less favorable to us than the terms of their original leases. If a tenant vacates a property, we can expect to experience a vacancy for some period of time, as well as incur higher leasing costs than we would likely incur if a tenant renews. As a result, our financial performance and ability to make expected distributions to our equityholders could be adversely affected if we experience a high volume of tenant departures at the end of their lease terms.
We may be adversely affected by trends in the office real estate industry. Some businesses increasingly permit employee telecommuting, flexible work schedules, open workplaces and teleconferencing. These practices enable businesses to reduce their space requirements. These trends could over time erode the overall demand for office space and, in turn, place downward pressure on occupancy, rental rates and property valuations, each of which could have an adverse effect on our financial position, results of operations, cash flows and ability to make expected distributions to our equityholders.
We may encounter a decline in the value of our real estate. The value of our real estate could be adversely affected by general economic and market conditions connected to a specific property, a market or submarket, a broader economic region or the office real estate industry. Examples of such conditions include a broader economic recession, declining demand and decreases in market rental rates and/or market values of real estate assets. If our real estate assets decline in value, it could result in our recognition of impairment losses. Moreover, a decline in the value of our real estate could adversely affect the amount of borrowings available to us under credit facilities and other loans, which could, in turn, adversely affect our cash flows and financial condition.
We may not be able to compete successfully with other entities that operate in our industry. The commercial real estate market is highly competitive. We compete for the purchase of commercial property with many entities, including other publicly traded commercial REITs. Many of our competitors have substantially greater financial resources than we do. If our competitors prevent us from buying properties that we target for acquisition, we may not be able to meet our property acquisition goals. Moreover, numerous commercial properties compete with our properties for tenants. Some of the properties competing with ours may be newer or in more desirable locations, or the competing properties’ owners may be willing to accept lower rates than are acceptable to us. Competition for property acquisitions, or for tenants for properties that we own, could have an adverse effect on our financial position, results of operations, cash flows and ability to make expected distributions to our equityholders.
We are dependent on external sources of capital for future growth. Because COPT is a REIT, it must distribute at least 90% of its annual taxable income to its shareholders. Due to this requirement, we are not able to significantly fund our acquisition, construction and development activities using retained cash flow from operations. Therefore, our ability to fund these activities is dependent on our ability to access debt or equity capital. Such capital could be in the form of new debt, common shares, preferred shares, common and preferred units in COPLP or joint venture funding. These capital sources may not be available on favorable terms or at all. Moreover, additional debt financing may substantially increase our leverage and subject us to covenants that restrict management’s flexibility in directing our operations, and additional equity offerings may
result in substantial dilution of our equityholders’ interests. Our inability to obtain capital when needed could have a material adverse effect on our ability to expand our business and fund other cash requirements.
We often use our Revolving Credit Facility to initially finance much of our investing activities and certain financing activities. We also use other credit facilities to fund a significant portion of our construction activities. Our lenders under these and other facilities could, for financial hardship or other reasons, fail to honor their commitments to fund our requests for borrowings under these facilities. If lenders under these facilities are not able or willing to fund a borrowing request, it would adversely affect our ability to access borrowing capacity under these facilities, which would in turn adversely affect our financial condition, cash flows and ability to make expected distributions to our equityholders.
We may be unable to successfully execute our plans to acquire existing commercial real estate properties. We intend to acquire existing commercial real estate properties to the extent that suitable acquisitions can be made on advantageous terms. Acquisitions of commercial properties entail risks, such as the risks that we may not be in a position, or have the opportunity in the future, to make suitable property acquisitions on advantageous terms and/or that such acquisitions will fail to perform as expected. The occurrence of these risk outcomes could adversely affect our financial position, results of operations, cash flows and ability to make expected distributions to our equityholders.
We may be exposed to unknown liabilities from acquired properties. We may acquire properties that are subject to liabilities in situations where we have no recourse, or only limited recourse, against the prior owners or other third parties with respect to unknown liabilities. As a result, if a liability were asserted against us based upon ownership of those properties, we might have to pay substantial sums to settle or contest it, which could adversely affect our results of operations and cash flow. Examples of unknown liabilities with respect to acquired properties include, but are not limited to:
| |
• | liabilities for clean-up of disclosed or undisclosed environmental contamination; |
| |
• | claims by tenants, vendors or other persons dealing with the former owners of the properties; |
| |
• | liabilities incurred in the ordinary course of business; and |
| |
• | claims for indemnification by general partners, directors, officers and others indemnified by the former owners of the properties. |
We may suffer economic harm as a result of making unsuccessful acquisitions in new markets. We may pursue selective acquisitions of properties in regions where we have not previously owned properties. These acquisitions may entail risks in addition to those we face in other acquisitions where we are familiar with the regions, such as the risk that we do not correctly anticipate conditions or trends in a new market and are therefore not able to operate the acquired property profitably. If this occurs, it could adversely affect our financial position, results of operations, cash flows and ability to make expected distributions to our equityholders.
We may be unable to execute our plans to develop and construct additional properties. Although the majority of our investments are in currently leased properties, we also develop, construct and redevelop properties, including some that are not fully pre-leased. When we develop, construct and redevelop properties, we assume the risk that actual costs will exceed our budgets, that we will experience conditions which delay or preclude project completion and that projected leasing will not occur, any of which could adversely affect our financial performance, results of operations and our ability to make distributions to our equityholders. In addition, we generally do not obtain construction financing commitments until the development stage of a project is complete and construction is about to commence. We may find that we are unable to obtain financing needed to continue with the construction activities for such projects.
Our data centers may become obsolete. Data centers are much more expensive investments on a per square foot basis than office properties due to the level of infrastructure required to operate the centers. At the same time, technology, industry standards and service requirements for data centers are rapidly evolving and, as a result, the risk of investments we make in data centers becoming obsolete is higher than office properties. Our data centers may become obsolete due to the development of new systems to deliver power to, or eliminate heat from, the servers housed in the properties, or due to other technological advances. In addition, we may not be able to efficiently upgrade or change power and cooling systems to meet new demands or industry standards without incurring significant costs that we may not be able to pass on to our tenants. The obsolescence of our data centers could adversely affect our financial position, results of operations, cash flows and ability to make expected distributions to our equityholders.
Certain of our properties containing data centers contain space not suitable for lease other than as data centers, which could make it difficult or impractical to reposition them for alternative use. Certain of our properties contain data center space, which is highly specialized space containing extensive electrical and mechanical systems that are designed uniquely to run and maintain banks of computer servers. As discussed above, our data centers are subject to obsolescence risks.
In the event that we needed to reposition data center space for another use, the renovations required to do so could be very difficult and costly, and we may, as a result, deem such renovations to be impractical. The inability to reposition our data center space could adversely affect our financial position, results of operations, cash flows and ability to make expected distributions to our equityholders.
Real estate investments are illiquid, and we may not be able to dispose of properties on a timely basis when we determine it is appropriate to do so. We may seek to dispose of properties in connection with our asset management strategy, the success of which may be key to our capital strategy. Real estate investments can be difficult to sell and convert to cash quickly, especially if market conditions are not favorable. Such illiquidity could limit our ability to quickly change our portfolio of properties in response to changes in economic or other conditions. Moreover, under certain circumstances, the Internal Revenue Code imposes certain penalties on a REIT that sells property held for less than two years and limits the number of properties it can sell in a given year. In addition, for certain of our properties that we acquired by issuing units in COPLP, we are restricted by agreements with the sellers of the properties for a certain period of time from entering into transactions (such as the sale or refinancing of the acquired property) that will result in a taxable gain to the sellers without the seller’s consent. Our failure to successfully execute such dispositions could adversely affect our ability to effectively execute our business strategy, which in turn could affect our financial position, results of operations, cash flows and ability to make expected distributions to equityholders.
We may suffer adverse effects as a result of the indebtedness that we carry and the terms and covenants that relate to this debt. Some of our properties are pledged by us to support repayment of indebtedness. Any foreclosure on our properties could result in loss of income and asset value that would negatively affect our financial condition, results of operations, cash flows and ability to make expected distributions to our equityholders. In addition, we rely on borrowings to fund some or all of the costs of new property acquisitions, construction and development activities and other items. Our organizational documents do not limit the amount of indebtedness that we may incur.
Payments of principal and interest on our debt may leave us with insufficient cash to operate our properties or pay distributions to COPT’s shareholders required to maintain its qualification as a REIT. We are also subject to the risks that:
| |
• | we may not be able to refinance our existing indebtedness, or may refinance on terms that are less favorable to us than the terms of our existing indebtedness; |
| |
• | in the event of our default under the terms of our Revolving Credit Facility, COPLP could be restricted from making cash distributions to COPT, which could result in reduced distributions to our equityholders or the need for us to incur additional debt to fund these distributions; and |
| |
• | if we are unable to pay our debt service on time or are unable to comply with restrictive financial covenants in certain of our debt, our lenders could foreclose on our properties securing such debt and, in some cases, other properties and assets that we own. |
Some of our unsecured debt is cross-defaulted, which means that failure to pay interest or principal on the debt above a threshold value will create a default on certain of our other debt.
If interest rates were to rise, our debt service payments on debt with variable interest rates would increase, which would adversely affect our financial position, results of operations, cash flows and ability to make expected distributions to our equityholders.
As of December 31, 2014, our scheduled debt maturities over the next five years were as of follows:
|
| | | | |
Year | | Amount (1) |
| | (in thousands) |
2015 | | $ | 343,545 |
|
2016 | | 171,399 |
|
2017 | | 339,247 |
|
2018 | | 2,036 |
|
2019 | | 122,094 |
|
| |
(1) | Represents principal maturities only and therefore excludes net discounts. As of December 31, 2014, maturities in 2015 include $150.0 million pertaining to a nonrecourse mortgage loan secured by two operating properties the title for which we expect to transfer to extinguish our debt obligation. Maturities also include $150.0 million in 2015 that may be extended for two one-year periods and $333.0 million in 2017 that may be extended for one year, subject to certain conditions. |
Our operations likely will not generate enough cash flow to repay some or all of this debt without additional borrowings, equity issuances and/or property sales. If we cannot refinance our debt, extend the repayment dates, or raise additional equity prior to the dates when our debt matures, we would default on our existing debt, which would have an adverse effect on our financial position, results of operations, cash flows and ability to make expected distributions to our equityholders.
A downgrade in our credit ratings could materially adversely affect our business and financial condition. COPLP’s Senior Notes are currently rated investment grade by the three major rating agencies. These credit ratings are subject to ongoing evaluation by the credit rating agencies and can change. Any downgrades in terms of ratings or outlook by the credit rating agencies could have a material adverse impact on our cost and availability of capital, which could in turn have a material adverse impact on our financial condition, results of operations, cash flows and ability to make expected distributions to our equityholders, and also have a material adverse effect on the market price of COPT’s common shares.
We have certain distribution requirements that reduce cash available for other business purposes. Since COPT is a REIT, it must distribute at least 90% of its annual taxable income, which limits the amount of cash that can be retained for other business purposes, including amounts to fund acquisitions and development activity. Also, it is possible that because of the differences between the time we actually receive revenue or pay expenses and the period during which we report those items for distribution purposes, we may have to borrow funds for COPT to meet the 90% distribution requirement.
We may be unable to continue to make equityholders distributions at expected levels. We expect to make regular quarterly cash distributions to our equityholders. However, our ability to make such distributions depends on a number of factors, some of which are beyond our control. Some of our loan agreements contain provisions that could restrict future distributions. Our ability to make distributions at expected levels will also be dependent, in part, on other matters, including, but not limited to:
| |
• | continued property occupancy and timely receipt of rent obligations; |
| |
• | the amount of future capital expenditures and expenses relating to our properties; |
| |
• | the level of leasing activity and future rental rates; |
| |
• | the strength of the commercial real estate market; |
| |
• | governmental actions and initiatives, including risks associated with the impact of a prolonged government shutdown or budgetary reductions or impasses; |
| |
• | our costs of compliance with environmental and other laws; |
| |
• | our corporate overhead levels; |
| |
• | our amount of uninsured losses; and |
| |
• | our decision to reinvest in operations rather than distribute available cash. |
In addition, we can make distributions to the holders of our common shares/units only after we make preferential distributions to holders of our preferred shares/units.
Our ability to pay distributions may be limited, and we cannot provide assurance that we will be able to pay distributions regularly. Our ability to pay distributions will depend on a number of things discussed elsewhere herein, including our ability to operate profitably and generate cash flow from our operations. We cannot guarantee that we will be able to pay distributions on a regular quarterly basis in the future. Additionally, the terms of some of COPLP’s debt may limit its ability to make some types of payments and other distributions to COPT. This in turn may limit our ability to make some types of payments, including payment of distributions on common or preferred shares/units, unless we meet certain financial tests or such payments or distributions are required to maintain COPT’s qualification as a REIT. As a result, if we are unable to meet the applicable financial tests, we may not be able to pay distributions in one or more periods. Furthermore, any new common or preferred shares/units that may in the future be issued for raising capital, financing acquisitions, share-based compensation arrangements or otherwise will increase the cash required to continue to pay cash distributions at current levels.
We may incur additional indebtedness, which may harm our financial position and cash flow and potentially impact our ability to pay distributions to equityholders. Our governing documents do not limit us from incurring additional indebtedness and other liabilities. As of December 31, 2014, we had $1.9 billion of indebtedness outstanding. We may incur additional indebtedness and become more highly leveraged, which could harm our financial position and potentially limit our cash available to pay distributions to equityholders.
Our ability to pay distributions is further limited by the requirements of Maryland law. As a Maryland REIT, COPT may not under applicable Maryland law make a distribution if either of the following conditions exists after giving effect to the distribution: (1) the REIT would not be able to pay its debts as the debts become due in the usual course of business; or (2) the
REIT’s total assets would be less than the sum of its total liabilities plus the amount that would be needed, if the REIT were dissolved at the time of the distribution, to satisfy upon dissolution the rights of equityholders whose preferential rights are superior to those receiving the distribution. Therefore, we may not be able to make expected distributions to our equityholders if either of the above described conditions exists for COPT after giving effect to the distribution.
We may issue additional common or preferred shares/units that dilute our equityholders’ interests. We may issue additional common and preferred shares/units without shareholder approval. Similarly, COPT may cause COPLP to issue its common or preferred units for contributions of cash or property without approval by the limited partners of COPLP or COPT’s shareholders. Our existing equityholders’ interests could be diluted if such additional issuances were to occur.
We may suffer economic harm as a result of the actions of our partners in real estate joint ventures and other investments. We may invest in certain entities in which we are not the exclusive investor or principal decision maker. Investments in such entities may, under certain circumstances, involve risks not present when a third party is not involved, including the possibility that the other parties to these investments might become bankrupt or fail to fund their share of required capital contributions. Our partners in these entities may have economic, tax or other business interests or goals that are inconsistent with our business interests or goals, and may be in a position to take actions contrary to our policies or objectives. Such investments may also lead to impasses, for example, as to whether to sell a property, because neither we nor the other parties to these investments may have full control over the entity. In addition, we may in certain circumstances be liable for the actions of the other parties to these investments. Each of these factors could have an adverse effect on our financial condition, results of operations, cash flows and ability to make expected distributions to our equityholders.
We may elect to make additional cash outlays to protect our investment in loans we make that are subordinate to other loans. We have made, and may in the future make, loans under which we have a secured interest in the ownership of a property that is subordinate to other loans on the property. If a default were to occur under the terms of any such loans with us or under the first mortgage loans related to the properties on such loans, we may, in order to protect our investment, elect to either (1) purchase the other loan, or (2) foreclose on the ownership interest in the property and repay the first mortgage loan, either of which could have an adverse effect on our financial condition, results of operations, cash flows and ability to make expected distributions to our equityholders.
We may be subject to possible environmental liabilities. We are subject to various Federal, state and local environmental laws, including air and water quality, hazardous or toxic substances and health and safety. These laws can impose liability on current and prior property owners or operators for the costs of removal or remediation of hazardous substances released on a property, even if the property owner was not responsible for, or even aware of, the release of the hazardous substances. Costs resulting from environmental liability could be substantial. The presence of hazardous substances on our properties may also adversely affect occupancy and our ability to sell or borrow against those properties. In addition to the costs of government claims under environmental laws, private plaintiffs may bring claims for personal injury or other reasons. Additionally, various laws impose liability for the costs of removal or remediation of hazardous substances at the disposal or treatment facility. Anyone who arranges for the disposal or treatment of hazardous substances at such a facility is potentially liable under such laws. These laws often impose liability on an entity even if the facility was not owned or operated by the entity.
Although most of our properties have been subject to varying degrees of environmental assessment, many of these assessments are limited in scope and may not include or identify all potential environmental liabilities or risks associated with the property. Identification of new compliance concerns or undiscovered areas of contamination, changes in the extent or known scope of contamination, discovery of additional sites, human exposure to the contamination or changes in cleanup or compliance requirements could result in significant costs to us that could have an adverse effect on our financial condition, results of operations, cash flows and ability to make expected distributions to our equityholders.
Terrorist attacks may adversely affect the value of our properties, our financial position and cash flows. We have significant investments in properties located in large metropolitan areas and near military installations. Future terrorist attacks could directly or indirectly damage our properties or cause losses that materially exceed our insurance coverage. After such an attack, tenants in these areas may choose to relocate their businesses to areas of the United States that may be perceived to be less likely targets of future terrorist activity, and fewer customers may choose to patronize businesses in these areas. This in turn would trigger a decrease in the demand for space in these areas, which could increase vacancies in our properties and force us to lease space on less favorable terms. As a result, the occurrence of terrorist attacks could adversely affect our financial position, results of operations, cash flows and ability to make expected distributions to our equityholders.
We may be subject to other possible liabilities that would adversely affect our financial position and cash flows. Our properties may be subject to other risks related to current or future laws, including laws benefiting disabled persons, state or
local laws relating to zoning, construction, fire and life safety requirements and other matters. These laws may require significant property modifications in the future and could result in the levy of fines against us. In addition, although we believe that we adequately insure our properties, we are subject to the risk that our insurance may not cover all of the costs to restore a property that is damaged by a fire or other catastrophic events, including acts of war or, as mentioned above, terrorism. The occurrence of any of these events could have an adverse effect on our financial condition, results of operations, cash flows and ability to make expected distributions to our equityholders.
We may be subject to increased costs of insurance and limitations on coverage, particularly regarding acts of terrorism. Our portfolio of properties is insured for losses under our property, casualty and umbrella insurance policies through September 30, 2015. These policies include coverage for acts of terrorism. Future changes in the insurance industry’s risk assessment approach and pricing structure may increase the cost of insuring our properties and decrease the scope of insurance coverage, either of which could adversely affect our financial position and operating results. Most of our loan agreements contain customary covenants requiring us to maintain insurance. Although we believe that we have adequate insurance coverage for purposes of these agreements, we may not be able to obtain an equivalent amount of coverage at reasonable costs, or at all, in the future. In addition, if lenders insist on greater coverage than we are able to obtain, it could adversely affect our ability to finance and/or refinance our properties and execute our growth strategies, which, in turn, would have an adverse effect on our financial condition, results of operations, cash flows and ability to make expected distributions to our equityholders.
Our business could be adversely affected by a negative audit by the United States Government. Agencies of the United States, including the Defense Contract Audit Agency and various agency Inspectors General, routinely audit and investigate government contractors. These agencies review a contractor’s performance under its contracts, cost structure and compliance with applicable laws, regulations, and standards. The United States Government also reviews the adequacy of, and a contractor’s compliance with, its internal control systems and policies. Any costs found to be misclassified may be subject to repayment. If an audit or investigation uncovers improper or illegal activities, we may be subject to civil or criminal penalties and administrative sanctions, including termination of contracts, forfeiture of profits, suspension of payments, fines, and suspension or prohibition from doing business with the United States Government. In addition, we could suffer serious reputational harm if allegations of impropriety were made against us.
Our business could be adversely affected by security breaches through cyber attacks, cyber intrusions or otherwise. We face risks associated with security breaches and other significant disruptions of our information technology networks and related systems, which are essential to our business operations. Such breaches and disruptions may occur through cyber attacks or cyber intrusions over the Internet, malware, computer viruses, attachments to e-mails, persons inside our organization or persons with access to systems inside our organization. Because of our concentration on serving United States Government agencies and their contractors with a general focus on national security and information technology, we may be especially likely to be targeted by cyber attacks, including by governments, organizations or persons hostile to our government. Despite our activities to maintain the security and integrity of our networks and related systems, there can be no absolute assurance that these activities will be effective. A security breach involving our networks and related systems could disrupt our operations in numerous ways, including by creating difficulties for our tenants that may reflect poorly on us, that could ultimately have an adverse effect on our financial condition, results of operations, cash flows and ability to make expected distributions to our equityholders.
COPT’s ownership limits are important factors. COPT’s Declaration of Trust limits ownership of its common shares by any single shareholder to 9.8% of the number of the outstanding common shares or 9.8% of the value of the outstanding common shares, whichever is more restrictive. COPT’s Declaration of Trust also limits ownership by any single shareholder of our common and preferred shares in the aggregate to 9.8% of the aggregate value of the outstanding common and preferred shares. We call these restrictions the “Ownership Limit.” COPT’s Declaration of Trust allows our Board of Trustees to exempt shareholders from the Ownership Limit. The Ownership Limit and the restrictions on ownership of our common shares may delay or prevent a transaction or a change of control that might involve a premium price for our common shares/units or otherwise be in the best interest of our equityholders.
COPT’s Declaration of Trust includes other provisions that may prevent or delay a change of control. Subject to the requirements of the New York Stock Exchange, our Board of Trustees has the authority, without shareholder approval, to issue additional securities on terms that could delay or prevent a change in control. In addition, our Board of Trustees has the authority to reclassify any of our unissued common shares into preferred shares. Our Board of Trustees may issue preferred shares with such preferences, rights, powers and restrictions as our Board of Trustees may determine, which could also delay or prevent a change in control.
The Maryland business statutes impose potential restrictions that may discourage a change of control of our company. Various Maryland laws may have the effect of discouraging offers to acquire us, even if the acquisition would be advantageous to equityholders. Resolutions adopted by our Board of Trustees and/or provisions of our bylaws exempt us from such laws, but our Board of Trustees can alter its resolutions or change our bylaws at any time to make these provisions applicable to us.
COPT’s failure to qualify as a REIT would have adverse tax consequences, which would substantially reduce funds available to make distributions to our equityholders. We believe that COPT has qualified for taxation as a REIT for Federal income tax purposes since 1992. We plan for COPT to continue to meet the requirements for taxation as a REIT. Many of these requirements, however, are highly technical and complex. The determination that we are a REIT requires an analysis of various factual matters and circumstances that may not be totally within our control. For example, to qualify as a REIT, at least 95% of COPT’s gross income must come from certain sources that are specified in the REIT tax laws. COPT is also required to distribute to shareholders at least 90% of its REIT taxable income (excluding capital gains). The fact that COPT holds most of its assets through COPLP and its subsidiaries further complicates the application of the REIT requirements. Even a technical or inadvertent mistake could jeopardize COPT’s REIT status. Furthermore, Congress and the Internal Revenue Service might make changes to the tax laws and regulations and the courts might issue new rulings that make it more difficult or impossible for COPT to remain qualified as a REIT.
If COPT fails to qualify as a REIT, it would be subject to Federal income tax at regular corporate rates. Also, unless the Internal Revenue Service granted us relief under certain statutory provisions, COPT would remain disqualified as a REIT for four years following the year it first fails to qualify. If COPT fails to qualify as a REIT, it would have to pay significant income taxes and would therefore have less money available for investments or for distributions to our equityholders. In addition, if COPT fails to qualify as a REIT, it will no longer be required to pay distributions to shareholders. As a result of all these factors, COPT’s failure to qualify as a REIT could impair our ability to expand our business and raise capital and would likely have a significant adverse effect on the value of our shares/units.
We could face possible adverse changes in tax laws, which may result in an increase in our tax liability. From time to time, changes in state and local tax laws or regulations are enacted that may result in an increase in our tax liability. The shortfall in tax revenues for states and municipalities in recent years may lead to an increase in the frequency and size of such changes. If such changes occur, we may be required to pay additional taxes on our assets or income. These increased tax costs could adversely affect our financial condition and results of operations and the amount of cash available for distributions to our equityholders.
A number of factors could cause our security prices to decline. As is the case with any publicly-traded securities, certain factors outside of our control could influence the value of COPT’s common and preferred shares. These conditions include, but are not limited to:
| |
• | market perception of REITs in general and office REITs in particular; |
| |
• | market perception regarding our major tenants and sector concentrations; |
| |
• | the level of institutional investor interest in COPT; |
| |
• | general economic and business conditions; |
| |
• | prevailing interest rates; |
| |
• | our financial performance; |
| |
• | our underlying asset value; |
| |
• | market perception of our financial condition, performance, dividends and growth potential; and |
| |
• | adverse changes in tax laws. |
We may experience significant losses and harm to our financial condition if financial institutions holding our cash and cash equivalents file for bankruptcy protection. We believe that we maintain our cash and cash equivalents with high quality financial institutions. We have not experienced any losses to date on our deposited cash. However, we may incur significant losses and harm to our financial condition in the future if any of these financial institutions files for bankruptcy protection.
Item 1B. Unresolved Staff Comments
None
Item 2. Properties
The following table provides certain information about our office property markets and submarkets as of December 31, 2014, excluding the effect of the two properties serving as collateral for nonrecourse mortgage debt that was in default and expected to be extinguished via conveyance of such properties (totaling 665,000 square feet that were 36.1% occupied as of December 31, 2014):
|
| | | | | | | | | | | | | | |
Property Region, Business Park/Submarket and Location | | Number of Buildings | | Rentable Square Feet | | Occupancy (1) | | Annualized Rental Revenue (2) (in thousands) | | Annualized Rental Revenue per Occupied Square Foot (2)(3) |
Baltimore/Washington Corridor: | | | | | | | | | | |
National Business Park - Annapolis Junction, MD | | 29 | | 3,485,071 |
| | 95.7 | % | | $ | 121,378 |
| | $36.38 |
Columbia Gateway - Columbia, MD | | 27 | | 2,141,654 |
| | 91.3 | % | | 47,510 |
| | 24.29 |
Airport Square/bwtech - Linthicum, MD | | 14 | | 1,090,111 |
| | 86.4 | % | | 23,639 |
| | 25.10 |
Commons/Parkway - Hanover, MD | | 10 | | 431,246 |
| | 91.1 | % | | 9,322 |
| | 23.73 |
Other | | 11 | | 1,119,849 |
| | 98.2 | % | | 31,632 |
| | 28.78 |
Subtotal / Average | | 91 | | 8,267,931 |
| | 93.4 | % | | $ | 233,481 |
| | $30.22 |
| | | | | | | | | | |
Northern Virginia: | | | | | | | | | | |
Westfields Corporate Center - Chantilly, VA | | 7 | | 769,035 |
| | 75.5 | % | | $ | 16,048 |
| | $27.64 |
Patriot Ridge - Springfield, VA | | 1 | | 239,272 |
| | 51.3 | % | | 4,995 |
| | 40.67 |
Herndon, Tysons Corner and Merrifield, VA | | 9 | | 1,701,754 |
| | 92.6 | % | | 51,546 |
| | 32.71 |
Other | | 3 | | 543,765 |
| | 100.0 | % | | 5,856 |
| | 10.77 |
Subtotal / Average | | 20 | | 3,253,826 |
| | 86.8 | % | | $ | 78,445 |
| | $27.79 |
| | | | | | | | | | |
San Antonio: | | | | | | | | | | |
Sentry Gateway - San Antonio, TX | | 6 | | 792,454 |
| | 100.0 | % | | $ | 33,907 |
| | $42.79 |
Other | | 2 | | 120,054 |
| | 73.8 | % | | 1,709 |
| | 19.29 |
Subtotal / Average | | 8 | | 912,508 |
| | 96.6 | % | | $ | 35,616 |
| | $40.42 |
| | | | | | | | | | |
Huntsville | | 5 | | 562,757 |
| | 80.8 | % | | $ | 9,628 |
| | $21.17 |
| | | | | | | | | | |
Washington DC-Capitol Riverfront | | 2 | | 360,326 |
| | 74.4 | % | | $ | 12,388 |
| | $46.22 |
| | | | | | | | | | |
St. Mary’s & King George Counties | | 18 | | 874,408 |
| | 90.8 | % | | $ | 15,530 |
| | $19.56 |
| | | | | | | | | | |
Greater Baltimore: | | | | | | | | | | |
White Marsh, MD and Timonium, MD | | 20 | | 984,186 |
| | 93.2 | % | | $ | 20,150 |
| | $21.97 |
Baltimore City, MD | | 1 | | 480,348 |
| | 97.9 | % | | 15,927 |
| | 33.86 |
North Gate Business Park - Aberdeen, MD | | 3 | | 284,907 |
| | 46.0 | % | | 4,037 |
| | 30.82 |
Subtotal / Average | | 24 | | 1,749,441 |
| | 86.8 | % | | $ | 40,114 |
| | $26.41 |
| | | | | | | | | | |
Greater Philadelphia, Pennsylvania | | 3 | | 513,347 |
| | 96.2 | % | | $ | 11,827 |
| | $23.96 |
| | | | | | | | | | |
Other Region | | 2 | | 295,842 |
| | 100.0 | % | | $ | 9,555 |
| | $32.30 |
| | | | | | | | | | |
Total | | 173 | | 16,790,386 |
| | 90.9 | % | | $ | 446,584 |
| | $29.27 |
| | | | | | | | | | |
| |
(1) | This percentage is based upon all rentable square feet under lease terms that were in effect as of December 31, 2014. |
| |
(2) | Annualized rental revenue is the monthly contractual base rent as of December 31, 2014 (ignoring free rent then in effect) multiplied by 12, plus the estimated annualized expense reimbursements under existing leases. We consider annualized rental revenue to be a useful measure for analyzing revenue sources because, since it is point-in-time based, it does not contain increases and decreases in revenue associated with periods in which lease terms were not in effect; historical revenue under generally accepted accounting principles does contain such fluctuations. We find the measure particularly useful for leasing, tenant, segment and industry analysis. |
| |
(3) | Annualized rental revenue per occupied square foot is a property’s annualized rental revenue divided by that property’s occupied square feet as of December 31, 2014. Our computation of annualized rental revenue excludes the effect of lease incentives. The annualized rent per occupied square foot, including the effect of lease incentives, for our total office portfolio and two largest regions follows: total office portfolio: $29.09; Baltimore/Washington Corridor: $30.11; and Northern Virginia: $27.61. |
The following table provides certain information about our office properties that were under, or contractually committed for, construction, or had redevelopment underway, or otherwise approved, as of December 31, 2014 (dollars in thousands): |
| | | | | | | | | | | | | | | | | | |
Property and Location | | Submarket | | Estimated Rentable Square Feet Upon Completion | | Percentage Leased | | Calendar Quarter of Anticipated Completion | | Costs Incurred to Date (1) | | Estimated Costs to Complete (1) |
Under Construction | | | | | | | | | | | | |
Baltimore/Washington Corridor: | | | | | | | | | | | | |
310 Sentinel Way | | National | | 191,464 |
| | 0 | % | | 1Q 2016 | | $ | 36,324 |
| | $ | 20,976 |
|
Annapolis Junction, MD | | Business Park | | | | | | | | | | |
7880 Milestone Parkway | | Arundel | | 119,980 |
| | 74 | % | | 3Q 2016 | | 17,929 |
| | 13,606 |
|
Hanover, MD | | Preserve | | | | | | | | | | |
Subtotal / Average | | | | 311,444 |
| | 28 | % | | | | $ | 54,253 |
| | $ | 34,582 |
|
| | | | | | | | | | | | |
Northern Virginia: | | | | | | | | | | | | |
NOVA Office A | | Other Northern | | 159,300 |
| | 100 | % | | 1Q 2015 | | $ | 44,067 |
| | 493 |
|
Northern Virginia | | Virginia | | | | | | | | | | |
Ashburn Crossing - DC 10 | | Ashburn | | 120,000 |
| | 100 | % | | 1Q 2015 | | 12,815 |
| | 3,460 |
|
Ashburn, Virginia | | Crossing | | | | | | | | | | |
NOVA Office B | | Other Northern | | 161,030 |
| | 0 | % | | 1Q 2016 | | 22,927 |
| | 18,573 |
|
Northern Virginia | | Virginia | | | | | | | | | | |
NOVA Office D | | Other Northern | | 240,000 |
| | 100 | % | | 2Q 2017 | | 8,365 |
| | 38,160 |
|
Northern Virginia | | Virginia | | | | | | | | | | |
Subtotal / Average | | | | 680,330 |
| | 76 | % | | | | $ | 88,174 |
| | $ | 60,686 |
|
| | | | | | | | | | | | |
San Antonio: | | | | | | | | | | | | |
Sentry Gateway - Z | | San Antonio | | 160,466 |
| | 100 | % | | 1Q 2015 | | $ | 25,157 |
| | $ | 9,558 |
|
San Antonio, TX | | | | | | | | | | | | |
| | | | | | | | | | | | |
Huntsville: | | | | | | | | | | | | |
7400 Redstone Gateway | | Huntsville | | 69,191 |
| | 100 | % | | 3Q 2015 | | $ | 4,841 |
| | $ | 5,167 |
|
Huntsville, AL | | | | | | | | | | | | |
| | | | | | | | | | | | |
Total Under Construction | | | | 1,221,431 |
| | 69 | % | | | | $ | 172,425 |
| | $ | 109,993 |
|
| | | | | | | | | | | | |
Under Redevelopment | | | | | | | | | | | | |
Baltimore/Washington Corridor: | | | | | | | | | | | | |
6708 Alexander Bell Drive | | Howard County | | 52,000 |
| | 0 | % | | 1Q 2016 | | $ | 6,713 |
| | $ | 4,756 |
|
Columbia, MD | | Perimeter | | | | | | | | | | |
921 Elkridge Landing Road (AS 5) | | Airport | | 56,452 |
| | 0 | % | | To be | | $ | 3,787 |
| | To be |
Linthicum, MD | | Square | | | | | | determined | | | | determined |
1201 Winterson Road (AS 13) | | Airport | | 67,450 |
| | 0 | % | | 3Q 2016 | | 4,813 |
| | 11,950 |
|
Linthicum, MD | | Square | | | | | | | | | | |
Subtotal / Average | | | | 175,902 |
| | 0 | % | | | | $ | 15,313 |
| | $ | 16,706 |
|
| | | | | | | | | | | | |
St. Mary’s County | | | | | | | | | | | | |
44417 Pecan Court | | St. Mary’s | | 27,122 |
| | 0 | % | | 3Q 2015 | | $ | 2,689 |
| | $ | 2,688 |
|
California, MD | | County | | | | | | | | | | |
| | | | | | | | | | | | |
Greater Philadelphia: | | | | | | | | | | | | |
731 Arbor Way (Hillcrest III) | | Greater | | 140,765 |
| | 100 | % | | 2Q 2015 | | $ | 13,211 |
| | $ | 14,821 |
|
Blue Bell, PA | | Philadelphia | | | | | | | | | | |
| | | | | | | | | | | | |
Total Under Redevelopment | | | | 343,789 |
| | 41 | % | | | | $ | 31,213 |
| | $ | 34,215 |
|
(1) Includes land, construction, leasing costs and allocated portion of structured parking and other shared infrastructure, if applicable.
The following table provides certain information about our land held or under pre-construction as of December 31, 2014, including properties under ground lease to us: |
| | | | | |
Market/Submarket and Location | | Acres | | Estimated Developable Square Feet |
Land Held for Future Development | | | | |
Baltimore/Washington Corridor: | | | | |
|
National Business Park | | 193 | | 1,976 |
|
Arundel Preserve | | 83 | | 960 |
|
Columbia Gateway | | 27 | | 630 |
|
M Square | | 49 | | 525 |
|
Airport Square | | 5 | | 84 |
|
Subtotal | | 357 | | 4,175 |
|
Northern Virginia | | 71 | | 1,860 |
|
San Antonio | | 69 | | 1,033 |
|
Huntsville (1) | | 434 | | 4,103 |
|
St. Mary’s & King George Counties | | 44 | | 109 |
|
Greater Baltimore | | 49 | | 1,478 |
|
Greater Philadelphia (2) | | 41 | | 720 |
|
Total land held for future development | | 1,065 | | 13,478 |
|
| | | | |
Other Land | | | | |
Baltimore/Washington Corridor | | 6 | | 60 |
|
Greater Baltimore | | 115 | | 1,242 |
|
Colorado Springs | | 171 | | 2,540 |
|
Other | | 107 | | 1,000 |
|
Total other land held | | 399 | | 4,842 |
|
| | | | |
Total land held | | 1,464 | | 18,320 |
|
Land held for sale | | (56) | | (632 | ) |
Land held, net | | 1,408 | | 17,688 |
|
(1) This land is owned by the Unites States Government and is under a long term enhanced-use lease to us. We are not required to pay rent on the individual land sites included in this lease until tenants of properties completed on such land sites begin paying rent.
(2) Includes a property that was removed from service and placed under redevelopment in March 2014. This property will be reported as land held until its redevelopment plan is finalized and market demand supports commencement of such redevelopment.
The following table provides certain information about our wholesale data center property as of December 31, 2014:
|
| | | | | | |
Property and Location |
Year Built | Gross Building Area | Raised Floor Square Footage (1) | Initial Stabilization Critical Load (in MWs) (2) | MW Operational | MW Leased |
| | | | | |
9651 Hornbaker Road - Manassas, VA | 2010 | 233,000 | 100,000 | 19.25 | 9.00 | 6.56 |
| |
(1) | Raised floor square footage is that portion of the gross building area in which tenants locate their computer servers. Raised floor area is considered to be the net rentable square footage. |
| |
(2) | Critical load is the power available for exclusive use of tenants in the property (expressed in terms of megawatts (“MWs”)). |
Lease Expirations
The following table provides a summary schedule of the lease expirations for leases in place at our office properties as of December 31, 2014, assuming that none of the tenants exercise any early termination rights. This analysis includes the effect of early renewals completed on existing leases but excludes the effect of new tenant leases on 256,646 square feet executed but yet to commence as of December 31, 2014.
|
| | | | | | | | | | | | | | | | | | | | |
Year of Lease Expiration (1) | | Number of Leases Expiring | | Square Footage of Leases Expiring | | Percentage of Total Occupied Square Feet | | Annualized Rental Revenue of Expiring Leases (2) | | Percentage of Total Annualized Rental Revenue Expiring (2) | | Total Annualized Rental Revenue of Expiring Leases Per Occupied Square Foot |
| | | | | | | | (in thousands) | | | | |
2015 | | 120 |
| | 1,819,685 |
| | 11.9 | % | | $ | 52,780 |
| | 11.8 | % | |
| $29.01 |
|
2016 | | 85 |
| | 1,472,752 |
| | 9.7 | % | | 42,776 |
| | 9.6 | % | | 29.04 |
|
2017 | | 79 |
| | 1,882,897 |
| | 12.3 | % | | 56,291 |
| | 12.6 | % | | 29.90 |
|
2018 | | 75 |
| | 2,146,343 |
| | 14.1 | % | | 63,543 |
| | 14.2 | % | | 29.61 |
|
2019 | | 85 |
| | 1,977,815 |
| | 13.0 | % | | 58,955 |
| | 13.2 | % | | 29.81 |
|
2020 | | 63 |
| | 1,918,184 |
| | 12.6 | % | | 56,270 |
| | 12.6 | % | | 29.33 |
|
2021 | | 33 |
| | 696,253 |
| | 4.6 | % | | 21,313 |
| | 4.8 | % | | 30.61 |
|
2022 | | 17 |
| | 917,287 |
| | 6.0 | % | | 27,764 |
| | 6.2 | % | | 30.27 |
|
2023 | | 17 |
| | 649,529 |
| | 4.3 | % | | 12,927 |
| | 2.9 | % | | 19.90 |
|
2024 | | 15 |
| | 577,677 |
| | 3.8 | % | | 15,460 |
| | 3.5 | % | | 26.76 |
|
2025 | | 14 |
| | 1,034,020 |
| | 6.8 | % | | 34,901 |
| | 7.8 | % | | 33.75 |
|
2026 | | 2 |
| | 58,500 |
| | 0.4 | % | | 1,040 |
| | 0.2 | % | | 17.78 |
|
2027 | | 1 |
| | 16,200 |
| | 0.1 | % | | 435 |
| | 0.1 | % | | 26.86 |
|
2030 | | 2 |
| | 88,217 |
| | 0.6 | % | | 2,129 |
| | 0.5 | % | | 24.13 |
|
Total/Weighted Average | | 608 |
| | 15,255,359 |
| | 100.0 | % | | $ | 446,584 |
| | 100.0 | % | |
| $29.27 |
|
With regard to leases expiring in 2015, we believe that the weighted average annualized rental revenue per occupied square foot for such leases at December 31, 2014 was, on average, approximately 2% to 4% higher than estimated current market rents for the related space, with specific results varying by market.
The following table provides a summary schedule of the lease expirations for leases in place at our wholesale data center property as of December 31, 2014: |
| | | | | | | | | | | | | |
Year of Lease Expiration (1) | | Number of Leases Expiring | | Raised Floor Square Footage Expiring | | Critical Load Leased (in megawatts) | | Critical Load Used (in megawatts) | | Annualized Rental Revenue of Expiring Leases (2) |
| | | | | | | | | | (in thousands) |
2016 | | 1 | | 9,437 |
| | 2.00 | | 1.00 | | $ | 1,140 |
|
2018 | | 2 | | 1,283 |
| | 0.26 | | 0.26 | | 528 |
|
2019 | | 1 | | 6,374 |
| | 1.00 | | 1.00 | | 2,184 |
|
2020 | | 2 | | 11,122 |
| | 2.30 | | 2.00 | | 4,623 |
|
2022 | | 1 | | 5,590 |
| | 1.00 | | 1.00 | | 1,475 |
|
Total/Weighted Average | | 7 | | 33,806 |
| | 6.56 | | 5.26 | | $ | 9,950 |
|
| |
(1) | All of the leasing statistics set forth above assume no exercise of any existing early termination rights. In addition, most of the leases with our largest tenant, the United States Government, provide for consecutive one-year terms; all of the leasing statistics set forth above assume that the United States Government will remain in the space that they lease through the end of the respective arrangements, without ending consecutive one-year leases prematurely. |
| |
(2) | Annualized rental revenue is the monthly contractual base rent as of December 31, 2014 multiplied by 12, plus the estimated annualized expense reimbursements under existing office leases. Our computation of annualized rental revenue excludes the effect of lease incentives, although the effect of this exclusion is generally not material. |
Item 3. Legal Proceedings
We are not currently involved in any material litigation nor, to our knowledge, is any material litigation currently threatened against the Company or the Operating Partnership (other than routine litigation arising in the ordinary course of business, substantially all of which is expected to be covered by liability insurance).
Item 4. Mine Safety Disclosures
Not applicable.
PART II
Item 5. Market for Registrants’ Common Equity, Related Stockholder Matters and Issuer Purchases of Equity Securities
COPT’s common shares trade on the New York Stock Exchange (“NYSE”) under the symbol “OFC.” The table below shows the range of the high and low sale prices for COPT’s common shares as reported on the NYSE, as well as the quarterly common share dividends per share declared:
|
| | | | | | |
| | Price Range | | Dividends |
2013 | | Low | | High | | Per Share |
First Quarter | | $24.75 | | $27.52 | | $0.2750 |
Second Quarter | | $23.81 | | $29.95 | | $0.2750 |
Third Quarter | | $22.40 | | $28.85 | | $0.2750 |
Fourth Quarter | | $21.48 | | $25.37 | | $0.2750 |
| | | | | | |
| | Price Range | | Dividends |
2014 | | Low | | High | | Per Share |
First Quarter | | $23.55 | | $27.28 | | $0.2750 |
Second Quarter | | $26.18 | | $29.09 | | $0.2750 |
Third Quarter | | $25.53 | | $29.44 | | $0.2750 |
Fourth Quarter | | $25.29 | | $29.24 | | $0.2750 |
The number of holders of record of COPT’s common shares was 507 as of December 31, 2014. This number does not include shareholders whose shares are held of record by a brokerage house or clearing agency, but does include any such brokerage house or clearing agency as one record holder.
COPT pays dividends at the discretion of its Board of Trustees. COPT’s ability to pay cash dividends will be dependent upon: (1) the cash flow generated from our operations; (2) cash generated or used by our financing and investing activities; and (3) the annual distribution requirements under the REIT provisions of the Code described above and such other factors as the Board of Trustees deems relevant. COPT’s ability to make cash dividends will also be limited by the terms of COPLP’s Partnership Agreement, as well as by limitations imposed by state law. In addition, COPT is prohibited from paying cash dividends in excess of the amount necessary for it to qualify for taxation as a REIT if a default or event of default exists pursuant to the terms of our Revolving Credit Facility; this restriction does not currently limit COPT’s ability to pay dividends, and COPT does not believe that this restriction is reasonably likely to limit its ability to pay future dividends because it expects to comply with the terms of our Revolving Credit Facility.
There is no established public trading market for COPLP’s partnership units. Quarterly common unit distributions per unit were the same as quarterly common dividends per share declared by COPT. As of December 31, 2014, there were 37 holders of record of COPLP’s common units.
Unregistered Sales of Equity Securities and Use of Proceeds
During the three months ended December 31, 2014, 23,000 of COPLP’s common units were exchanged for 23,000 COPT common shares in accordance with the COPLP’s Second Amended and Restated Limited Partnership Agreement, as amended. The issuance of these common shares was effected in reliance upon the exemption from registration under Section 4(2) of the Securities Act of 1933, as amended.
COPT’s Common Shares Performance Graph
The graph and the table set forth below assume $100 was invested on December 31, 2009 in COPT’s common shares. The graph and the table compare the cumulative return (assuming reinvestment of dividends) of this investment with a $100 investment at that time in the S&P 500 Index or the All Equity REIT Index of the National Association of Real Estate Investment Trusts (“NAREIT”):
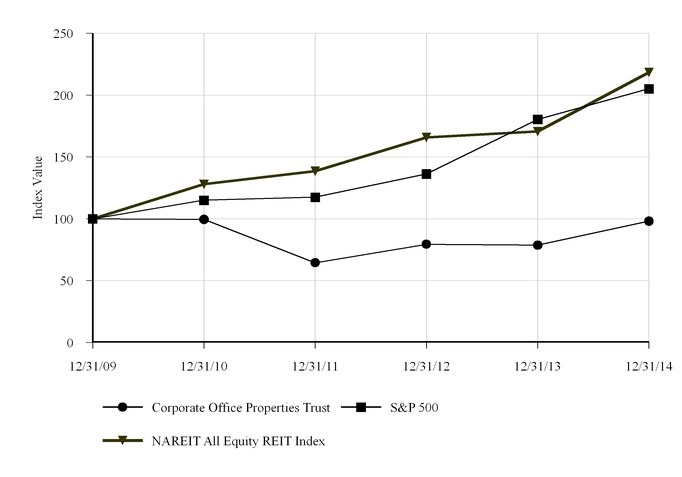
|
| | | | | | | | | | | | | | | | | | | | | | | | |
| | Period Ended |
Index | | 12/31/09 |
| | 12/31/10 |
| | 12/31/11 |
| | 12/31/12 |
| | 12/31/13 |
| | 12/31/14 |
|
Corporate Office Properties Trust | | $ | 100.00 |
| | $ | 99.52 |
| | $ | 64.47 |
| | $ | 79.40 |
| | $ | 78.69 |
| | $ | 98.11 |
|
S&P 500 | | 100.00 |
| | 115.06 |
| | 117.49 |
| | 136.3 |
| | 180.44 |
| | 205.14 |
|
NAREIT All Equity REIT Index | | 100.00 |
| | 127.95 |
| | 138.55 |
| | 165.84 |
| | 170.58 |
| | 218.38 |
|
Item 6. Selected Financial Data
The following tables set forth summary historical consolidated financial data and operating data for COPT and COPLP and their respective subsidiaries as of and for each of the years ended December 31, 2010 through 2014. You should read the following summary historical financial data in conjunction with the consolidated historical financial statements and notes thereto of COPT and its subsidiaries and COPLP and its subsidiaries and the section of this report entitled “Management’s Discussion and Analysis of Financial Condition and Results of Operations” for additional information. |
| | | | | | | | | | | | | | | | | | | |
Corporate Office Properties Trust and Subsidiaries |
(in thousands, except per share data and number of properties) |
| 2014 | | 2013 | | 2012 | | 2011 | | 2010 |
Revenues | | | | | | | | | |
Revenues from real estate operations (1) | $ | 479,725 |
| | $ | 460,997 |
| | $ | 434,299 |
| | $ | 408,611 |
| | $ | 365,253 |
|
Construction contract and other service revenues | 106,748 |
| | 62,363 |
| | 73,836 |
| | 84,345 |
| | 104,675 |
|
Total revenues | 586,473 |
| | 523,360 |
| | 508,135 |
| | 492,956 |
| | 469,928 |
|
Expenses | | | | | | | | | |
Property operating expenses (1) | 179,934 |
| | 167,199 |
| | 159,206 |
| | 154,375 |
| | 138,471 |
|
Depreciation and amortization associated with real estate operations (1) | 136,086 |
| | 113,214 |
| | 107,998 |
| | 107,003 |
| | 91,705 |
|
Construction contract and other service expenses | 100,058 |
| | 58,875 |
| | 70,576 |
| | 81,639 |
| | 102,302 |
|
Impairment losses (1) | 1,416 |
| | 5,857 |
| | 43,678 |
| | 83,213 |
| | — |
|
General, administrative and leasing expenses (1) | 31,794 |
| | 30,869 |
| | 31,900 |
| | 30,306 |
| | 28,485 |
|
Business development expenses and land carry costs | 5,573 |
| | 5,436 |
| | 5,711 |
| | 6,122 |
| | 6,403 |
|
Total operating expenses | 454,861 |
| | 381,450 |
| | 419,069 |
| | 462,658 |
| | 367,366 |
|
Operating income | 131,612 |
| | 141,910 |
| | 89,066 |
| | 30,298 |
| | 102,562 |
|
Interest expense (1) | (92,393 | ) | | (82,010 | ) | | (86,401 | ) | | (90,037 | ) | | (87,551 | ) |
Interest and other income | 4,923 |
| | 3,834 |
| | 7,172 |
| | 5,603 |
| | 9,682 |
|
Loss on early extinguishment of debt | (9,552 | ) | | (27,030 | ) | | (943 | ) | | (1,639 | ) | | — |
|
Loss on interest rate derivatives | — |
| | — |
| | — |
| | (29,805 | ) | | — |
|
Income (loss) from continuing operations before equity in income (loss) of unconsolidated entities and income taxes | 34,590 |
| | 36,704 |
| | 8,894 |
| | (85,580 | ) | | 24,693 |
|
Equity in income (loss) of unconsolidated entities | 229 |
| | 2,110 |
| | (546 | ) | | (331 | ) | | 1,376 |
|
Income tax (expense) benefit | (310 | ) | | (1,978 | ) | | (381 | ) | | 6,710 |
| | (108 | ) |
Income (loss) from continuing operations | 34,509 |
| | 36,836 |
| | 7,967 |
| | (79,201 | ) | | 25,961 |
|
Discontinued operations (1)(2) | 26 |
| | 55,692 |
| | 12,353 |
| | (51,107 | ) | | 16,714 |
|
Income (loss) before gain on sales of real estate | 34,535 |
| | 92,528 |
| | 20,320 |
| | (130,308 | ) | | 42,675 |
|
Gain on sales of real estate, net of income taxes (3) | 10,671 |
| | 9,016 |
| | 21 |
| | 2,732 |
| | 2,829 |
|
Net income (loss) | 45,206 |
| | 101,544 |
| | 20,341 |
| | (127,576 | ) | | 45,504 |
|
Net (income) loss attributable to noncontrolling interests | (4,951 | ) | | (7,837 | ) | | 636 |
| | 8,148 |
| | (2,744 | ) |
Net income (loss) attributable to COPT | 40,255 |
| | 93,707 |
| | 20,977 |
| | (119,428 | ) | | 42,760 |
|
Preferred share dividends | (15,939 | ) | | (19,971 | ) | | (20,844 | ) | | (16,102 | ) | | (16,102 | ) |
Issuance costs associated with redeemed preferred shares (4) | (1,769 | ) | | (2,904 | ) | | (1,827 | ) | | — |
| | — |
|
Net income (loss) attributable to COPT common shareholders | $ | 22,547 |
| | $ | 70,832 |
| | $ | (1,694 | ) | | $ | (135,530 | ) | | $ | 26,658 |
|
Basic earnings per common share (5) | | | | | | | | | |
Income (loss) from continuing operations | $ | 0.25 |
| | $ | 0.21 |
| | $ | (0.19 | ) | | $ | (1.28 | ) | | $ | 0.17 |
|
Net income (loss) | $ | 0.25 |
| | $ | 0.83 |
| | $ | (0.03 | ) | | $ | (1.97 | ) | | $ | 0.43 |
|
Diluted earnings per common share (5) | | | | | | | | | |
Income (loss) from continuing operations | $ | 0.25 |
| | $ | 0.21 |
| | $ | (0.19 | ) | | $ | (1.28 | ) | | $ | 0.17 |
|
Net income (loss) | $ | 0.25 |
| | $ | 0.83 |
| | $ | (0.03 | ) | | $ | (1.97 | ) | | $ | 0.43 |
|
| | | | | | | | | |
Weighted average common shares outstanding – basic | 88,092 |
| | 85,167 |
| | 73,454 |
| | 69,382 |
| | 59,611 |
|
Weighted average common shares outstanding – diluted | 88,263 |
| | 85,224 |
| | 73,454 |
| | 69,382 |
| | 59,944 |
|
|
| | | | | | | | | | | | | | | | | | | |
| 2014 | | 2013 | | 2012 | | 2011 | | 2010 |
Balance Sheet Data (as of year end): | | | | | | | | | |
Total properties, net | $ | 3,296,914 |
| | $ | 3,214,301 |
| | $ | 3,163,044 |
| | $ | 3,352,975 |
| | $ | 3,445,455 |
|
Total assets | $ | 3,670,257 |
| | $ | 3,629,952 |
| | $ | 3,653,759 |
| | $ | 3,863,555 |
| | $ | 3,844,517 |
|
Debt | $ | 1,920,057 |
| | $ | 1,927,703 |
| | $ | 2,019,168 |
| | $ | 2,426,303 |
| | $ | 2,323,681 |
|
Total liabilities | $ | 2,130,956 |
| | $ | 2,114,945 |
| | $ | 2,206,962 |
| | $ | 2,648,748 |
| | $ | 2,521,379 |
|
Redeemable noncontrolling interest | $ | 18,417 |
| | $ | 17,758 |
| | $ | 10,298 |
| | $ | 8,908 |
| | $ | 9,000 |
|
Total equity | $ | 1,520,884 |
| | $ | 1,497,249 |
| | $ | 1,436,499 |
| | $ | 1,205,899 |
| | $ | 1,323,138 |
|
Other Financial Data (for the year ended): | | | | | | | | | |
Cash flows provided by (used in): | | | | | | | | | |
Operating activities | $ | 193,885 |
| | $ | 158,979 |
| | $ | 191,838 |
| | $ | 152,143 |
| | $ | 156,436 |
|
Investing activities | $ | (209,689 | ) | | $ | (119,790 | ) | | $ | 13,744 |
| | $ | (260,387 | ) | | $ | (479,167 | ) |
Financing activities | $ | (32,492 | ) | | $ | 4,590 |
| | $ | (200,547 | ) | | $ | 103,701 |
| | $ | 324,571 |
|
Numerator for diluted EPS | $ | 22,115 |
| | $ | 70,418 |
| | $ | (2,163 | ) | | $ | (136,567 | ) | | $ | 25,587 |
|
Diluted funds from operations (6) | $ | 155,296 |
| | $ | 214,149 |
| | $ | 165,720 |
| | $ | 53,062 |
| | $ | 148,645 |
|
Diluted funds from operations per share (6) | $ | 1.69 |
| | $ | 2.40 |
| | $ | 2.13 |
| | $ | 0.72 |
| | $ | 2.30 |
|
Cash dividends declared per common share | $ | 1.10 |
| | $ | 1.10 |
| | $ | 1.10 |
| | $ | 1.65 |
| | $ | 1.61 |
|
Property Data (as of year end): | | | | | | | | | |
Number of properties owned (7) | 173 |
| | 183 |
| | 208 |
| | 238 |
| | 256 |
|
Total rentable square feet owned (7) | 16,790 |
| | 17,370 |
| | 18,831 |
| | 20,514 |
| | 20,432 |
|
| |
(1) | Certain prior period amounts pertaining to properties included in discontinued operations have been reclassified to conform with the current presentation. These reclassifications did not affect consolidated net income or shareholders’ equity. |
| |
(2) | Includes income derived from three operating properties disposed in 2010, 23 operating properties disposed in 2011, 35 operating properties disposed in 2012 and 31 operating properties disposed in 2013 (see Note 20 to our consolidated financial statements). |
| |
(3) | Reflects gain from sales of properties and unconsolidated real estate joint ventures not associated with discontinued operations. |
| |
(4) | Reflects a decrease to net income available to common shareholders pertaining to the original issuance costs recognized upon the redemption of the Series G Preferred Shares in 2012, Series J Preferred Shares in 2013 and Series H Preferred Shares in 2014. |
| |
(5) | Basic and diluted earnings per common share are calculated based on amounts attributable to common shareholders of COPT. |
| |
(6) | For definitions of diluted funds from operations per share and diluted funds from operations and reconciliations of these measures to their comparable measures under generally accepted accounting principles, you should refer to the section entitled “Funds from Operations” within the section entitled “Management's Discussion and Analysis of Financial Condition and Results of Operations.” |
| |
(7) | Amounts reported reflect only operating office properties. |
|
| | | | | | | | | | | | | | | | | | | |
Corporate Office Properties, L.P. and Subsidiaries |
(in thousands, except per share data and number of properties) |
| 2014 | | 2013 | | 2012 | | 2011 | | 2010 |
Revenues | | | | | | | | | |
Revenues from real estate operations (1) | $ | 479,725 |
| | $ | 460,997 |
| | $ | 434,299 |
| | $ | 408,611 |
| | $ | 365,253 |
|
Construction contract and other service revenues | 106,748 |
| | 62,363 |
| | 73,836 |
| | 84,345 |
| | 104,675 |
|
Total revenues | 586,473 |
| | 523,360 |
| | 508,135 |
| | 492,956 |
| | 469,928 |
|
Expenses | | | | | | | | | |
Property operating expenses (1) | 179,934 |
| | 167,199 |
| | 159,206 |
| | 154,375 |
| | 138,471 |
|
Depreciation and amortization associated with real estate operations (1) | 136,086 |
| | 113,214 |
| | 107,998 |
| | 107,003 |
| | 91,705 |
|
Construction contract and other service expenses | 100,058 |
| | 58,875 |
| | 70,576 |
| | 81,639 |
| | 102,302 |
|
Impairment losses (1) | 1,416 |
| | 5,857 |
| | 43,678 |
| | 83,213 |
| | — |
|
General, administrative and leasing expenses (1) | 31,794 |
| | 30,869 |
| | 31,900 |
| | 30,300 |
| | 28,461 |
|
Business development expenses and land carry costs | 5,573 |
| | 5,436 |
| | 5,711 |
| | 6,122 |
| | 6,403 |
|
Total operating expenses | 454,861 |
| | 381,450 |
| | 419,069 |
| | 462,652 |
| | 367,342 |
|
Operating income | 131,612 |
| | 141,910 |
| | 89,066 |
| | 30,304 |
| | 102,586 |
|
Interest expense (1) | (92,393 | ) | | (82,010 | ) | | (86,401 | ) | | (90,037 | ) | | (87,551 | ) |
Interest and other income | 4,923 |
| | 3,834 |
| | 7,172 |
| | 5,603 |
| | 9,682 |
|
Loss on early extinguishment of debt | (9,552 | ) | | (27,030 | ) | | (943 | ) | | (1,639 | ) | | — |
|
Loss on interest rate derivatives | — |
| | — |
| | — |
| | (29,805 | ) | | — |
|
Income (loss) from continuing operations before equity in income (loss) of unconsolidated entities and income taxes | 34,590 |
| | 36,704 |
| | 8,894 |
| | (85,574 | ) | | 24,717 |
|
Equity in income (loss) of unconsolidated entities | 229 |
| | 2,110 |
| | (546 | ) | | (331 | ) | | 1,376 |
|
Income tax (expense) benefit | (310 | ) | | (1,978 | ) | | (381 | ) | | 6,710 |
| | (108 | ) |
Income (loss) from continuing operations | 34,509 |
| | 36,836 |
| | 7,967 |
| | (79,195 | ) | | 25,985 |
|
Discontinued operations (1)(2) | 26 |
| | 55,692 |
| | 12,353 |
| | (51,107 | ) | | 16,714 |
|
Income (loss) before gain on sales of real estate | 34,535 |
| | 92,528 |
| | 20,320 |
| | (130,302 | ) | | 42,699 |
|
Gain on sales of real estate, net of income taxes (3) | 10,671 |
| | 9,016 |
| | 21 |
| | 2,732 |
| | 2,829 |
|
Net income (loss) | 45,206 |
| | 101,544 |
| | 20,341 |
| | (127,570 | ) | | 45,528 |
|
Net (income) loss attributable to noncontrolling interests | (3,276 | ) | | (3,907 | ) | | 507 |
| | 244 |
| | (61 | ) |
Net income (loss) attributable to COPLP | 41,930 |
| | 97,637 |
| | 20,848 |
| | (127,326 | ) | | 45,467 |
|
Preferred unit distributions | (16,599 | ) | | (20,631 | ) | | (21,504 | ) | | (16,762 | ) | | (16,762 | ) |
Issuance costs associated with redeemed preferred units (4) | (1,769 | ) | | (2,904 | ) | | (1,827 | ) | | — |
| | — |
|
Net income (loss) attributable to COPLP common unitholders | $ | 23,562 |
| | $ | 74,102 |
| | $ | (2,483 | ) | | $ | (144,088 | ) | | $ | 28,705 |
|
Basic earnings per common unit (5) | | | | | | | | | |
Income (loss) from continuing operations | $ | 0.25 |
| | $ | 0.21 |
| | $ | (0.19 | ) | | $ | (1.29 | ) | | $ | 0.18 |
|
Net income (loss) | $ | 0.25 |
| | $ | 0.83 |
| | $ | (0.04 | ) | | $ | (2.00 | ) | | $ | 0.44 |
|
Diluted earnings per common unit (5) | | | | | | | | | |
Income (loss) from continuing operations | $ | 0.25 |
| | $ | 0.21 |
| | $ | (0.19 | ) | | $ | (1.29 | ) | | $ | 0.18 |
|
Net income (loss) | $ | 0.25 |
| | $ | 0.83 |
| | $ | (0.04 | ) | | $ | (2.00 | ) | | $ | 0.44 |
|
| | | | | | | | | |
Weighted average common units outstanding – basic | 91,989 |
| | 89,036 |
| | 77,689 |
| | 72,564 |
| | 62,553 |
|
Weighted average common units outstanding – diluted | 92,160 |
| | 89,093 |
| | 77,689 |
| | 72,564 |
| | 62,886 |
|
|
| | | | | | | | | | | | | | | | | | | |
| 2014 | | 2013 | | 2012 | | 2011 | | 2010 |
Balance Sheet Data (as of year end): | | | | | | | | | |
Total properties, net | $ | 3,296,914 |
| | $ | 3,214,301 |
| | $ | 3,163,044 |
| | $ | 3,352,975 |
| | $ | 3,445,455 |
|
Total assets | $ | 3,664,375 |
| | $ | 3,622,485 |
| | $ | 3,646,983 |
| | $ | 3,855,967 |
| | $ | 3,836,329 |
|
Debt | $ | 1,920,057 |
| | $ | 1,927,703 |
| | $ | 2,019,168 |
| | $ | 2,426,303 |
| | $ | 2,323,681 |
|
Total liabilities | $ | 2,125,074 |
| | $ | 2,107,478 |
| | $ | 2,200,186 |
| | $ | 2,641,160 |
| | $ | 2,512,504 |
|
Redeemable noncontrolling interest | $ | 18,417 |
| | $ | 17,758 |
| | $ | 10,298 |
| | $ | 8,908 |
| | $ | 9,000 |
|
Total equity | $ | 1,520,884 |
| | $ | 1,497,249 |
| | $ | 1,436,499 |
| | $ | 1,205,899 |
| | $ | 1,314,825 |
|
Other Financial Data (for the year ended): | | | | | | | | | |
Cash flows provided by (used in): | | | | | | | | | |
Operating activities | $ | 193,885 |
| | $ | 158,979 |
| | $ | 191,838 |
| | $ | 152,149 |
| | $ | 156,460 |
|
Investing activities | $ | (209,689 | ) | | $ | (119,790 | ) | | $ | 13,744 |
| | $ | (260,387 | ) | | $ | (479,167 | ) |
Financing activities | $ | (32,492 | ) | | $ | 4,590 |
| | $ | (200,547 | ) | | $ | 103,695 |
| | $ | 324,547 |
|
Numerator for diluted EPU | $ | 23,130 |
| | $ | 73,688 |
| | $ | (2,952 | ) | | $ | (145,125 | ) | | $ | 27,634 |
|
Cash distributions declared per common unit | $ | 1.10 |
| | $ | 1.10 |
| | $ | 1.10 |
| | $ | 1.65 |
| | $ | 1.61 |
|
Property Data (as of year end): | | | | | | | | | |
Number of properties owned (6) | 173 |
| | 183 |
| | 208 |
| | 238 |
| | 256 |
|
Total rentable square feet owned (6) | 16,790 |
| | 17,370 |
| | 18,831 |
| | 20,514 |
| | 20,432 |
|
| |
(1) | Certain prior period amounts pertaining to properties included in discontinued operations have been reclassified to conform with the current presentation. These reclassifications did not affect consolidated net income or shareholders’ equity. |
| |
(2) | Includes income derived from three operating properties disposed in 2010, 23 operating properties disposed in 2011, 35 operating properties disposed in 2012 and 31 operating properties disposed in 2013 (see Note 20 to our consolidated financial statements). |
| |
(3) | Reflects gain from sales of properties and unconsolidated real estate joint ventures not associated with discontinued operations. |
| |
(4) | Reflects a decrease to net income available to common shareholders pertaining to the original issuance costs recognized upon the redemption of the Series G Preferred Units in 2012, Series J Preferred Units in 2013 and Series H Preferred Units in 2014. |
| |
(5) | Basic and diluted earnings per common unit are calculated based on amounts attributable to common unitholders of COPLP. |
| |
(6) | Amounts reported reflect only operating office properties. |
Item 7. Management's Discussion and Analysis of Financial Condition and Results of Operations
You should refer to our consolidated financial statements and the notes thereto and our Selected Financial Data table as you read this section.
This section contains “forward-looking” statements, as defined in the Private Securities Litigation Reform Act of 1995, that are based on our current expectations, estimates and projections about future events and financial trends affecting the financial condition and operations of our business. Forward-looking statements can be identified by the use of words such as “may,” “will,” “should,” “could,” “believe,” “anticipate,” “expect,” “estimate,” “plan” or other comparable terminology. Forward-looking statements are inherently subject to risks and uncertainties, many of which we cannot predict with accuracy and some of which we might not even anticipate. Although we believe that the expectations, estimates and projections reflected in such forward-looking statements are based on reasonable assumptions at the time made, we can give no assurance that these expectations, estimates and projections will be achieved. Future events and actual results may differ materially from those discussed in the forward-looking statements. Important factors that may affect these expectations, estimates and projections include, but are not limited to:
| |
• | general economic and business conditions, which will, among other things, affect office property and data center demand and rents, tenant creditworthiness, interest rates, financing availability and property values; |
| |
• | adverse changes in the real estate markets, including, among other things, increased competition with other companies; |
| |
• | governmental actions and initiatives, including risks associated with the impact of a prolonged government shutdown or budgetary reductions or impasses, such as a reduction in rental revenues, non-renewal of leases and/or a curtailment of demand for additional space by our strategic customers; |
| |
• | our ability to borrow on favorable terms; |
| |
• | risks of real estate acquisition and development activities, including, among other things, risks that development projects may not be completed on schedule, that tenants may not take occupancy or pay rent or that development or operating costs may be greater than anticipated; |
| |
• | risks of investing through joint venture structures, including risks that our joint venture partners may not fulfill their financial obligations as investors or may take actions that are inconsistent with our objectives; |
| |
• | changes in our plans for properties or views of market economic conditions or failure to obtain development rights, either of which could result in recognition of significant impairment losses; |
| |
• | our ability to satisfy and operate effectively under Federal income tax rules relating to real estate investment trusts and partnerships; |
| |
• | the dilutive effects of issuing additional common shares; |
| |
• | our ability to achieve projected results; and |
| |
• | environmental requirements. |
We undertake no obligation to update or supplement forward-looking statements.
Overview
Our revenues relating to real estate operations are derived from rents and property operating expense reimbursements earned from tenants leasing space in our properties. Most of our expenses relating to our real estate operations take the form of property operating costs (such as real estate taxes, utilities and repairs and maintenance) and depreciation and amortization associated with our operating properties. Most of our profitability from real estate operations depends on our ability to maintain high levels of occupancy and increase rents, which is affected by a number of factors, including, among other things, our tenants’ ability to fulfill their lease obligations and their continuing space needs based on variables such as employment levels, business confidence, competition, general economic conditions of the markets in which we operate and governmental actions and initiatives.
Our strategy for operations and growth focuses on serving the specialized requirements of United States Government agencies and their contractors, most of whom are engaged in national security and information technology related activities. These tenants’ missions generally pertain more to knowledge-based activities (such as cyber security, research and development and other highly technical security and information technology related areas) than to force structure (troops) and weapon system production. As a result of this strategy, a large concentration of our revenue is derived from several large tenants. As of December 31, 2014, 65.3% of our annualized rental revenue (as defined below) from office properties was from our 20 largest tenants, 46.0% from our five largest tenants and 27.6% from our largest tenant, the United States Government. In addition, most of the total annualized rental revenue of our office properties was from properties located near defense installations and other knowledge-based government demand drivers (referred to elsewhere as “Strategic Demand Drivers”), or that were
otherwise at least 50% leased by United States Government agencies or their contractors; we refer to these properties herein as “Strategic Tenant Properties.”
We began 2014 with a smaller, yet more strategic, portfolio of properties, an improved capital position and an improved outlook for the leasing environment of our Strategic Tenant Properties due to:
| |
• | the completion in 2013 of our Strategic Reallocation Plan, a plan we commenced in 2011 that entailed the disposition of office properties and land no longer closely aligned with our strategy, and the use of the resulting proceeds to invest primarily in Strategic Tenant Properties and repay borrowings. While this plan was in place, we completed dispositions of 89 operating properties totaling 5.5 million square feet and non-operating land for transaction values totaling $687.1 million, including the disposition of our Colorado Springs operating segment. As a result, we started 2014 with a smaller portfolio of properties and a higher concentration of Strategic Tenant Properties relative to when we commenced the plan; |
| |
• | our execution of an initiative from 2011 to 2013 focused on improving our capital position, pursuant to which we repaid existing borrowings using proceeds from property sales under the Strategic Reallocation Plan, public offerings of common and preferred shares and new unsecured, longer term debt borrowings. Due to this initiative, we increased the fixed-rate portion of our debt, the unsecured portion of our debt and our weighted average debt term; and |
| |
• | a return to a more normalized operating environment for our United States Government agency and Government contractor tenants. For an extended number of years, continuing delays in Federal budget approvals and uncertainty regarding the potential for future reductions in government spending targeting defense had disrupted the Government’s process for awarding contracts to prospective tenants, which delayed our ability to lease certain existing properties and new construction proximate to Strategic Demand Drivers. In January 2014, the 2014 Consolidated Appropriations Act was passed, establishing a budget for the 2014 fiscal year that rolled back certain of the defense spending reductions that were to occur under the 2011 Budget Act. With the passage of this Act, defense spending levels were essentially unchanged in 2014 and are expected to remain flat through September 30, 2015. The passage of the budget enabled the Federal Government to resume a more normalized process for awarding contracts by mid-2014. See the discussion below regarding our expectations for periods after September 2015. |
We further improved the strategic focus of our portfolio in 2014 by:
| |
• | placing into service an aggregate of 692,000 square feet in five newly constructed properties that were 94.6% leased as of December 31, 2014; |
| |
• | selling eight operating properties in the Greater Baltimore region totaling 303,000 square feet that were 48.9% occupied for $28.8 million and selling land for $28.3 million. We used most of the proceeds from these sales for general corporate purposes; |
| |
• | choosing in April not to provide support to a wholly owned subsidiary with a $150.0 million nonrecourse mortgage loan secured by two operating properties in Northern Virginia with an aggregate estimated fair value that was less than the loan balance. As a result, the subsidiary defaulted on the loan’s payment terms. The loan had an interest rate of 10.65% (including the effect of default interest of 5.0%) and was originally scheduled to mature in 2017. In connection with the loan’s default proceedings, we expect to transfer title to the properties and be relieved of the debt obligation plus accrued interest in early 2015; and |
| |
• | leasing 3.0 million square feet, including 893,000 of construction and redevelopment space. |
Due in large part to these activities, we:
| |
• | improved occupancy of our office property portfolio to 90.9% as of December 31, 2014, a 1.8% increase over year end 2013, due in large part to our sale, or removal from operations for redevelopment, of low occupancy operating properties and our achievement of strong occupancy on newly constructed or redeveloped space; |
| |
• | increased occupancy of our Same Office Properties (defined below) to 91.3% as of December 31, 2014 (up slightly from 91.0% as of December 31, 2013); |
| |
• | maintained occupancy of our Strategic Tenant Properties at 91.6% as of December 31, 2014, or unchanged from year end 2013; |
| |
• | increased the percentage of our total annualized rental revenue of our office properties derived from Strategic Tenant Properties to 76.6% as of December 31, 2014, an increase of 6.9% from year end 2013; and |
| |
• | commenced construction on six new Strategic Tenant Properties in 2014 that were 57.4% leased as of December 31, 2014. |
As discussed above, the passage of the budget in January enabled the Federal Government to resume a more normalized process for awarding contracts, which improved the leasing outlook for our Strategic Tenant Properties, particularly those proximate to Strategic Demand Drivers. These demand drivers include Fort George G. Meade (which also houses the United States Cyber Command), Redstone Arsenal, Fort Belvoir, San Antonio and Aberdeen Proving Ground. We believe that the
knowledge-based activities of most of our tenants will continue to be a priority in the defense budget as such activities are considered increasingly critical to our national security. Absent passage of further related legislation, budgetary sequestration of funding levels by the United States Government will go into effect on October 1, 2015; if this occurs, our operations may be adversely effected, particularly those of our Strategic Tenant Properties. However, we believe that Federal budget discussions will eventually lead to defense spending levels remaining flat or increasing at the rate of inflation for the next two to three years.
In addition to the effect of the uncertainty in Federal spending discussed above, 2014 also followed an extended period of otherwise challenging economic conditions in the United States and our region that prompted many tenants and prospective tenants to consolidate their operations, close their businesses, downsize their space requirements or cancel or delay expansion plans in our regions, and ultimately placed downward pressure on our occupancy and rental rates. Our properties that are not proximate to Strategic Demand Drivers tend to be more subject to general market conditions. We believe that general market conditions improved in 2014, as traditional office tenants in healthcare, education and professional services industries supported some growth in demand in many of our submarkets in the Baltimore/Washington Corridor. We expect a slow, but continued, recovery to pre-recession occupancy levels for our properties not proximate to Strategic Demand Drivers.
We financed our construction activities while maintaining our capital position in 2014 through:
| |
• | COPLP’s issuance of a $300.0 million aggregate principal amount of 3.700% Senior Notes, which are unsecured and guaranteed by COPT, on May 14, 2014 at an initial offering price of 99.739% of their face value. The proceeds from the offering, after deducting underwriting discounts but before other offering expenses, were approximately $297.3 million. We used the net proceeds of the offering to repay borrowings under our Revolving Credit Facility, repay $50.0 million under an existing term loan facility, fund the redemption of our Series H Preferred Shares and for general corporate purposes; |
| |
• | COPT’s redemption of all of its outstanding Series H Preferred Shares on June 16, 2014 at a price of $25.00 per share, or $50.0 million in the aggregate, plus accrued and unpaid dividends thereon through the date of redemption, using proceeds from the 3.700% Senior Notes issuance. These shares accrued dividends equal to 7.5% of the liquidation preference. In connection with this redemption, COPLP redeemed the Series H Preferred Units previously owned by COPT that carried terms substantially the same as the Series H Preferred Shares. At the time of the redemption, we recognized a $1.8 million decrease to net income available to common shareholders/unitholders pertaining to the original issuance costs of the securities; |
| |
• | COPT’s completion of a public offering of 5.52 million common shares in November at a price of $27.30 per share for net proceeds of $148.9 million, after underwriter discounts but before offering expenses, that were contributed to COPLP in exchange for 5.52 million common units. The net proceeds were used primarily to fund our defeasance of, and full satisfaction of our obligations with respect to, the secured nonrecourse mortgage loans discussed below, as well as costs related to the defeasance and satisfaction; and |
| |
• | the defeasance in December of, and full satisfaction of our obligations with respect to, (i) $103.0 million principal amount of secured nonrecourse mortgage loan due to mature on November 6, 2015 and bearing an interest rate of 5.53% and (ii) $108.5 million principal amount of secured nonrecourse mortgage loan due to mature on January 1, 2016 and bearing an interest rate of 5.56%, as well as costs related to the defeasance and satisfaction. As a result, we recognized an early extinguishment loss of $9.1 million. |
Due in large part to these transactions and the property dispositions completed in 2014, as of December 31, 2014:
| |
• | the fixed-rate portion of our debt was 89% (including the effect of variable rate loans subject to interest rate swaps), virtually unchanged from year end 2013; |
| |
• | our weighted average debt maturity was 5.1 years, virtually unchanged from year end 2013; and |
| |
• | the unsecured portion of our debt increased from 63% to 78%. |
We discuss significant factors contributing to changes in our net income over the last three years in the section below entitled “Results of Operations.” The results of operations discussion is combined for COPT and COPLP because there are no material differences in the results of operations between the two reporting entities.
In addition, the section below entitled “Liquidity and Capital Resources” includes discussions of, among other things:
| |
• | how we expect to generate cash for short and long-term capital needs; |
| |
• | our off-balance sheet arrangements in place that are reasonably likely to affect our financial condition; and |
| |
• | our commitments and contingencies. |
We refer to the measure “annualized rental revenue” in various sections of the Management’s Discussion and Analysis of Financial Condition and Results of Operations section of this Annual Report on Form 10-K. Annualized rental revenue is a measure that we use to evaluate the source of our rental revenue as of a point in time. It is computed by multiplying by 12 the sum of monthly contractual base rents and estimated monthly expense reimbursements under active leases as of a point in time (ignoring free rent then in effect). Our computation of annualized rental revenue excludes the effect of lease incentives, although the effect of this exclusion is generally not material. We consider annualized rental revenue to be a useful measure for analyzing revenue sources because, since it is point-in-time based, it does not contain increases and decreases in revenue associated with periods in which lease terms were not in effect; historical revenue under generally accepted accounting principles in the United States of America (“GAAP”) does contain such fluctuations. We find the measure particularly useful for leasing, tenant, segment and industry analysis.
All of our operating portfolio square footage, occupancy and leasing statistics included below and elsewhere in this Annual Report on Form 10-K exclude the effect of the two properties serving as collateral for debt that was in default due to the expected debt extinguishment via conveyance of such properties (totaling 665,000 square feet that were 36.1% occupied as of December 31, 2014); effective April 1, 2014, all cash flows from such properties belong to the lender.
Critical Accounting Policies and Estimates
Our consolidated financial statements are prepared in accordance with GAAP, which require us to make certain estimates and assumptions. A summary of our significant accounting policies is provided in Note 2 to our consolidated financial statements. The following section is a summary of certain aspects of those accounting policies involving estimates and assumptions that (1) require our most difficult, subjective or complex judgments in accounting for uncertain matters or matters that are susceptible to change and (2) materially affect our reported operating performance or financial condition. It is possible that the use of different reasonable estimates or assumptions in making these judgments could result in materially different amounts being reported in our consolidated financial statements. While reviewing this section, you should refer to Note 2 to our consolidated financial statements, including terms defined therein.
Acquisitions of Properties
When we acquire properties, we allocate the purchase price to numerous tangible and intangible components. Most of the terms in this bullet section are discussed in further detail in Note 2 to the consolidated financial statements entitled “Acquisitions of Properties.” Our process for determining the allocation to these components requires many estimates and assumptions, including the following: (1) determination of market rental rates; (2) estimation of leasing and tenant improvement costs associated with the remaining term of acquired leases; (3) assumptions used in determining the in-place lease value, if-vacant value and tenant relationship value, including the rental rates, period of time that it would take to lease vacant space and estimated tenant improvement and leasing costs; (4) renewal probabilities; and (5) allocation of the if-vacant value between land and building. A change in any of the above key assumptions can materially change not only the presentation of acquired properties in our consolidated financial statements but also our reported results of operations. The allocation to different components affects the following:
| |
• | the amount of the purchase price allocated among different categories of assets and liabilities on our consolidated balance sheets; the amount of costs assigned to individual properties in multiple property acquisitions; and the amount of gain recognized in our consolidated statements of operations should we determine that the fair value of the acquisition exceeds its cost; |
| |
• | where the amortization of the components appear over time in our consolidated statements of operations. Allocations to above- and below-market leases are amortized into rental revenue, whereas allocations to most of the other tangible and intangible assets are amortized into depreciation and amortization expense. As a REIT, this is important to us since much of the investment community evaluates our operating performance using non-GAAP measures such as funds from operations, the computation of which includes rental revenue but does not include depreciation and amortization expense; and |
| |
• | the timing over which the items are recognized as revenue or expense in our consolidated statements of operations. For example, for allocations to the as-if vacant value, the land portion is not depreciated and the building portion is depreciated over a longer period of time than the other components (generally 40 years). Allocations to above- and below-market leases, in-place lease value and tenant relationship value are amortized over significantly shorter timeframes, and if individual tenants' leases are terminated early, any unamortized amounts remaining associated with those tenants are written off upon termination. These differences in timing can materially affect our reported results of operations. In addition, we establish lives for tenant relationship values based on our estimates of how long we expect the respective tenants to remain in the properties. |
Impairment of Long-Lived Assets
We assess each of our operating properties for impairment quarterly using cash flow projections and estimated fair values that we derive for each of the properties. We update the leasing and other assumptions used in these projections regularly, paying particular attention to properties that have experienced chronic vacancy or face significant market challenges. We review our plans and intentions for our development projects and land parcels quarterly. If our analyses indicate that the carrying values of operating properties, properties in development or land held for future development may be impaired, we perform a recovery analysis for such properties. For long-lived assets to be held and used, we analyze recoverability based on the estimated undiscounted future cash flows expected to be generated from the operations and eventual disposition of the assets over, in most cases, a ten-year holding period. If we believe there is a significant possibility that we might dispose of the assets earlier, we analyze recoverability using a probability weighted analysis of the estimated undiscounted future cash flows expected to be generated from the operations and eventual disposition of the assets over the various possible holding periods. If the analysis indicates that the carrying value of a tested property is not recoverable from estimated future cash flows, it is written down to its estimated fair value and an impairment loss is recognized. If and when our plans change, we revise our recoverability analyses to use the cash flows expected from the operations and eventual disposition of each asset using holding periods that are consistent with our revised plans.
Property fair values are determined based on contract prices, indicative bids, discounted cash flow analyses or yield analyses. Estimated cash flows used in such analyses are based on our plans for the property and our views of market and economic conditions. The estimates consider items such as current and future rental rates, occupancies for the tested property and comparable properties, estimated operating and capital expenditures and recent sales data for comparable properties; most of these items are influenced by market data obtained from real estate leasing and brokerage firms and our direct experience with the properties and their markets. Determining the appropriate capitalization or yield rate also requires significant judgment and is typically based on many factors, including the prevailing rate for the market or submarket, as well as the quality and location of the properties. Changes in the estimated future cash flows due to changes in our plans for a property (especially our expected holding period), views of market and economic conditions and/or our ability to obtain development rights could result in recognition of impairment losses which could be substantial.
Properties held for sale are carried at the lower of their carrying values (i.e., cost less accumulated depreciation and any impairment loss recognized, where applicable) or estimated fair values less costs to sell. Accordingly, decisions to sell certain operating properties, properties in development or land held for development will result in impairment losses if carrying values of the specific properties exceed their estimated fair values less costs to sell. The estimates of fair value consider matters such as recent sales data for comparable properties and, where applicable, contracts or the results of negotiations with prospective purchasers. These estimates are subject to revision as market conditions, and our assessment of such conditions, change.
Assessment of Lease Term
As discussed above, a significant portion of our portfolio is leased to the United States Government, and the majority of those leases consist of a series of one-year renewal options, or provide for early termination rights. In addition, certain other leases in our portfolio provide early termination rights to tenants. Applicable accounting guidance requires us to recognize minimum rental payments on a straight-line basis over the terms of each lease and to assess the lease terms as including all periods for which failure to renew, or continue, the lease imposes a penalty on the lessee in such amounts that renewal, or continuation, appears, at the inception of the lease, to be reasonably assured. Factors we consider when determining whether a penalty is significant include the uniqueness of the purpose or location of the property, the availability of a comparable replacement property, the relative importance or significance of the property to the continuation of the lessee's line of business and the existence of leasehold improvements or other assets whose value would be impaired by the lessee vacating or discontinuing use of the leased property. For a number of our leases with the United States Government, we have concluded, based on the factors above, that exercise of existing renewal options, or continuation of such leases without exercising early termination rights, is reasonably assured. Changes in these assessments could result in the write-off of any recorded assets associated with straight-line rental revenue and acceleration of depreciation and amortization expense associated with costs we have incurred related to these leases.
Revenue Recognition on Tenant Improvements
Most of our leases involve some form of improvements to leased space. When we are required to provide improvements under the terms of a lease, we need to determine whether the improvements constitute landlord assets or tenant assets. If the improvements are landlord assets, we capitalize the cost of the improvements and recognize depreciation expense associated with such improvements over the shorter of the useful life of the assets or the term of the lease and recognize any payments from the tenant as rental revenue over the term of the lease. If the improvements are tenant assets, we defer the cost of
improvements funded by us as a lease incentive asset and amortize it as a reduction of rental revenue over the term of the lease. Our determination of whether improvements are landlord assets or tenant assets also may affect when we commence revenue recognition in connection with a lease.
In determining whether improvements constitute landlord or tenant assets, we consider numerous factors that may require subjective or complex judgments, including: whether the improvements are unique to the tenant or reusable by other tenants; whether the tenant is permitted to alter or remove the improvements without our consent or without compensating us for any lost fair value; whether the ownership of the improvements remains with us or remains with the tenant at the end of the lease term; and whether the economic substance of the lease terms is properly reflected.
Collectability of Accounts and Deferred Rent Receivable
Allowances for doubtful accounts and deferred rent receivable are established based on quarterly analyses of the risk of loss on specific accounts. The analyses place particular emphasis on past-due accounts and consider information such as the nature and age of the receivables, the payment history of the tenants, the financial condition of the tenants and our assessment of their ability to meet their lease obligations, the basis for any disputes and the status of related negotiations. Our estimate of the required allowance is subject to revision as these factors change and is sensitive to the effects of economic and market conditions on tenants.
Activities we conduct to monitor the credit quality of our tenants include the following: monitoring the timeliness of tenant lease payments; reviewing credit ratings of tenants that are rated by a nationally recognized credit agency prior to such tenants’ entry into leases, and monitoring periodically thereafter; reviewing financial statements of tenants that are publicly available or that are required to be provided to us pursuant to the terms of such tenants’ leases; and monitoring news reports regarding our tenants.
Accounting Method for Investments
We use three different accounting methods to report our investments in entities: the consolidation method; the equity method; and the cost method (see Note 2 to our consolidated financial statements). We use the consolidation method when we own most of the outstanding voting interests in an entity and can control its operations. We also consolidate certain entities when control of such entities can be achieved through means other than voting rights (“variable interest entities” or “VIEs”) if we are deemed to be the primary beneficiary. Generally, this applies to entities for which either: (1) the equity investors (if any) lack one or more of the essential characteristics of a controlling financial interest; (2) the equity investment at risk is insufficient to finance that entity's activities without additional subordinated financial support; or (3) the equity investors have voting rights that are not proportionate to their economic interests and the activities of the entity involve, or are conducted on behalf of, an investor with a disproportionately small voting interest. We use the equity method of accounting when we own an interest in an entity and can exert significant influence over, but cannot control, the entity's operations.
In making these determinations, we need to make subjective estimates and judgments regarding the entity’s future operating performance, financial condition, future valuation and other variables that may affect the cash flows of the entity. We must consider both our and our partner's ability to participate in the management of the entity’s operations and make decisions that allow the parties to manage their economic risks. We may also need to estimate the probability of different scenarios taking place over time and their effect on the partners’ cash flows. The conclusion reached as a result of this process affects whether or not we use the consolidation method in accounting for our investment or the equity method. Whether or not we consolidate an investment can materially affect our consolidated financial statements.
Accounting for Interest Rate Derivatives
We use interest rate derivatives to hedge the cash flows associated with interest rates on debt, including forecasted borrowings. When we designate a derivative as a cash flow hedge, we defer the effective portion of changes in its fair value to the accumulated other comprehensive income (loss) section of shareholders' equity and recognize the ineffective portion of changes in fair value of derivatives in earnings. If and when a derivative ceases to qualify as a cash flow hedge, we reclassify the associated accumulated other comprehensive income (loss) to net earnings (loss). Our accounting for derivatives requires that we make judgments in determining the nature of the derivatives and their effectiveness as hedges, including ones regarding the likelihood that a forecasted transaction will take place. Therefore, these judgments could materially affect our consolidated financial statements.
Concentration of Operations
Customer Concentration of Property Operations
The table below sets forth the 20 largest tenants in our portfolio of office properties based on percentage of annualized rental revenue:
|
| | | | | | | | | |
| | Percentage of Annualized Rental |
| | Revenue of Office Properties |
| | for 20 Largest Tenants as of December 31, |
Tenant | | 2014 | | 2013 | | 2012 |
United States of America | | 27.6 | % | | 24.8 | % | | 24.2 | % |
Booz Allen Hamilton, Inc. | | 5.4 | % | | 5.8 | % | | 5.5 | % |
Northrop Grumman Corporation (1) | | 5.0 | % | | 6.1 | % | | 6.3 | % |
General Dynamics Corporation (1) | | 4.2 | % | | 4.0 | % | | 3.6 | % |
The Boeing Company (1) | | 3.8 | % | | 2.6 | % | | 1.4 | % |
Computer Sciences Corporation (1) | | 2.4 | % | | 4.4 | % | | 4.8 | % |
CareFirst, Inc. | | 2.2 | % | | 2.0 | % | | 1.9 | % |
The MITRE Corporation | | 2.1 | % | | 2.0 | % | | 1.9 | % |
Wells Fargo & Company (1) | | 1.7 | % | | 1.6 | % | | 1.7 | % |
Vadata Inc. | | 1.3 | % | | N/A |
| | N/A |
|
AT&T Corporation (1) | | 1.3 | % | | 1.3 | % | | 1.2 | % |
L-3 Communications Holdings, Inc. (1) | | 1.2 | % | | 1.3 | % | | 1.4 | % |
Science Applications International Corporation (1) | | 1.0 | % | | 1.0 | % | | 1.0 | % |
Kratos Defense & Security Solution, Inc. (1) | | 1.0 | % | | 0.9 | % | | 1.5 | % |
TASC Inc. | | 0.9 | % | | 0.9 | % | | N/A |
|
Raytheon Company (1) | | 0.9 | % | | 0.9 | % | | 1.1 | % |
ITT Exelis (1) | | 0.9 | % | | 1.2 | % | | 1.7 | % |
KEYW Corporation | | 0.8 | % | | 0.8 | % | | N/A |
|
The Johns Hopkins Institutions (1) | | 0.8 | % | | 0.9 | % | | 0.8 | % |
Unisys Corporation | | 0.8 | % | | 0.8 | % | | 0.8 | % |
The Aerospace Corporation (1) | | N/A |
| | 1.8 | % | | 1.7 | % |
Ciena Corporation | | N/A |
| | N/A |
| | 1.0 | % |
Lockheed Martin Corporation | | N/A |
| | N/A |
| | 0.8 | % |
Subtotal of 20 largest tenants | | 65.3 | % | | 65.1 | % | | 64.5 | % |
All remaining tenants | | 34.7 | % | | 34.9 | % | | 35.5 | % |
Total | | 100.0 | % | | 100.0 | % | | 100.0 | % |
| | | | | | |
(1) Includes affiliated organizations and agencies and predecessor companies. |
The United States Government’s concentration increased each of the last two years in large part due to our significant dispositions of properties in which it was not a tenant and its occupancy of a significant portion of our newly-constructed square feet placed into service.
Our Strategic Tenant Properties accounted for 76.6% of our annualized rental revenue from office properties as of December 31, 2014. We expect to maintain a high concentration of revenue from customers in these properties, as discussed further in the section in Item 1 to this Annual Report on Form 10-K entitled “Business and Growth Strategies.”
Geographic Concentration of Property Operations
The table below sets forth the regional allocation of our annualized rental revenue of office properties as of the end of the last three calendar years: |
| | | | | | | | | | | | | | | | | | |
| | Percentage of Annualized Rental | | Number of |
| | Revenue of Office | | Office Properties |
| | Properties as of December 31, | | as of December 31, |
Region | | 2014 | | 2013 | | 2012 | | 2014 | | 2013 | | 2012 |
Baltimore/Washington Corridor | | 52.3 | % | | 49.5 | % | | 49.2 | % | | 91 |
| | 92 |
| | 101 |
|
Northern Virginia | | 17.5 | % | | 21.3 | % | | 19.1 | % | | 20 |
| | 20 |
| | 19 |
|
San Antonio | | 8.0 | % | | 7.0 | % | | 6.3 | % | | 8 |
| | 8 |
| | 8 |
|
Huntsville | | 2.2 | % | | 1.9 | % | | 0.7 | % | | 5 |
| | 4 |
| | 1 |
|
Washington, DC - Capitol Riverfront | | 2.8 | % | | 2.8 | % | | 3.1 | % | | 2 |
| | 2 |
| | 2 |
|
St. Mary’s and King George Counties | | 3.5 | % | | 3.7 | % | | 3.4 | % | | 18 |
| | 19 |
| | 19 |
|
Greater Baltimore | | 9.0 | % | | 8.9 | % | | 8.8 | % | | 24 |
| | 32 |
| | 32 |
|
Greater Philadelphia | | 2.6 | % | | 2.8 | % | | 2.0 | % | | 3 |
| | 4 |
| | 3 |
|
Colorado Springs | | — | % | | — | % | | 5.4 | % | | — |
| | — |
| | 20 |
|
Other | | 2.1 | % | | 2.1 | % | | 2.0 | % | | 2 |
| | 2 |
| | 3 |
|
| | 100.0 | % | | 100.0 | % | | 100.0 | % | | 173 |
| | 183 |
| | 208 |
|
The most significant changes in our regional allocations set forth above were due to: significant dispositions of properties (particularly in 2013), including our exit from the Colorado Springs region and dispositions of numerous properties in the Greater Baltimore and Baltimore/Washington Corridor regions; and newly-constructed properties placed into service primarily in the Baltimore/Washington Corridor, Northern Virginia and Huntsville regions.
Occupancy and Leasing
Office Properties
The tables below set forth occupancy information pertaining to our portfolio of operating office properties:
|
| | | | | | | | | | | |
| December 31, |
| 2014 | | 2013 | | 2012 |
Occupancy rates at period end | |
| | |
| | |
Total | 90.9 | % | | 89.1 | % | | 87.8 | % |
Baltimore/Washington Corridor | 93.4 | % | | 91.7 | % | | 89.5 | % |
Northern Virginia | 86.8 | % | | 88.6 | % | | 89.2 | % |
San Antonio | 96.6 | % | | 96.6 | % | | 96.4 | % |
Huntsville | 80.8 | % | | 80.7 | % | | 83.2 | % |
Washington, DC - Capitol Riverfront | 74.4 | % | | 76.4 | % | | 89.0 | % |
St. Mary’s and King George Counties | 90.8 | % | | 89.8 | % | | 85.9 | % |
Greater Baltimore | 86.8 | % | | 77.2 | % | | 78.6 | % |
Greater Philadelphia | 96.2 | % | | 93.7 | % | | 100.0 | % |
Colorado Springs | N/A |
| | N/A |
| | 77.6 | % |
Other | 100.0 | % | | 100.0 | % | | 100.0 | % |
Average contractual annual rental rate per square foot at year end (1) | $ | 29.27 |
| | $ | 28.99 |
| | $ | 27.92 |
|
| |
(1) | Includes estimated expense reimbursements. |
|
| | | | | |
| Rentable Square Feet | | Occupied Square Feet |
| (in thousands) |
December 31, 2013 | 17,370 |
| | 15,484 |
|
Square feet vacated upon lease expiration (1) | — |
| | (893 | ) |
Occupancy of previously vacant space in connection with new leases (2) | — |
| | 638 |
|
Square feet constructed or redeveloped | 763 |
| | 796 |
|
Dispositions | (303 | ) | | (148 | ) |
Square feet removed from operations for redevelopment | (371 | ) | | — |
|
Square feet of properties to be conveyed | (665 | ) | | (623 | ) |
Other changes | (4 | ) | | 1 |
|
December 31, 2014 | 16,790 |
| | 15,255 |
|
| |
(1) | Includes lease terminations and space reductions occurring in connection with lease renewals. |
| |
(2) | Excludes occupancy of vacant square feet acquired or developed. |
Please refer to the section above entitled “Overview” for discussion regarding our leasing activity in 2014 and our expectations regarding the future outlook. As the table above reflects, much of the increase in our total occupancy from December 31, 2013 to December 31, 2014 was attributable to our sale, or removal from operations for redevelopment, of low occupancy operating properties and our achievement of occupancy on newly constructed or redeveloped space. Occupancy of our Same Office Properties was 91.3% at December 31, 2014, up slightly from 91.0% at December 31, 2013. With regard to our regional occupancy trends, including changes from December 31, 2013 to December 31, 2014:
| |
• | Baltimore/Washington Corridor: the increase in occupancy was due in large part to occupancy of newly constructed properties placed into service, our removal of 124,000 square feet from operations for redevelopment and our ability to renew 83.5% of the square footage of our scheduled lease expirations for the year; |
| |
• | Northern Virginia: the decrease in occupancy was due in large part to our renewal of only 25.3% of the square footage of our scheduled lease expirations. Certain of our submarkets in this region are experiencing weakening market conditions, including surplus supply for space and decreasing rental rates. While our occupancy in this region was 86.8% as of December 31, 2014, the region also has scheduled lease expirations in 2015 for 471,000 square feet; |
| |
• | Huntsville: our occupancy reflects an unoccupied 62,000 square foot property that was 100% leased as of December 31, 2014. This region, which is located proximate to Redstone Arsenal, was 94.9% leased as of December 31, 2014; |
| |
• | Washington, DC - Capitol Riverfront: our occupancy reflects a tenant vacating 52,000 square feet in late 2013 that we have yet to lease, and there are scheduled lease expirations in 2015 for 56,000 square feet. Our two properties in this region are located proximate to the Washington Naval Yard; |
| |
• | Greater Baltimore: the increase in our occupancy was due primarily to our disposition in 2014 of eight properties that were 48.9% occupied upon disposition. Our occupancy has been adversely affected by 208,000 square feet in two properties we constructed in our North Gate Business Park that were collectively 25.9% occupied as of December 31, 2014; this park is located proximate to Aberdeen Proving Ground; and |
| |
• | Greater Philadelphia: the increase in our occupancy was due primarily to occupancy of newly redeveloped space occurring in 2014. |
In 2014, we completed 3.0 million square feet of leasing, including 893,000 of construction and redevelopment space. Our construction and redevelopment leasing was highlighted by the following: 401,000 square feet leased in two properties to the United States Government in Northern Virginia and San Antonio; 132,000 square feet in two properties in Huntsville to a United States Government contractor; 120,000 square feet in a Northern Virginia single user data center; and 88,000 to another United States Government contractor in the Baltimore/Washington Corridor. As of December 31, 2014, we had 1.2 million square feet under construction that were 69% leased and 344,000 under redevelopment that were 41% leased.
In 2014, we renewed leases on 1.5 million square feet, representing 69.6% of the square footage of our lease expirations (including the effect of early renewals). The annualized rents of these renewals (totaling $30.92 per square foot) decreased on average by approximately 2.2% and the revenue under GAAP (totaling $32.00 per square foot) increased on average by approximately 7.3% relative to the leases previously in place for the space. The renewed leases had a weighted average lease term of approximately 5.0 years and the average estimated tenant improvements and lease costs associated with completing the leasing was approximately $15.36 per square foot.
In 2014, we also completed 614,000 square feet in other leasing, consisting primarily of space previously leased by us to tenants that was subsequently vacated (also referred to as re-tenanted space). The annualized rents of this other leasing totaled
$23.42 per square foot and the revenue under GAAP totaled $23.89 per square foot; these leases had a weighted average lease term of approximately 6.7 years and the average estimated tenant improvements and lease costs associated with completing this leasing was approximately $39.96 per square foot. The annualized rents of re-tenanted space decreased on average by approximately 2.4% and the revenue under GAAP decreased on average by approximately 10.8% relative to the leases previously in place for the space.
Our weighted average lease term for office properties at December 31, 2014 was approximately 4.7 years. The table below sets forth as of December 31, 2014 our scheduled lease expirations of office properties by region in terms of percentage of annualized rental revenue: |
| | | | | | | | | | | | | | | | | | | | | |
| | Expiration of Annualized Rental |
| | Revenue of Office Properties |
| | 2015 | | 2016 | | 2017 | | 2018 | | 2019 | | Thereafter | | Total |
Baltimore/Washington Corridor | | 5.1 | % | | 5.3 | % | | 9.3 | % | | 8.2 | % | | 9.3 | % | | 15.1 | % | | 52.3 | % |
Northern Virginia | | 3.7 | % | | 2.2 | % | | 2.2 | % | | 2.8 | % | | 2.5 | % | | 4.1 | % | | 17.5 | % |
San Antonio | | 0.0 | % | | 0.0 | % | | 0.0 | % | | 0.1 | % | | 0.0 | % | | 7.9 | % | | 8.0 | % |
Huntsville | | 0.0 | % | | 0.0 | % | | 0.0 | % | | 1.2 | % | | 0.4 | % | | 0.6 | % | | 2.2 | % |
Washington, DC - Capitol Riverfront | | 0.6 | % | | 0.4 | % | | 0.0 | % | | 0.7 | % | | 0.1 | % | | 1.0 | % | | 2.8 | % |
St. Mary’s and King George Counties | | 1.7 | % | | 0.5 | % | | 0.1 | % | | 0.1 | % | | 0.2 | % | | 0.9 | % | | 3.5 | % |
Greater Baltimore | | 0.6 | % | | 1.2 | % | | 1.0 | % | | 1.0 | % | | 0.7 | % | | 4.5 | % | | 9.0 | % |
Greater Philadelphia | | 0.0 | % | | 0.0 | % | | 0.0 | % | | 0.0 | % | | 0.1 | % | | 2.5 | % | | 2.6 | % |
Other | | 0.0 | % | | 0.0 | % | | 0.0 | % | | 0.0 | % | | 0.0 | % | | 2.1 | % | | 2.1 | % |
Total | | 11.8 | % | | 9.6 | % | | 12.6 | % | | 14.2 | % | | 13.2 | % | | 38.6 | % | | 100.0 | % |
With regard to leases expiring in 2015, we believe that the weighted average annualized rental revenue per occupied square foot for such leases at December 31, 2014 was, on average, approximately 2% to 4% higher than estimated current market rents for the related space, with specific results varying by market.
All of the leasing statistics set forth above assume no exercise of any early termination rights. In addition, as noted above, most of the leases with our largest tenant, the United States Government, provide for consecutive one-year terms; all of the leasing statistics set forth above assume that the United States Government will remain in the space that they lease through the end of the respective arrangements, without ending consecutive one-year leases prematurely.
Wholesale Data Center Property
Our wholesale data center property, which upon completion is expected to have a critical load of 19.25 megawatts, had 9.0 megawatts in operation at December 31, 2014, of which 6.56 were leased to tenants with further expansion rights of up to a combined 7.63 megawatts. In February 2015, we leased an additional 11.25 megawatts expected to be in operations in stages during 2015.
Results of Operations
We evaluate the operating performance of our properties using NOI from real estate operations, our segment performance measure derived by subtracting property operating expenses from revenues from real estate operations. We view our NOI from real estate operations as comprising the following primary categories of operating properties:
| |
• | office properties owned and 100% operational throughout the two years being compared, excluding properties held for future disposition. We define these as changes from “Same Office Properties.” For further discussion of the concept of “operational,” you should refer to the section of Note 2 of the consolidated financial statements entitled “Properties”; |
| |
• | office properties acquired during the two years being compared; |
| |
• | constructed or redeveloped office properties placed into service that were not 100% operational throughout the two years being compared; |
| |
• | two properties that we expect to convey to a mortgage holder; and |
In addition to owning properties, we provide construction management and other services. The primary manner in which we evaluate the operating performance of our construction management and other service activities is through a measure we define as NOI from service operations, which is based on the net of the revenues and expenses from these activities. The
revenues and expenses from these activities consist primarily of subcontracted costs that are reimbursed to us by customers along with a management fee. The operating margins from these activities are small relative to the revenue. We believe NOI from service operations is a useful measure in assessing both our level of activity and our profitability in conducting such operations.
We believe that operating income, as reported on our consolidated statements of operations, is the most directly comparable GAAP measure for both NOI from real estate operations and NOI from service operations. Since both of these measures exclude certain items includable in operating income, reliance on these measures has limitations; management compensates for these limitations by using the measures simply as supplemental measures that are considered alongside other GAAP and non-GAAP measures.
The table below reconciles NOI from real estate operations and NOI from service operations to operating income reported on the consolidated statements of operations of COPT and subsidiaries:
|
| | | | | | | | | | | | |
| | For the Years Ended December 31, |
| | 2014 | | 2013 | | 2012 |
| (in thousands) |
NOI from real estate operations | | $ | 299,912 |
| | $ | 317,929 |
| | $ | 312,365 |
|
NOI from service operations | | 6,690 |
| | 3,488 |
| | 3,260 |
|
NOI from discontinued operations | | (121 | ) | | (24,131 | ) | | (37,272 | ) |
Depreciation and amortization associated with real estate operations | | (136,086 | ) | | (113,214 | ) | | (107,998 | ) |
Impairment losses | | (1,416 | ) | | (5,857 | ) | | (43,678 | ) |
General, administrative and leasing expenses | | (31,794 | ) | | (30,869 | ) | | (31,900 | ) |
Business development expenses and land carry costs | | (5,573 | ) | | (5,436 | ) | | (5,711 | ) |
Operating income | | $ | 131,612 |
| | $ | 141,910 |
| | $ | 89,066 |
|
Comparison of the Year Ended December 31, 2014 to the Year Ended December 31, 2013 |
| | | | | | | | | | | |
| For the Years Ended December 31, |
| 2014 | | 2013 | | Variance |
| (in thousands) |
Revenues | |
| | |
| | |
|
Revenues from real estate operations | $ | 479,725 |
| | $ | 460,997 |
| | $ | 18,728 |
|
Construction contract and other service revenues | 106,748 |
| | 62,363 |
| | 44,385 |
|
Total revenues | 586,473 |
| | 523,360 |
| | 63,113 |
|
Expenses | |
| | |
| | |
|
Property operating expenses | 179,934 |
| | 167,199 |
| | 12,735 |
|
Depreciation and amortization associated with real estate operations | 136,086 |
| | 113,214 |
| | 22,872 |
|
Construction contract and other service expenses | 100,058 |
| | 58,875 |
| | 41,183 |
|
Impairment losses | 1,416 |
| | 5,857 |
| | (4,441 | ) |
General, administrative and leasing expenses | 31,794 |
| | 30,869 |
| | 925 |
|
Business development expenses and land carry costs | 5,573 |
| | 5,436 |
| | 137 |
|
Total operating expenses | 454,861 |
| | 381,450 |
| | 73,411 |
|
Operating income | 131,612 |
| | 141,910 |
| | (10,298 | ) |
Interest expense | (92,393 | ) | | (82,010 | ) | | (10,383 | ) |
Interest and other income | 4,923 |
| | 3,834 |
| | 1,089 |
|
Loss on early extinguishment of debt | (9,552 | ) | | (27,030 | ) | | 17,478 |
|
Equity in income of unconsolidated entities | 229 |
| | 2,110 |
| | (1,881 | ) |
Income tax expense | (310 | ) | | (1,978 | ) | | 1,668 |
|
Income from continuing operations | 34,509 |
| | 36,836 |
| | (2,327 | ) |
Discontinued operations | 26 |
| | 55,692 |
| | (55,666 | ) |
Gain on sales of real estate, net of income taxes | 10,671 |
| | 9,016 |
| | 1,655 |
|
Net income | $ | 45,206 |
| | $ | 101,544 |
| | $ | (56,338 | ) |
NOI from Real Estate Operations
|
| | | | | | | | | | | | |
| | For the Years Ended December 31, |
| | 2014 | | 2013 | | Variance |
| | (Dollars in thousands, except per square foot data) |
Revenues | | |
| | |
| | |
|
Same Office Properties revenues | | | | | | |
Rental revenue, excluding lease termination revenue | | $ | 338,472 |
| | $ | 336,091 |
| | $ | 2,381 |
|
Lease termination revenue | | 1,365 |
| | 1,925 |
| | (560 | ) |
Tenant recoveries and other real estate operations revenue | | 86,416 |
| | 77,511 |
| | 8,905 |
|
Same Office Properties total revenues | | 426,253 |
| | 415,527 |
| | 10,726 |
|
Constructed office properties placed in service | | 28,677 |
| | 9,890 |
| | 18,787 |
|
Properties to be conveyed | | 11,362 |
| | 20,485 |
| | (9,123 | ) |
Dispositions | | 1,709 |
| | 40,362 |
| | (38,653 | ) |
Other | | 11,710 |
| | 12,369 |
| | (659 | ) |
| | 479,711 |
| | 498,633 |
| | (18,922 | ) |
Property operating expenses | | |
| | |
| | |
|
Same Office Properties | | 156,660 |
| | 147,785 |
| | 8,875 |
|
Constructed office properties placed in service | | 7,725 |
| | 2,543 |
| | 5,182 |
|
Properties to be conveyed | | 5,697 |
| | 7,139 |
| | (1,442 | ) |
Dispositions | | 843 |
| | 15,330 |
| | (14,487 | ) |
Other | | 8,874 |
| | 7,907 |
| | 967 |
|
| | 179,799 |
| | 180,704 |
| | (905 | ) |
NOI from real estate operations | | |
| | |
| | |
|
Same Office Properties | | 269,593 |
| | 267,742 |
| | 1,851 |
|
Constructed office properties placed in service | | 20,952 |
| | 7,347 |
| | 13,605 |
|
Properties to be conveyed | | 5,665 |
| | 13,346 |
| | (7,681 | ) |
Dispositions | | 866 |
| | 25,032 |
| | (24,166 | ) |
Other | | 2,836 |
| | 4,462 |
| | (1,626 | ) |
| | $ | 299,912 |
| | $ | 317,929 |
| | $ | (18,017 | ) |
Same Office Properties rent statistics | | |
| | |
| | |
|
Average occupancy rate | | 91.6 | % | | 90.5 | % | | 1.1 | % |
Average straight-line rent per occupied square foot (1) | | $ | 24.61 |
| | $ | 24.68 |
| | $ | (0.07 | ) |
| |
(1) | Includes minimum base rents, net of abatements, and lease incentives on a straight-line basis for the years set forth above. |
The increases in tenant recoveries and other real estate operations revenue and property operating expenses from our Same Office Properties were primarily due to increases in expenses resulting mostly from higher than normal snowfall and lower than normal temperatures in the Mid-Atlantic region in 2014 and an increase in certain other directly reimbursable expenses.
Our Same Office Properties pool consisted of 160 office properties, comprising 89.4% of our operating office square footage as of December 31, 2014. This pool of properties included the following changes from the pool used for purposes of comparing 2013 and 2012 in our 2013 Annual Report on Form 10-K: the additions of three properties placed in service and 100% operational by January 1, 2013, one property acquired and fully operational by January 1, 2013 and two properties in the Greater Philadelphia region (this region was previously excluded from the pool as it was not considered held for long-term investment); and the removals of eight properties sold in 2014 and three properties newly classified as redevelopment.
Our NOI from constructed office properties placed in service included 13 properties placed in service in 2013 and 2014.
Depreciation and Amortization Expense
The increase in depreciation and amortization expense was attributable primarily to our revision of the useful life of a property that was removed from service for redevelopment.
NOI from Service Operations
|
| | | | | | | | | | | | |
| | For the Years Ended December 31, |
| | 2014 | | 2013 | | Variance |
| | (in thousands) |
Construction contract and other service revenues | | $ | 106,748 |
| | $ | 62,363 |
| | $ | 44,385 |
|
Construction contract and other service expenses | | 100,058 |
| | 58,875 |
| | 41,183 |
|
NOI from service operations | | $ | 6,690 |
| | $ | 3,488 |
| | $ | 3,202 |
|
Construction contract and other service revenue and expenses increased due primarily to a higher volume of construction activity in connection with several of our tenants. Construction contract activity is inherently subject to significant variability depending on the volume and nature of projects undertaken by us (primarily on behalf of tenants). Service operations are an ancillary component of our overall operations that should contribute little operating income relative to our real estate operations.
Impairment Losses
We recognized the impairment losses described below in 2014 and 2013:
| |
• | $1.4 million in 2014 primarily on three properties that were sold in the Greater Baltimore region; |
| |
• | in connection primarily with the Strategic Reallocation Plan, we determined that the carrying amounts of certain properties identified for disposition would not likely be recovered from the cash flows from the operations and sales of such properties over the shorter holding periods. Accordingly, we recognized aggregate impairment losses for the amounts by which the carrying values of those properties exceeded their respective estimated fair values, plus any exit costs incurred, of $15.2 million in 2013 (all classified as discontinued operations and including $419,000 in exit costs). Most of these losses were attributable to properties in Colorado Springs; |
| |
• | $11.0 million (all classified as discontinued operations and including $560,000 in exit costs) in 2013 on properties that were conveyed to lenders; and |
| |
• | $5.9 million in 2013 on two properties in the Greater Baltimore region that Management concluded no longer met our strategic investment criteria. After shortening our expected holding period for these properties during the period, we determined that the carrying amount of the properties would not likely be recovered from the cash flows from the operations and sales of the properties over the shortened period. |
General, Administrative and Leasing Expenses
We capitalize compensation and indirect costs associated with properties, or portions thereof, undergoing construction, development and redevelopment activities, and also capitalize such costs associated with internal-use software development. We also capitalize compensation costs associated with obtaining new tenant leases or extending existing tenants. Capitalized compensation and indirect costs were as follows:
|
| | | | | | | | |
| | For the Years Ended December 31, |
| | 2014 | | 2013 |
| | (in thousands) |
Construction, development, redevelopment, capital and tenant improvements | | $ | 7,893 |
| | $ | 8,189 |
|
Leasing | | 1,461 |
| | 1,408 |
|
Total | | $ | 9,354 |
| | $ | 9,597 |
|
Interest Expense
The table below sets forth the components of our interest expense included in continuing operations: |
| | | | | | | | | | | | |
| | For the Years Ended December 31, |
| | 2014 | | 2013 | | Variance |
| | (in thousands) |
Interest on mortgage and other secured loans | | | | | | |
Interest, excluding default rate on debt to be extinguished | | $ | 37,857 |
| | $ | 55,105 |
| | $ | (17,248 | ) |
Interest under default rate on debt to be extinguished via conveyance | | 5,806 |
| | — |
| | 5,806 |
|
Interest on Unsecured Senior Notes | | 33,302 |
| | 12,294 |
| | 21,008 |
|
Interest on unsecured term loans | | 10,282 |
| | 13,633 |
| | (3,351 | ) |
Amortization of deferred financing costs | | 4,666 |
| | 5,451 |
| | (785 | ) |
Interest expense recognized on interest rate swaps | | 2,990 |
| | 2,741 |
| | 249 |
|
Interest on Revolving Credit Facility | | 232 |
| | 968 |
| | (736 | ) |
Interest on Exchangeable Senior Notes | | 34 |
| | 5,824 |
| | (5,790 | ) |
Other interest | | 3,289 |
| | 3,000 |
| | 289 |
|
Capitalized interest | | (6,065 | ) | | (8,785 | ) | | 2,720 |
|
Total interest expense, net of capitalized interest | | 92,393 |
| | 90,231 |
| | 2,162 |
|
Interest expense reclassified to discontinued operations | | — |
| | (8,221 | ) | | 8,221 |
|
Interest expense included in continuing operations | | $ | 92,393 |
| | $ | 82,010 |
| | $ | 10,383 |
|
Aside from the incremental additional interest expense associated with the default rate on debt to be extinguished via property conveyance, most of the changes in interest expense reflected above are the result of our emphasis on improving our capital position primarily through the repayment of existing borrowings using proceeds from the property sales, public offerings of equity and new unsecured borrowings. Interest expense for Unsecured Senior Notes increased due to our initial note issuances in May and September 2013 and an additional issuance in May 2014. Interest expense for Exchangeable Senior Notes decreased due to our repayment of almost all of these notes during 2013. Capitalized interest decreased due primarily to our completion of significant construction and development projects that were not immediately offset by new projects.
Loss on Early Extinguishment of Debt
The loss on early extinguishment of debt in 2014 was attributable primarily to a $9.1 million loss recognized in connection with the defeasance of, and full satisfaction of our obligations with respect to, two secured nonrecourse mortgage loans with a $211.5 million aggregate principal amount. The loss on early extinguishment of debt in 2013 was attributable primarily to a $25.9 million loss recognized on our repayment of a $239.4 million principal amount of our 4.25% Exchangeable Senior Notes.
Discontinued Operations
The decrease in discontinued operations was due to a $67.8 million gain on early extinguishment of debt recognized on our conveyance of properties to the lender of a non recourse loan to extinguish the loan in December 2013.
Gain on Sales of Real Estate, Net
In 2014, we recognized gain on sales of real estate of $5.6 million in connection with the disposition of a non-operating property and $5.1 million in connection with dispositions of operating properties in the Greater Baltimore region. For 2013, our gain on sales of real estate, net (excluding amounts in discontinued operations) included a $6.3 million gain on the substantive disposition of our investment in an unconsolidated real estate joint venture and a $2.7 million gain from our disposition of land parcels in the Greater Baltimore region.
Comparison of the Year Ended December 31, 2013 to the Year Ended December 31, 2012
|
| | | | | | | | | | | |
| For the Years Ended December 31, |
| 2013 | | 2012 | | Variance |
| (in thousands) |
Revenues | |
| | |
| | |
|
Revenues from real estate operations | $ | 460,997 |
| | $ | 434,299 |
| | $ | 26,698 |
|
Construction contract and other service revenues | 62,363 |
| | 73,836 |
| | (11,473 | ) |
Total revenues | 523,360 |
| | 508,135 |
| | 15,225 |
|
Expenses | |
| | |
| | |
|
Property operating expenses | 167,199 |
| | 159,206 |
| | 7,993 |
|
Depreciation and amortization associated with real estate operations | 113,214 |
| | 107,998 |
| | 5,216 |
|
Construction contract and other service expenses | 58,875 |
| | 70,576 |
| | (11,701 | ) |
Impairment losses | 5,857 |
| | 43,678 |
| | (37,821 | ) |
General, administrative and leasing expense | 30,869 |
| | 31,900 |
| | (1,031 | ) |
Business development expenses and land carry costs | 5,436 |
| | 5,711 |
| | (275 | ) |
Total operating expenses | 381,450 |
| | 419,069 |
| | (37,619 | ) |
Operating income | 141,910 |
| | 89,066 |
| | 52,844 |
|
Interest expense | (82,010 | ) | | (86,401 | ) | | 4,391 |
|
Interest and other income | 3,834 |
| | 7,172 |
| | (3,338 | ) |
Loss on early extinguishment of debt | (27,030 | ) | | (943 | ) | | (26,087 | ) |
Equity in income (loss) of unconsolidated entities | 2,110 |
| | (546 | ) | | 2,656 |
|
Income tax expense | (1,978 | ) | | (381 | ) | | (1,597 | ) |
Income from continuing operations | 36,836 |
| | 7,967 |
| | 28,869 |
|
Discontinued operations | 55,692 |
| | 12,353 |
| | 43,339 |
|
Gain on sales of real estate, net of income taxes | 9,016 |
| | 21 |
| | 8,995 |
|
Net income | $ | 101,544 |
| | $ | 20,341 |
| | $ | 81,203 |
|
NOI from Real Estate Operations |
| | | | | | | | | | | |
| For the Years Ended December 31, |
| 2013 | | 2012 | | Variance |
| (Dollars in thousands, except per square foot data) |
Revenues | |
| | |
| | |
|
Same Office Properties revenues | | | | | |
Rental revenue, excluding lease termination revenue | $ | 321,742 |
| | $ | 315,244 |
| | $ | 6,498 |
|
Lease termination revenue | 1,925 |
| | 1,573 |
| | 352 |
|
Tenant recoveries and other real estate operations revenue | 77,160 |
| | 76,025 |
| | 1,135 |
|
Same Office Properties total revenues | 400,827 |
| | 392,842 |
| | 7,985 |
|
Constructed office properties placed in service | 18,409 |
| | 5,146 |
| | 13,263 |
|
Acquired office properties | 6,180 |
| | 2,708 |
| | 3,472 |
|
Properties to be conveyed | 20,485 |
| | 17,635 |
| | 2,850 |
|
Dispositions | 40,362 |
| | 62,360 |
| | (21,998 | ) |
Other | 12,370 |
| | 12,409 |
| | (39 | ) |
| 498,633 |
| | 493,100 |
| | 5,533 |
|
Property operating expenses | |
| | |
| | |
|
Same Office Properties | 143,141 |
| | 139,692 |
| | 3,449 |
|
Constructed office properties placed in service | 5,369 |
| | 1,248 |
| | 4,121 |
|
Acquired office properties | 1,812 |
| | 764 |
| | 1,048 |
|
Properties to be conveyed | 7,139 |
| | 7,587 |
| | (448 | ) |
Dispositions | 15,330 |
| | 24,868 |
| | (9,538 | ) |
Other | 7,913 |
| | 6,576 |
| | 1,337 |
|
| 180,704 |
| | 180,735 |
| | (31 | ) |
NOI from real estate operations | |
| | |
| | |
|
Same Office Properties | 257,686 |
| | 253,150 |
| | 4,536 |
|
Constructed office properties placed in service | 13,040 |
| | 3,898 |
| | 9,142 |
|
Acquired office properties | 4,368 |
| | 1,944 |
| | 2,424 |
|
Properties to be conveyed | 13,346 |
| | 10,048 |
| | 3,298 |
|
Dispositions | 25,032 |
| | 37,492 |
| | (12,460 | ) |
Other | 4,457 |
| | 5,833 |
| | (1,376 | ) |
| $ | 317,929 |
| | $ | 312,365 |
| | $ | 5,564 |
|
Same Office Properties rent statistics | |
| | |
| | |
|
Average occupancy rate | 91.6 | % | | 89.8 | % | | 1.8 | % |
Average straight-line rent per occupied square foot (1) | $ | 24.42 |
| | $ | 24.34 |
| | $ | 0.08 |
|
| |
(1) | Includes minimum base rents, net of abatements, and lease incentives on a straight-line basis for the years set forth above. |
The increase in revenues from properties to be conveyed was attributable primarily to $2.3 million in connection with lease terminations.
The increase in property operating expenses from our Same Office Properties was primarily due to increases in expenses reimbursable from tenants attributable mostly to a $1.4 million increase in snow removal and increases on certain properties resulting from increased occupancy at such properties.
Our Same Office Properties pool for purposes of comparing 2013 and 2012 consisted of 155 office properties, comprising 82.7% of our operating office square footage as of December 31, 2013. This pool of properties changed from the pool used for purposes of comparing 2013 and 2012 in our 2013 Annual Report on Form 10-K due to the removal of eight properties disposed in 2014 and three properties newly classified as redevelopment in 2014; and the addition of one property in the Greater Philadelphia region (this region was previously excluded from the pool as it was not considered held for long-term investment).
Our NOI from constructed office properties placed in service included 13 properties placed in service in 2012 and 2013.
NOI from Service Operations
|
| | | | | | | | | | | | | |
| | For the Years Ended December 31, | |
| | 2013 | | 2012 | | Variance | |
| | (in thousands) | |
Construction contract and other service revenues | | $ | 62,363 |
| | $ | 73,836 |
| | $ | (11,473 | ) | |
Construction contract and other service expenses | | 58,875 |
| | 70,576 |
| | (11,701 | ) | |
NOI from service operations | | $ | 3,488 |
| | $ | 3,260 |
| | $ | 228 |
| |
Construction contract and other service revenue and expenses decreased due primarily to a lower volume of construction activity in connection with one large construction contract.
Depreciation and Amortization Associated with Real Estate Operations
Depreciation and amortization expense associated with continuing real estate operations increased due primarily to additional expense associated with newly constructed properties placed in service.
Impairment Losses
We recognized the impairment losses described below in 2013 and 2012:
| |
• | as described above, we recognized aggregate impairment losses in connection primarily with the Strategic Reallocation Plan of $15.2 million in 2013 (all classified as discontinued operations and including $419,000 in exit costs) and $19.0 million in 2012 ($23.2 million classified as discontinued operations and including $4.2 million in exit costs). Most of these losses were attributable to properties in Colorado Springs; |
| |
• | $11.0 million (all classified as discontinued operations and including $560,000 in exit costs) in 2013 on properties that were conveyed to lenders; |
| |
• | as described above, $5.9 million in 2013 on two properties in the Greater Baltimore region that Management concluded no longer met our strategic investment criteria; |
| |
• | in September 2012, our Board of Trustees approved a plan by Management to shorten the holding period for all of our office properties and developable land in Greater Philadelphia because the properties no longer met our strategic investment criteria. We determined that the carrying amounts of these properties would not likely be recovered from the cash flows from the operations and sales of such properties over the likely remaining holding period. Accordingly, in 2012, we recognized aggregate non-cash impairment losses of $46.1 million for the amounts by which the carrying values of the properties exceeded their respective estimated fair values; and |
| |
• | in connection with construction costs incurred on a property held for future development, we recognized an impairment loss of $1.9 million in 2012. |
General, Administrative and Leasing Expenses
The decrease in general and administrative expenses was attributable in large part to expenses incurred in 2012 in connection with our executive transition that year and staffing reductions made to adjust the size of the organization due in large part to our property dispositions.
Capitalized compensation and indirect costs were as follows:
|
| | | | | | | | |
| | For the Years Ended December 31, |
| | 2013 | | 2012 |
| | (in thousands) |
Construction, development, redevelopment, capital and tenant improvements | | $ | 8,189 |
| | $ | 7,976 |
|
Leasing | | 1,408 |
| | 1,151 |
|
Total | | $ | 9,597 |
| | $ | 9,127 |
|
Interest Expense
The table below sets forth the components of our interest expense included in continuing operations: |
| | | | | | | | | | | | |
| | For the Years Ended December 31, |
| | 2013 | | 2012 | | Variance |
| | (in thousands) |
Interest on mortgage and other secured loans | | $ | 55,105 |
| | $ | 63,124 |
| | $ | (8,019 | ) |
Interest on unsecured term loans | | 13,633 |
| | 14,728 |
| | (1,095 | ) |
Interest on Unsecured Senior Notes | | 12,294 |
| | — |
| | 12,294 |
|
Interest on Exchangeable Senior Notes | | 5,824 |
| | 13,851 |
| | (8,027 | ) |
Amortization of deferred financing costs | | 5,451 |
| | 6,243 |
| | (792 | ) |
Other interest | | 3,000 |
| | 2,784 |
| | 216 |
|
Interest expense recognized on interest rate swaps | | 2,741 |
| | 3,697 |
| | (956 | ) |
Interest on Revolving Credit Facility | | 968 |
| | 6,274 |
| | (5,306 | ) |
Capitalized interest | | (8,785 | ) | | (13,903 | ) | | 5,118 |
|
Total interest expense, net of capitalized interest | | 90,231 |
| | 96,798 |
| | (6,567 | ) |
Interest expense reclassified to discontinued operations | | (8,221 | ) | | (10,397 | ) | | 2,176 |
|
Interest expense included in continuing operations | | $ | 82,010 |
| | $ | 86,401 |
| | $ | (4,391 | ) |
The decrease in interest expense included the effect of a $185.6 million decrease in our average outstanding debt from 2012 to 2013 resulting primarily from our repayments of debt using proceeds from property dispositions and equity issuances. Interest expense for Unsecured Senior Notes increased due to our initial note issuances in 2013. Interest expense for Exchangeable Senior Notes decreased due to our repayment of almost all of these notes during 2013. Interest expense for our Revolving Credit Facility decreased due to our having maintained a substantially lower balance on the facility in 2013 as we used proceeds from much of our capital activity and property dispositions to pay down borrowings. Capitalized interest decreased due primarily to our completion of significant construction and development projects that were not immediately offset by new projects.
Interest and Other Income
Interest and other income decreased due primarily to a $2.6 million gain that we recognized in 2012 on our disposition of an investment accounted for using the cost method of accounting.
Loss on Early Extinguishment of Debt
The loss on early extinguishment of debt in 2013 was attributable primarily to a $25.9 million loss recognized on our repayment of a $239.4 million principal amount of our 4.25% Exchangeable Senior Notes.
Discontinued Operations
The increase in discontinued operations was due to a $67.8 million gain on early extinguishment of debt recognized on our conveyance of properties to the lender of a non recourse loan to extinguish the loan in December 2013, the effect of which was partially offset by an $18.3 million decrease in gain on sales of properties included in discontinued operations.
Gain on Sales of Real Estate, Net
For 2013, our gain on sales of real estate, net (excluding amounts in discontinued operations) included a $6.3 million gain on the substantive disposition of our investment in an unconsolidated real estate joint venture and a $2.7 million gain from our disposition of land parcels in Greater Baltimore.
Adjusted EBITDA Interest Coverage Ratio and Adjusted EBITDA Fixed Charge Coverage Ratio
Adjusted earnings before interest, taxes, depreciation and amortization (“Adjusted EBITDA”) is net income adjusted for the effects of interest expense, depreciation and amortization, impairment losses, gain on sales of properties, gain or loss on early extinguishment of debt, net gain on unconsolidated entities, operating property acquisition costs, loss on interest rate derivatives, income taxes and executive transition costs, and excluding the effect of properties serving as collateral for debt which is in default that we expect to extinguish via conveyance of such properties. The adjustment for the effect of properties
serving as collateral for debt which is in default that we expect to extinguish via conveyance of such properties pertains to the periods subsequent to our default on the loan’s payment terms, which was the result of our decision to not support payments on the loan since the estimated fair value of the properties was less than the loan balance. While we continued as the legal owner of the properties during this period, all cash flows produced by them went directly to the lender and we did not fund any debt service shortfalls. We believe that Adjusted EBITDA is a useful supplemental measure for assessing our un-levered performance. We believe that net income, as reported on our consolidated statements of operations, is the most directly comparable GAAP measure to Adjusted EBITDA. Adjusted EBITDA excludes items that are included in net income, including some that require cash outlays; we compensate for this limitation by using the measure simply as a supplemental measure that is considered alongside other GAAP and non-GAAP measures. It should not be used as an alternative to net income when evaluating our financial performance or to cash flow from operating, investing and financing activities when evaluating our liquidity or ability to make cash distributions or pay debt service. In 2014, we changed our methodology for reporting Adjusted EBITDA to include an adjustment to exclude the effect of executive transition costs; Adjusted EBITDA for prior periods has been revised to conform with the change in methodology.
We use Adjusted EBITDA to calculate Adjusted EBITDA Interest Coverage Ratio and Adjusted EBITDA Fixed Charge Coverage Ratio. We calculate Adjusted EBITDA interest coverage by dividing Adjusted EBITDA by interest expense on continuing and discontinued operations (excluding amortization of deferred financing costs and amortization of debt discounts and premiums, net of amounts capitalized, and interest expense on debt in default to be extinguished via conveyance of properties). We calculate Adjusted EBITDA fixed charge coverage ratio by dividing Adjusted EBITDA by the sum of: (1) interest expense on continuing and discontinued operations (excluding amortization of deferred financing costs and amortization of debt discounts and premiums, net of amounts capitalized, and interest expense on debt in default to be extinguished via conveyance of properties); (2) scheduled principal amortization on mortgage loans; (3) capitalized interest; (4) dividends on preferred shares; and (5) distributions on preferred units in the Operating Partnership not owned by COPT. In 2014, we changed our methodology for reporting Adjusted EBITDA fixed charge coverage ratio to include scheduled principal amortization on mortgage loans and capitalized interest in the denominator for the ratio; the Adjusted EBITDA fixed charge coverage ratio for prior periods has been revised to conform with the change in methodology.
The tables below set forth the computation of Adjusted EBITDA interest and fixed charge coverage ratios of COPT and subsidiaries and reconciliations of Adjusted EBITDA to net income reported on the COPT’s consolidated statements of operations:
|
| | | | | | | | | | | | |
| | For the Years Ended December 31, |
| | 2014 | | 2013 | | 2012 |
| | (Dollars in thousands) |
Net income | | $ | 45,206 |
| | $ | 101,544 |
| | $ | 20,341 |
|
Interest expense (1) | | 92,393 |
| | 90,231 |
| | 96,798 |
|
Income tax expense (2) | | 310 |
| | 1,978 |
| | 381 |
|
Depreciation and amortization (1) | | 138,490 |
| | 119,773 |
| | 124,418 |
|
Impairment losses (1) | | 1,419 |
| | 32,047 |
| | 66,910 |
|
Loss (gain) on early extinguishment of debt (1) | | 9,668 |
| | (40,780 | ) | | (793 | ) |
Gain on sales of operating properties | | (5,117 | ) | | (9,004 | ) | | (20,928 | ) |
Gain on sales of non-operating properties | | (5,578 | ) | | (2,683 | ) | | (33 | ) |
Net loss (gain) on investments in unconsolidated entities included in interest and other income | | 291 |
| | 206 |
| | (3,589 | ) |
Operating property acquisition costs | | — |
| | — |
| | 229 |
|
EBITDA from properties to be conveyed to extinguish debt in default | | (2,091 | ) | | — |
| | — |
|
Executive transition costs | | 1,056 |
| | — |
| | 2,157 |
|
Adjusted EBITDA | | $ | 276,047 |
| | $ | 293,312 |
| | $ | 285,891 |
|
| | | | | | |
Interest expense (1) | | $ | 92,393 |
| | $ | 90,231 |
| | $ | 96,798 |
|
Less: Amortization of deferred financing costs | | (4,666 | ) | | (5,451 | ) | | (6,243 | ) |
Less: Amortization of net debt discounts and premiums, net of amounts capitalized | | (920 | ) | | (1,015 | ) | | (2,721 | ) |
Less: Interest exp. on debt in default to be exting. via conveyance of properties | | (12,684 | ) | | — |
| | — |
|
Denominator for Adjusted EBITDA interest coverage ratio | | $ | 74,123 |
| | $ | 83,765 |
| | $ | 87,834 |
|
Scheduled principal amortization | | 6,517 |
| | 9,481 |
| | 11,684 |
|
Capitalized interest | | 6,065 |
| | 8,785 |
| | 13,903 |
|
Preferred share dividends | | 15,939 |
| | 19,971 |
| | 20,844 |
|
Preferred unit distributions | | 660 |
| | 660 |
| | 660 |
|
Denominator for Adjusted EBITDA fixed charge coverage ratio | | $ | 103,304 |
| | $ | 122,662 |
| | $ | 134,925 |
|
| | | | | | |
Adjusted EBITDA interest coverage ratio | | 3.7x |
| | 3.5x |
| | 3.3x |
|
Adjusted EBITDA fixed charge coverage ratio | | 2.7x |
| | 2.4x |
| | 2.1x |
|
| | | | | | |
(1) Includes amounts included in continuing operations and discontinued operations. | | |
(2) Includes income taxes on continuing operations and gains on sales of real estate. | | | | | | |
Funds from Operations
Funds from operations (“FFO”) is defined as net income (loss) computed using GAAP, excluding gains on sales of, and impairment losses on, previously depreciated operating properties, plus real estate-related depreciation and amortization. When multiple properties consisting of both operating and non-operating properties exist on a single tax parcel, we classify all of the gains on sales of, and impairment losses on, the tax parcel as all being for previously depreciated operating properties when most of the value of the parcel is associated with operating properties on the parcel. We believe that we use the National Association of Real Estate Investment Trusts (“NAREIT”) definition of FFO, although others may interpret the definition differently and, accordingly, our presentation of FFO may differ from those of other REITs. We believe that FFO is useful to management and investors as a supplemental measure of operating performance because, by excluding gains related to sales of, and impairment losses on, previously depreciated operating properties, net of related tax benefit, and excluding real estate-related depreciation and amortization, FFO can help one compare our operating performance between periods. In addition, since most equity REITs provide FFO information to the investment community, we believe that FFO is useful to investors as a supplemental measure for comparing our results to those of other equity REITs. We believe that net income is the most directly comparable GAAP measure to FFO.
Since FFO excludes certain items includable in net income, reliance on the measure has limitations; management compensates for these limitations by using the measure simply as a supplemental measure that is weighed in the balance with other GAAP and non-GAAP measures. FFO is not necessarily an indication of our cash flow available to fund cash needs. Additionally, it should not be used as an alternative to net income when evaluating our financial performance or to cash flow from operating, investing and financing activities when evaluating our liquidity or ability to make cash distributions or pay debt service.
Basic FFO available to common share and common unit holders (“Basic FFO”) is FFO adjusted to subtract (1) preferred share dividends, (2) issuance costs associated with redeemed preferred shares, (3) income attributable to noncontrolling interests through ownership of preferred units in the Operating Partnership or interests in other consolidated entities not owned by us, (4) depreciation and amortization allocable to noncontrolling interests in other consolidated entities and (5) Basic FFO allocable to restricted shares. With these adjustments, Basic FFO represents FFO available to common shareholders and common unitholders. Common units in the Operating Partnership are substantially similar to our common shares and are exchangeable into common shares, subject to certain conditions. We believe that Basic FFO is useful to investors due to the close correlation of common units to common shares. We believe that net income is the most directly comparable GAAP measure to Basic FFO. Basic FFO has essentially the same limitations as FFO; management compensates for these limitations in essentially the same manner as described above for FFO.
Diluted FFO available to common share and common unit holders (“Diluted FFO”) is Basic FFO adjusted to add back any changes in Basic FFO that would result from the assumed conversion of securities that are convertible or exchangeable into common shares. We believe that Diluted FFO is useful to investors because it is the numerator used to compute Diluted FFO per share, discussed below. We believe that the numerator for diluted EPS is the most directly comparable GAAP measure to Diluted FFO. Since Diluted FFO excludes certain items includable in the numerator to diluted EPS, reliance on the measure has limitations; management compensates for these limitations by using the measure simply as a supplemental measure that is weighed in the balance with other GAAP and non-GAAP measures. Diluted FFO is not necessarily an indication of our cash flow available to fund cash needs. Additionally, it should not be used as an alternative to net income when evaluating our financial performance or to cash flow from operating, investing and financing activities when evaluating our liquidity or ability to make cash distributions or pay debt service.
Diluted FFO, as adjusted for comparability is defined as Diluted FFO adjusted to exclude: operating property acquisition costs; gains on sales of, and impairment losses on, properties other than previously depreciated operating properties, net of associated income tax; gain or loss on early extinguishment of debt; FFO associated with properties securing non-recourse debt on which we have defaulted and which we have extinguished, or expect to extinguish, via conveyance of those properties, including property NOI and interest expense (discussed further below); loss on interest rate derivatives; executive transition costs; and issuance costs associated with redeemed preferred shares. We believe that the excluded items are not reflective of normal operations and, as a result, we believe that a measure that excludes these items is a useful supplemental measure in evaluating our operating performance. The adjustment for FFO associated with properties securing non-recourse debt on which we have defaulted pertains to the periods subsequent to our default on the loan’s payment terms, which was the result of our decision to not support payments on the loan since the estimated fair value of the properties was less than the loan balance. While we continued as the legal owner of the properties during this period, all cash flows produced by them went directly to the lender and we did not fund any debt service shortfalls, which included incremental additional interest under the default rate of $5.8 million in 2014. We believe that the numerator to diluted EPS is the most directly comparable GAAP measure to this non-GAAP measure. This measure has essentially the same limitations as Diluted FFO, as well as the further limitation of not
reflecting the effects of the excluded items; we compensate for these limitations in essentially the same manner as described above for Diluted FFO. In 2014, we changed our methodology for reporting Diluted FFO, as adjusted for comparability to include an adjustment to exclude the effect of executive transition costs; Diluted FFO, as adjusted for comparability for prior periods has been revised to conform with the change in methodology.
Diluted FFO per share is (1) Diluted FFO divided by (2) the sum of the (a) weighted average common shares outstanding during a period, (b) weighted average common units outstanding during a period and (c) weighted average number of potential additional common shares that would have been outstanding during a period if other securities that are convertible or exchangeable into common shares were converted or exchanged. We believe that Diluted FFO per share is useful to investors because it provides investors with a further context for evaluating our FFO results in the same manner that investors use earnings per share (“EPS”) in evaluating net income available to common shareholders. In addition, since most equity REITs provide Diluted FFO per share information to the investment community, we believe that Diluted FFO per share is a useful supplemental measure for comparing us to other equity REITs. We believe that diluted EPS is the most directly comparable GAAP measure to Diluted FFO per share. Diluted FFO per share has most of the same limitations as Diluted FFO (described above); management compensates for these limitations in essentially the same manner as described above for Diluted FFO.
Diluted FFO per share, as adjusted for comparability is (1) Diluted FFO, as adjusted for comparability divided by (2) the sum of the (a) weighted average common shares outstanding during a period, (b) weighted average common units outstanding during a period and (c) weighted average number of potential additional common shares that would have been outstanding during a period if other securities that are convertible or exchangeable into common shares were converted or exchanged. We believe that this measure is useful to investors because it provides investors with a further context for evaluating our FFO results. We believe that diluted EPS is the most directly comparable GAAP measure to this per share measure. This measure has most of the same limitations as Diluted FFO (described above) as well as the further limitation of not reflecting the effects of the excluded items; we compensate for these limitations in essentially the same manner as described above for Diluted FFO. In 2014, we changed our methodology for reporting Diluted FFO per share, as adjusted for comparability to include an adjustment to exclude the effect of executive transition costs; Diluted FFO per share, as adjusted for comparability for prior periods has been revised to conform with the change in methodology.
The computations for all of the above measures on a diluted basis assume the conversion of common units in COPLP but do not assume the conversion of other securities that are convertible into common shares if the conversion of those securities would increase per share measures in a given period.
We use measures called payout ratios as supplemental measures of our ability to make distributions to investors based on each of the following: FFO; Diluted FFO; and Diluted FFO, adjusted for comparability. These measures are defined as (1) the sum of (a) dividends on common shares and (b) distributions to holders of interests in COPLP and dividends on convertible preferred shares when such distributions and dividends are included in Diluted FFO divided by either (2) FFO, Diluted FFO or Diluted FFO, adjusted for comparability.
The tables appearing below and on the following page sets forth the computation of the above stated measures for the years ended December 31, 2010 through 2014 and provides reconciliations to the GAAP measures of COPT and subsidiaries associated with such measures:
|
| | | | | | | | | | | | | | | | | | | |
| For the Year Ended December 31, |
| 2014 | | 2013 | | 2012 | | 2011 | | 2010 |
| (Dollars and shares in thousands, except per share data) |
Net income (loss) | $ | 45,206 |
| | $ | 101,544 |
| | $ | 20,341 |
| | $ | (127,576 | ) | | $ | 45,504 |
|
Add: Real estate-related depreciation and amortization | 136,086 |
| | 117,719 |
| | 121,937 |
| | 134,131 |
| | 123,243 |
|
Add: Depreciation and amortization on unconsolidated real estate entities allocable to COPT | — |
| | — |
| | 346 |
| | 492 |
| | 631 |
|
Add: Impairment losses on previously depreciated operating properties | 1,370 |
| | 32,047 |
| | 70,263 |
| | 70,512 |
| | — |
|
Less: Gain on sales of previously depreciated operating properties, net of income taxes | (5,117 | ) | | (9,004 | ) | | (20,928 | ) | | (4,811 | ) | | (1,077 | ) |
FFO | 177,545 |
| | 242,306 |
| | 191,959 |
| | 72,748 |
| | 168,301 |
|
Less: Noncontrolling interests-preferred units in the Operating Partnership | (660 | ) | | (660 | ) | | (660 | ) | | (660 | ) | | (660 | ) |
Less: FFO allocable to other noncontrolling interests | (3,216 | ) | | (3,710 | ) | | (1,989 | ) | | (1,887 | ) | | (1,370 | ) |
Less: Preferred share dividends | (15,939 | ) | | (19,971 | ) | | (20,844 | ) | | (16,102 | ) | | (16,102 | ) |
Less: Issuance costs associated with redeemed preferred shares | (1,769 | ) | | (2,904 | ) | | (1,827 | ) | | — |
| | — |
|
Basic and Diluted FFO allocable to restricted shares | (665 | ) | | (912 | ) | | (919 | ) | | (1,037 | ) | | (1,524 | ) |
Basic and Diluted FFO | $ | 155,296 |
| | $ | 214,149 |
| | $ | 165,720 |
| | $ | 53,062 |
| | $ | 148,645 |
|
Operating property acquisition costs | — |
| | — |
| | 229 |
| | 156 |
| | 3,424 |
|
Gain on sales of non-operating properties, net of income taxes | (5,578 | ) | | (2,683 | ) | | (33 | ) | | (2,717 | ) | | (2,829 | ) |
Impairment (recoveries) losses on other properties | 49 |
| | — |
| | (3,353 | ) | | 80,509 |
| | — |
|
Income tax expense (benefit) on impairments on other properties | — |
| | — |
| | 673 |
| | (4,775 | ) | | — |
|
Valuation allowance on tax asset associated with FFO comparability adjustments | — |
| | 1,855 |
| | — |
| | — |
| | — |
|
Loss on interest rate derivatives | — |
| | — |
| | — |
| | 29,805 |
| | — |
|
Loss (gain) on early extinguishment of debt | 9,668 |
| | (40,780 | ) | | (793 | ) | | 2,023 |
| | — |
|
Issuance costs associated with redeemed preferred shares | 1,769 |
| | 2,904 |
| | 1,827 |
| | — |
| | — |
|
Executive transition costs | 1,056 |
| | — |
| | 2,157 |
| | — |
| | — |
|
Add: Negative FFO of properties to be conveyed to extinguish debt in default | 10,928 |
| | — |
| | — |
| | — |
| | — |
|
Diluted FFO comparability adjustments allocable to restricted shares | (78 | ) | | 168 |
| | — |
| | — |
| | — |
|
Diluted FFO, as adjusted for comparability | $ | 173,110 |
| | $ | 175,613 |
| | $ | 166,427 |
| | $ | 158,063 |
| | $ | 149,240 |
|
| | | | | | | | | |
Weighted average common shares | 88,092 |
| | 85,167 |
| | 73,454 |
| | 69,382 |
| | 59,611 |
|
Conversion of weighted average common units | 3,897 |
| | 3,869 |
| | 4,235 |
| | 4,355 |
| | 4,608 |
|
Weighted average common shares/units - Basic FFO | 91,989 |
| | 89,036 |
| | 77,689 |
| | 73,737 |
| | 64,219 |
|
Dilutive effect of share-based compensation awards | 171 |
| | 57 |
| | 53 |
| | 111 |
| | 333 |
|
Weighted average common shares/units - Diluted FFO | 92,160 |
| | 89,093 |
| | 77,742 |
| | 73,848 |
| | 64,552 |
|
| | | | | | | | | |
Diluted FFO per share | $ | 1.69 |
| | $ | 2.40 |
| | $ | 2.13 |
| | $ | 0.72 |
| | $ | 2.30 |
|
Diluted FFO per share, as adjusted for comparability | $ | 1.88 |
| | $ | 1.97 |
| | $ | 2.14 |
| | $ | 2.14 |
| | $ | 2.31 |
|
| | | | | | | | | |
|
| | | | | | | | | | | | | | | | | | | |
| For the Year Ended December 31, |
| 2014 | | 2013 | | 2012 | | 2011 | | 2010 |
| (Dollars and shares in thousands, except per share data) |
Numerator for diluted EPS | $ | 22,115 |
| | $ | 70,418 |
| | $ | (2,163 | ) | | $ | (136,567 | ) | | $ | 25,587 |
|
Add: Income allocable to noncontrolling interests-common units in the Operating Partnership | 1,006 |
| | 3,283 |
| | (87 | ) | | (8,439 | ) | | 2,116 |
|
Add: Real estate-related depreciation and amortization | 136,086 |
| | 117,719 |
| | 121,937 |
| | 134,131 |
| | 123,243 |
|
Add: Depreciation and amortization of unconsolidated real estate entities | — |
| | — |
| | 346 |
| | 492 |
| | 631 |
|
Add: Impairment losses on previously depreciated operating properties | 1,370 |
| | 32,047 |
| | 70,263 |
| | 70,512 |
| | — |
|
Add: Numerator for diluted EPS allocable to restricted shares | 432 |
| | 414 |
| | 469 |
| | 1,037 |
| | 1,071 |
|
Less: Depreciation and amortization allocable to noncontrolling interests in other consolidated entities | (725 | ) | | (927 | ) | | (633 | ) | | (849 | ) | | (1,402 | ) |
Less: Decrease in noncontrolling interests unrelated to earnings | 794 |
| | 1,111 |
| | (2,565 | ) | | (1,407 | ) | | — |
|
Less: Basic and diluted FFO allocable to restricted shares | (665 | ) | | (912 | ) | | (919 | ) | | (1,037 | ) | | (1,524 | ) |
Less: Gain on sales of previously depreciated operating properties, net of income taxes | (5,117 | ) | | (9,004 | ) | | (20,928 | ) | | (4,811 | ) | | (1,077 | ) |
Basic and Diluted FFO | $ | 155,296 |
| | $ | 214,149 |
| | $ | 165,720 |
| | $ | 53,062 |
| | $ | 148,645 |
|
Operating property acquisition costs | — |
| | — |
| | 229 |
| | 156 |
| | 3,424 |
|
Gain on sales of non-operating properties, net of income taxes | (5,578 | ) | | (2,683 | ) | | (33 | ) | | (2,717 | ) | | (2,829 | ) |
Impairment (recoveries) losses on other properties | 49 |
| | — |
| | (3,353 | ) | | 80,509 |
| | — |
|
Income tax expense (benefit) on impairments on other properties | — |
| | — |
| | 673 |
| | (4,775 | ) | | — |
|
Valuation allowance on tax asset associated with FFO comparability adjustments | — |
| | 1,855 |
| | — |
| | — |
| | — |
|
Loss on interest rate derivatives | — |
| | — |
| | — |
| | 29,805 |
| | — |
|
Loss (gain) on early extinguishment of debt | 9,668 |
| | (40,780 | ) | | (793 | ) | | 2,023 |
| | — |
|
Issuance costs associated with redeemed preferred shares | 1,769 |
| | 2,904 |
| | 1,827 |
| | — |
| | — |
|
Executive transition costs | 1,056 |
| | — |
| | 2,157 |
| | — |
| | — |
|
Add: Negative FFO of properties to be conveyed to extinguish debt in default | 10,928 |
| | — |
| | — |
| | — |
| | — |
|
Diluted FFO comparability adjustments allocable to restricted shares | (78 | ) | | 168 |
| | — |
| | — |
| | — |
|
Diluted FFO, as adjusted for comparability | $ | 173,110 |
| | $ | 175,613 |
| | $ | 166,427 |
| | $ | 158,063 |
| | $ | 149,240 |
|
| | | | | | | | | |
Denominator for diluted EPS | 88,263 |
| | 85,224 |
| | 73,454 |
| | 69,382 |
| | 59,944 |
|
Weighted average common units | 3,897 |
| | 3,869 |
| | 4,235 |
| | 4,355 |
| | 4,608 |
|
Anti-dilutive EPS effect of share-based compensation awards | — |
| | — |
| | 53 |
| | 111 |
| | — |
|
Denominator for diluted FFO per share measures | 92,160 |
| | 89,093 |
| | 77,742 |
| | 73,848 |
| | 64,552 |
|
| | | | | | | | | |
Dividends on common shares | $ | 97,944 |
| | $ | 95,246 |
| | $ | 81,720 |
| | $ | 116,717 |
| | $ | 98,510 |
|
Common unit distributions | 4,270 |
| | 4,280 |
| | 4,617 |
| | 7,173 |
| | 7,266 |
|
Numerator for diluted FFO payout ratio, adjusted for comparability | $ | 102,214 |
| | $ | 99,526 |
| | $ | 86,337 |
| | $ | 123,890 |
| | $ | 105,776 |
|
FFO payout ratio | 57.6 | % | | 41.1 | % | | 45.0 | % | | 170.3 | % | | 62.8 | % |
Diluted FFO payout ratio | 65.8 | % | | 46.5 | % | | 52.1 | % | | 233.5 | % | | 71.2 | % |
Diluted FFO payout ratio, as adjusted for comparability | 59.0 | % | | 56.7 | % | | 51.9 | % | | 78.4 | % | | 70.9 | % |
Property Additions
The table below sets forth the major components of our additions to properties for 2014 and 2013:
|
| | | | | | | | | | | |
| For the Years Ended December 31, |
| 2014 | | 2013 | | Variance |
| (in thousands) |
Construction, development and redevelopment | $ | 206,583 |
| | $ | 207,753 |
| | $ | (1,170 | ) |
Tenant improvements on operating properties (1) | 25,674 |
| | 19,031 |
| | 6,643 |
|
Capital improvements on operating properties | 22,611 |
| | 22,855 |
| | (244 | ) |
| $ | 254,868 |
| | $ | 249,639 |
| | $ | 5,229 |
|
(1) Tenant improvement costs incurred on newly-constructed properties are classified in this table as construction, development and redevelopment.
Cash Flows
Net cash flow provided by operating activities increased $34.9 million from 2013 to 2014 due primarily to $39.0 million in previously accreted interest and early extinguishment of debt costs paid in 2013 mostly in connection with the repayment of our 4.25% Exchangeable Senior Notes.
Net cash flow provided by investing activities decreased $89.9 million from 2013 to 2014 due primarily to higher proceeds from sales of properties in 2013.
Net cash flow used in financing activities in 2014 was $32.5 million and included the following:
| |
• | net proceeds from the issuance of common shares (or units) of $150.2 million; offset in part by |
| |
• | net repayments of borrowings of $9.3 million; |
| |
• | redemption of preferred shares (or units) of $50.0 million; and |
| |
• | dividends and/or distributions to shareholders and/or unitholders of $118.1 million. |
Net cash flow provided by financing activities in 2013 was $4.6 million and included the following:
| |
• | net proceeds from the issuance of common shares (or units) of $157.4 million; and |
| |
• | net proceeds from borrowings of $64.9 million; offset in part by |
| |
• | redemption of preferred shares (or units) of $84.8 million; and |
dividends and/or distributions to shareholders and/or unitholders of $119.8 million.
Liquidity and Capital Resources of COPT
COPLP is the entity through which COPT, the sole general partner of COPLP, conducts almost all of its operations and owns almost all of its assets. COPT issues public equity from time to time, but does not otherwise generate any capital itself or conduct any business itself, other than incurring certain expenses in operating as a public company which are fully reimbursed by COPLP. COPT itself does not hold any indebtedness, and its only material asset is its ownership of partnership interests of COPLP. COPT’s principal funding requirement is the payment of dividends on its common and preferred shares. COPT’s principal source of funding for its dividend payments is distributions it receives from COPLP.
As of December 31, 2014, COPT owned 96.0% of the outstanding common units and 95.5% of the outstanding preferred units in COPLP; the remaining common and preferred units in COPLP were owned by third parties, which included certain members of COPT’s Board of Trustees. As the sole general partner of COPLP, COPT has the full, exclusive and complete responsibility for COPLP’s day-to-day management and control.
The liquidity of COPT is dependent on COPLP’s ability to make sufficient distributions to COPT. The primary cash requirement of COPT is its payment of dividends to its shareholders. COPT also guarantees some of the Operating Partnership’s debt, as discussed further in Note 11 of the notes to consolidated financial statements included elsewhere herein. If the Operating Partnership fails to fulfill certain of its debt requirements, which trigger COPT’s guarantee obligations, then COPT will be required to fulfill its cash payment commitments under such guarantees. However, COPT’s only significant asset is its investment in COPLP.
As discussed further below, we believe the Operating Partnership’s sources of working capital, specifically its cash flow from operations, and borrowings available under its unsecured line of credit, are adequate for it to make its distribution payments to COPT and, in turn, for COPT to make its dividend payments to its shareholders.
COPT’s short-term liquidity requirements consist primarily of funds to pay for future dividends expected to be paid to its shareholders. COPT periodically accesses the public equity markets to raise capital by issuing common and/or preferred shares.
For COPT to maintain its qualification as a REIT, it must pay dividends to its shareholders aggregating annually at least 90% of its ordinary taxable income. As a result of this distribution requirement, it cannot rely on retained earnings to fund its ongoing operations to the same extent that some other companies can. COPT may need to continue to raise capital in the equity markets to fund COPLP’s working capital needs, acquisitions and developments.
Liquidity and Capital Resources of COPLP
Our primary cash requirements are for operating expenses, debt service, development of new properties, improvements to existing properties and acquisitions. We expect to continue to use cash flow provided by operations as the primary source to meet our short-term capital needs, including property operating expenses, general and administrative expenses, interest expense, scheduled principal amortization of debt, distributions to our security holders and improvements to existing properties. As of December 31, 2014, we had $6.1 million in cash and cash equivalents.
Our senior unsecured debt is currently rated investment grade by the three major rating agencies. We aim to maintain an investment grade rating to enable us to use debt comprised of unsecured, primarily fixed-rate debt (including the effect of interest rate swaps) from public markets and banks. We also use secured nonrecourse debt from institutional lenders and banks, when appropriate. In addition, we periodically access the public equity markets to raise capital by issuing common and/or preferred shares.
We use our Revolving Credit Facility to initially finance much of our investing activities. We subsequently pay down the facility using proceeds from long-term borrowings, equity issuances and property sales. The lenders’ aggregate commitment under the facility is $800.0 million, with the ability for us to increase the lenders’ aggregate commitment to $1.3 billion, provided that there is no default under the facility and subject to the approval of the lenders. Amounts available under the facility are computed based on 60% of our unencumbered asset value, as defined in the loan agreement. The Revolving Credit Facility matures in July 2017, and may be extended by one year at our option, provided that there is no default under the facility and we pay an extension fee of 0.15% of the total availability of the facility. As of December 31, 2014, the maximum borrowing capacity under this facility totaled $800.0 million, of which $702.2 million was available.
We believe that our liquidity and capital resources are adequate for our near-term and longer-term requirements without necessitating property sales. We expect to complete dispositions opportunistically, depending on the circumstances pertaining to properties, or groups of properties, or when capital markets otherwise warrant.
The following table summarizes our contractual obligations as of December 31, 2014 (in thousands):
|
| | | | | | | | | | | | | | | | | | | | | | | | | | | |
| For the Years Ending December 31, | | |
| 2015 | | 2016 | | 2017 | | 2018 | | 2019 | | Thereafter | | Total |
Contractual obligations (1) | |
| | |
| | |
| | |
| | |
| | |
| | |
|
Debt (2) | |
| | |
| | |
| | |
| | |
| | |
| | |
|
Balloon payments due upon maturity | $ | 336,751 |
| | $ | 166,062 |
| | $ | 337,110 |
| | $ | — |
| | $ | 120,000 |
| | $ | 943,562 |
| | $ | 1,903,485 |
|
Scheduled principal payments | 6,794 |
| | 5,337 |
| | 2,137 |
| | 2,036 |
| | 2,094 |
| | 7,927 |
| | 26,325 |
|
Interest on debt (3) | 66,706 |
| | 56,805 |
| | 43,342 |
| | 41,874 |
| | 40,635 |
| | 120,284 |
| | 369,646 |
|
New construction and redevelopment obligations (4)(5) | 62,984 |
| | 417 |
| | — |
| | — |
| | — |
| | — |
| | 63,401 |
|
Third-party construction and development obligations (5)(6) | 57,904 |
| | 35,308 |
| | — |
| | — |
| | — |
| | — |
| | 93,212 |
|
Capital expenditures for operating properties (5)(7) | 28,020 |
| | 12,000 |
| | — |
| | — |
| | — |
| | — |
| | 40,020 |
|
Operating leases (8) | 905 |
| | 839 |
| | 768 |
| | 735 |
| | 728 |
| | 76,678 |
| | 80,653 |
|
Other purchase obligations | 1,757 |
| | 1,230 |
| | 487 |
| | 201 |
| | 192 |
| | 65 |
| | 3,932 |
|
Total contractual cash obligations | $ | 561,821 |
| | $ | 277,998 |
| | $ | 383,844 |
| | $ | 44,846 |
| | $ | 163,649 |
| | $ | 1,148,516 |
| | $ | 2,580,674 |
|
| |
(1) | The contractual obligations set forth in this table exclude property operations contracts that may be terminated with notice of one month or less. |
| |
(2) | Represents scheduled principal amortization payments and maturities only and therefore excludes a net discount of $9.8 million. As of December 31, 2014, maturities in 2015 include $150.0 million pertaining to a nonrecourse mortgage loan secured by two operating properties the title for which we expect to transfer to extinguish our debt obligation. Maturities also include $150.0 million in 2015 that may be extended for two one-year periods and $333.0 million in 2017 that may be extended for one year, subject to certain conditions. |
| |
(3) | Represents interest costs for our outstanding debt as of December 31, 2014 for the terms of such debt. For variable rate debt, the amounts reflected above used December 31, 2014 interest rates on variable rate debt in computing interest costs for the terms of such debt. |
| |
(4) | Represents contractual obligations pertaining to new construction and redevelopment activities. |
| |
(5) | Due to the long-term nature of certain construction and development contracts and leases included in these lines, the amounts reported in the table represent our estimate of the timing for the related obligations being payable. |
| |
(6) | Represents contractual obligations pertaining to projects for which we are acting as construction manager on behalf of unrelated parties who are our clients. We expect to be reimbursed in full for these costs by our clients. |
| |
(7) | Represents contractual obligations pertaining to recurring and nonrecurring capital expenditures for our operating properties. We expect to finance these costs primarily using cash flow from operations. |
| |
(8) | We expect to pay these items using cash flow from operations. |
We expect to spend more than $250.0 million on construction and development costs and approximately $70.0 million on improvements to operating properties (including the commitments set forth in the table above) in 2015. We expect to fund the construction and development costs using cash on hand and borrowings under our Revolving Credit Facility. We expect to fund improvements to existing operating properties using cash flow from operations.
Certain of our debt instruments require that we comply with a number of restrictive financial covenants, including maximum leverage ratio, unencumbered leverage ratio, minimum net worth, minimum fixed charge coverage, minimum unencumbered interest coverage ratio, minimum debt service and maximum secured indebtedness ratio. As of December 31, 2014, we were in compliance with these financial covenants.
Off-Balance Sheet Arrangements
We had no material off-balance sheet arrangements during 2014.
Inflation
Most of our tenants are obligated to pay their share of a building’s operating expenses to the extent such expenses exceed amounts established in their leases, which are based on historical expense levels. Some of our tenants are obligated to pay their full share of a building’s operating expenses. These arrangements somewhat reduce our exposure to increases in such costs resulting from inflation.
Recent Accounting Pronouncements
We adopted guidance issued by the Financial Accounting Standards Board (“FASB”) related to the reporting of discontinued operations and disclosures of disposals of components of an entity effective for the quarterly period ended June 30, 2014. This guidance defines a discontinued operation as a component or group of components disposed or classified as held for sale and represents a strategic shift that has (or will have) a major effect on an entity’s operations and financial results; the guidance states that a strategic shift could include a disposal of a major geographical area of operations, a major line of business, a major equity method investment or other major parts of an entity. The guidance also provides for additional disclosure requirements in connection with both discontinued operations and other dispositions not qualifying as discontinued operations. The guidance applies prospectively to new disposals and new classifications of disposal groups as held for sale after the effective date. Our adoption of the guidance will result in fewer disposed or held for sale properties being reported as discontinued operations in our results of operations (including operating properties sold during the current period) but will not otherwise materially affect our consolidated financial statements.
In May 2014, the FASB issued guidance regarding the recognition of revenue from contracts with customers. Under this guidance, an entity will recognize revenue to depict the transfer of goods or services to customers in an amount that reflects the consideration to which the entity expects to be entitled in exchange for those goods or services. Additionally, this guidance requires improved disclosures regarding the nature, amount, timing and uncertainty of revenue and cash flows arising from contracts with customers. We are required to adopt this guidance for our annual and interim periods beginning January 1, 2017, utilizing one of two methods: retrospective restatement for each reporting period presented at time of adoption, or retrospectively with the cumulative effect of initially applying this guidance recognized at the date of initial application. We are currently assessing the financial impact of this guidance on our consolidated financial statements.
Item 7A. Quantitative and Qualitative Disclosures about Market Risk
We are exposed to certain market risks, one of the most predominant of which is a change in interest rates. Increases in interest rates can result in increased interest expense under our Revolving Credit Facility and other variable rate debt. Increases in interest rates can also result in increased interest expense when our fixed rate debt matures and needs to be refinanced.
The following table sets forth as of December 31, 2014 our debt obligations and weighted average interest rates for fixed rate debt by expected maturity date (dollars in thousands):
|
| | | | | | | | | | | | | | | | | | | | | | | | | | | |
| For the Years Ending December 31, | | |
| 2015 | | 2016 | | 2017 | | 2018 | | 2019 | | Thereafter | | Total |
Debt: | |
| | |
| | |
| | |
| | |
| | |
| | |
|
Fixed rate debt (1) | $ | 156,668 |
| | $ | 171,399 |
| | $ | 6,247 |
| | $ | 2,036 |
| | $ | 2,094 |
| | $ | 951,489 |
| | $ | 1,289,933 |
|
Weighted average interest rate (2) | 10.46 | % | | 7.19 | % | | 5.18 | % | | 4.61 | % | | 4.60 | % | | 4.10 | % | | 5.29 | % |
Variable rate debt (3) | $ | 186,877 |
| | $ | — |
| | $ | 333,000 |
| | $ | — |
| | $ | 120,000 |
| | $ | — |
| | $ | 639,877 |
|
Weighted average interest rate (4) | 1.81 | % | | — | % | | 1.61 | % | | — | % | | 2.26 | % | | — | % | | 1.79 | % |
| |
(1) | Represents principal maturities only and therefore excludes net discounts of $9.8 million. As of December 31, 2014, maturities in 2015 include $150.0 million pertaining to a nonrecourse mortgage loan secured by two operating properties the title for which we expect to transfer to extinguish our debt obligation in connection with loan default proceedings. |
| |
(2) | Excluding the incremental additional interest rate associated with the default rate on the mortgage loan discussed above, the rate would be 5.67% for the fixed rate debt maturing in 2015 and 4.71% for the total fixed rate debt. |
| |
(3) | As of December 31, 2014, maturities include $150.0 million in 2015 that may be extended for two one-year periods and $333.0 million in 2017 that may be extended for one year, subject to certain conditions. |
| |
(4) | The amounts reflected above used December 31, 2014 interest rates on variable rate debt. |
The fair value of our debt was $1.9 billion as of December 31, 2014 and December 31, 2013. If interest rates had been 1% lower, the fair value of our fixed-rate debt would have increased by approximately $86 million as of December 31, 2014 and $81 million as of December 31, 2013.
The following table sets forth information pertaining to interest rate swap contracts in place as of December 31, 2014 and 2013 and their respective fair values (dollars in thousands):
|
| | | | | | | | | | | | | | | | | | | |
Notional | | Fixed | | Floating Rate | | Effective | | Expiration | | Fair Value at December 31, |
Amount | | Rate | | Index | | Date | | Date | | 2014 | | 2013 |
$ | 100,000 |
| | 0.8320 | % | | One-Month LIBOR | | 1/3/2012 | | 9/1/2015 | | $ | (407 | ) | | $ | (861 | ) |
100,000 |
| | 0.8320 | % | | One-Month LIBOR | | 1/3/2012 | | 9/1/2015 | | (407 | ) | | (861 | ) |
36,877 |
| (1) | 3.8300 | % | | One-Month LIBOR + 2.25% | | 11/2/2010 | | 11/2/2015 | | (400 | ) | | (832 | ) |
100,000 |
| | 0.8055 | % | | One-Month LIBOR | | 9/2/2014 | | 9/1/2016 | | (317 | ) | | (94 | ) |
100,000 |
| | 0.8100 | % | | One-Month LIBOR | | 9/2/2014 | | 9/1/2016 | | (324 | ) | | (105 | ) |
100,000 |
| | 1.6730 | % | | One-Month LIBOR | | 9/1/2015 | | 8/1/2019 | | 239 |
| | 3,377 |
|
100,000 |
| | 1.7300 | % | | One-Month LIBOR | | 9/1/2015 | | 8/1/2019 | | 35 |
| | 3,217 |
|
100,000 |
| | 0.6123 | % | | One-Month LIBOR | | 1/3/2012 | | 9/1/2014 | | — |
| | (279 | ) |
100,000 |
| | 0.6100 | % | | One-Month LIBOR | | 1/3/2012 | | 9/1/2014 | | — |
| | (277 | ) |
|
| | |
| | | | | | | | $ | (1,581 | ) | | $ | 3,285 |
|
| |
(1) | The notional amount of this instrument is scheduled to amortize to $36.2 million. |
Based on our variable-rate debt balances, including the effect of interest rate swap contracts, our interest expense would have increased by $1.9 million in 2014 and $3.6 million in 2013 if short-term interest rates were 1% higher. Interest expense in 2013 was more sensitive to a change in interest rates than 2014 due primarily to our having a higher average variable-rate debt balance in 2013.
Item 8. Financial Statements and Supplementary Data
This item is included in a separate section at the end of this report beginning on page F-1.
Item 9. Changes in and Disagreements with Accountants on Accounting and Financial Disclosure
None.
Item 9A. Controls and Procedures
Our management, with the participation of our Chief Executive Officer and Chief Financial Officer, evaluated the effectiveness of our disclosure controls and procedures (as defined in Rule 13a-15(e) under the Exchange Act) as of December 31, 2014. Based on this evaluation, our Chief Executive Officer and Chief Financial Officer concluded that our disclosure controls and procedures as of December 31, 2014 were functioning effectively to provide reasonable assurance that the information required to be disclosed by us in reports filed or submitted under the Securities Exchange Act of 1934, as amended is (i) recorded, processed, summarized and reported within the time periods specified in the SEC’s rules and forms, and (ii) accumulated and communicated to our management, including our principal executive and principal financial officers, or persons performing similar functions, as appropriate to allow timely decisions regarding required disclosure.
| |
I. | Internal Control Over Financial Reporting |
COPT
(a) Management’s Annual Report on Internal Control Over Financial Reporting
Management’s Annual Report on Internal Control Over Financial Reporting is included in a separate section at the end of this report on page F-2.
(b) Report of Independent Registered Public Accounting Firm
The Report of Independent Registered Public Accounting Firm is included in a separate section at the end of this report on page F-4.
(c) Change in Internal Control over Financial Reporting
No change in the Company’s internal control over financial reporting occurred during the most recent fiscal quarter that has materially affected, or is reasonably likely to materially affect, its internal control over financial reporting.
COPLP
(a) Management’s Annual Report on Internal Control Over Financial Reporting
Management’s Annual Report on Internal Control Over Financial Reporting is included in a separate section at the end of this report on page F-3.
(b) Report of Independent Registered Public Accounting Firm
The Report of Independent Registered Public Accounting Firm is included in a separate section at the end of this report on page F-5.
(c) Change in Internal Control over Financial Reporting
No change in the Operating Partnership’s internal control over financial reporting occurred during the most recent fiscal quarter that has materially affected, or is reasonably likely to materially affect, its internal control over financial reporting.
Item 9B. Other Information
None.
PART III
Items 10, 11, 12, 13 & 14. Directors, Executive Officers and Corporate Governance; Executive Compensation; Security Ownership of Certain Beneficial Owners and Management and Related Stockholder Matters; Certain Relationships and Related Transactions, and Director Independence; and Principal Accountant Fees and Services
For the information required by Item 10, Item 11, Item 12, Item 13 and Item 14, you should refer to COPT’s definitive proxy statement relating to the 2015 Annual Meeting of COPT’s Shareholders to be filed with the Securities and Exchange Commission no later than 120 days after the end of the fiscal year covered by this Annual Report on Form 10-K.
PART IV
Item 15. Exhibits and Financial Statement Schedules
| |
(a) | The following documents are filed as exhibits to this Form 10-K: |
| |
1. | Financial Statements. See “Index to consolidated financial statements” on page F-1 of this Annual Report on Form 10-K. |
| |
2. | Financial Statement Schedules. See “Index to consolidated financial statements” on page F-1 of this Annual Report on Form 10-K. |
| |
3. | See section below entitled “Exhibits.” |
| |
(b) | Exhibits. Refer to the Exhibit Index that follows. Unless otherwise noted, the file number of all documents incorporated by reference is 1-14023. |
|
| | |
EXHIBIT NO. | | DESCRIPTION |
3.1.1 | | Amended and Restated Declaration of Trust of Registrant (filed with the Registrant’s Registration Statement on Form S-4 (Commission File No. 333-45649) and incorporated herein by reference). |
3.1.2 | | Articles of Amendment of Amended and Restated Declaration of Trust (filed on March 22, 2002 with the Company’s Annual Report on Form 10-K for the year ended December 31, 2001 and incorporated herein by reference). |
3.1.3 | | Articles of Amendment of Amended and Restated Declaration of Trust (filed with the Company’s Current Report on Form 8-K on December 29, 2004 and incorporated herein by reference). |
|
| | |
EXHIBIT NO. | | DESCRIPTION |
3.1.4 | | Articles Supplementary of Corporate Office Properties Trust relating to the Series G Cumulative Redeemable Preferred Shares, dated August 6, 2003 (filed with the Registrant’s Registration Statement on Form 8-A on August 7, 2003 and incorporated herein by reference). |
3.1.5 | | Articles Supplementary of Corporate Office Properties Trust relating to the Series H Cumulative Redeemable Preferred Shares, dated December 11, 2003 (filed with the Company’s Current Report on Form 8-K on December 12, 2003 and incorporated herein by reference). |
3.1.6 | | Articles Supplementary of Corporate Office Properties Trust relating to the Series J Cumulative Redeemable Preferred Shares of Beneficial Interest (filed with the Company’s Current Report on Form 8-K dated July 19, 2006 and incorporated herein by reference). |
3.1.7 | | Articles Supplementary of Corporate Office Properties Trust relating to the Series K Cumulative Redeemable Convertible Preferred Shares of Beneficial Interest (filed with the Company’s Current Report on Form 8-K dated January 16, 2007 and incorporated herein by reference). |
3.1.8 | | Articles Supplementary of Corporate Office Properties Trust relating to the Series L Cumulative Preferred Shares of Beneficial Interest (filed with the Company’s Current Report on Form 8-K dated June 25, 2012 and incorporated herein by reference). |
3.1.9 | | Articles of Amendment of Amended and Restated Declaration of Trust (filed with the Company’s Current Report on Form 8-K dated May 28, 2008 and incorporated herein by reference). |
3.1.10 | | Articles of Amendment of Amended and Restated Declaration of Trust (filed with the Company’s Current Report on Form 8-K dated May 19, 2010 and incorporated herein by reference). |
3.1.11 | | Articles of Amendment of Amended and Restated Declaration of Trust (filed with the Company’s Current Report on Form 8-K dated June 19, 2012 and incorporated herein by reference). |
3.1.12 | | Articles Supplementary filed with the State Department of Assessments and Taxation of Maryland on September 22, 2014 (filed with the Company’s Current Report on Form 8-K dated September 24, 2014 and incorporated herein by reference). |
3.2.1 | | Bylaws of the Registrant, as amended and restated on December 3, 2009 (filed with the Company’s Current Report on Form 8-K dated December 9, 2009 and incorporated herein by reference). |
3.2.2 | | First Amendment to Amended and Restated Bylaws (filed with the Company’s Current Report on Form 8-K dated December 18, 2012 and incorporated herein by reference). |
3.3 | | Form of certificate for the Registrant's Common Shares of Beneficial Interest, $0.01 par value per share (filed with the Registrant's Registration Statement on Form S-4 (Commission File No. 333-45649) and incorporated herein by reference). |
4.1 | | Indenture, dated as of April 7, 2010, among Corporate Office Properties, L.P., as issuer, Corporate Office Properties Trust, as guarantor, and Wells Fargo Bank, National Association, as trustee (filed with the Company’s Current Report on Form 8-K dated April 16, 2010 and incorporated herein by reference). |
4.2 | | 4.25% Exchangeable Senior Note due 2030 of Corporate Office Properties, L.P. (filed with the Company’s Current Report on Form 8-K dated April 16, 2010 and incorporated herein by reference). |
4.3 | | Indenture, dated as of May 6, 2013, among Corporate Office Properties, L.P., as issuer, Corporate Office Properties Trust, as guarantor, and U.S. Bank National Association, as trustee (filed with the Company’s Current Report on Form 8-K dated May 7, 2013 and incorporated herein by reference). |
5.1 | | Registration Rights Agreement, dated May 6, 2013, among Corporate Office Properties, L.P., Corporate Office Properties Trust, J.P. Morgan Securities LLC and Wells Fargo Securities, LLC (filed with the Company’s Current Report on Form 8-K dated May 7, 2013 and incorporated herein by reference). |
10.1.1 | | Second Amended and Restated Limited Partnership Agreement of the Operating Partnership, dated December 7, 1999 (filed on March 16, 2000 with the Company’s Annual Report on Form 10-K for the year ended December 31, 1999 and incorporated herein by reference). |
10.1.2 | | First Amendment to Second Amended and Restated Limited Partnership Agreement of the Operating Partnership, dated December 21, 1999 (filed on March 16, 2000 with the Company’s Annual Report on Form 10-K for the year ended December 31, 1999 and incorporated herein by reference). |
10.1.3 | | Second Amendment to Second Amended and Restated Limited Partnership Agreement of the Operating Partnership, dated December 21, 1999 (filed with the Company’s Post Effective Amendment No. 2 to Form S-3 dated November 1, 2000 (Registration Statement No. 333-71807) and incorporated herein by reference). |
10.1.4 | | Third Amendment to Second Amended and Restated Limited Partnership Agreement of the Operating Partnership, dated September 29, 2000 (filed with the Company’s Post Effective Amendment No. 2 to Form S-3 dated November 1, 2000 (Registration Statement No. 333-71807) and incorporated herein by reference). |
10.1.5 | | Fourth Amendment to Second Amended and Restated Limited Partnership Agreement of the Operating Partnership, dated November 27, 2000 (filed on March 27, 2003 with the Company’s Annual Report on Form 10-K for the year ended December 31, 2002 and incorporated herein by reference). |
|
| | |
EXHIBIT NO. | | DESCRIPTION |
10.1.6 | | Fifth Amendment to Second Amended and Restated Limited Partnership Agreement of the Operating Partnership, dated January 25, 2001 (filed on March 27, 2003 with the Company’s Annual Report on Form 10-K for the year ended December 31, 2002 and incorporated herein by reference). |
10.1.7 | | Sixth Amendment to Second Amended and Restated Limited Partnership Agreement of the Operating Partnership, dated April 3, 2001 (filed with the Company’s Current Report on Form 8-K dated April 4, 2001 and incorporated herein by reference). |
10.1.8 | | Seventh Amendment to Second Amended and Restated Limited Partnership Agreement of the Operating Partnership, dated August 30, 2001 (filed on March 27, 2003 with the Company’s Annual Report on Form 10-K for the year ended December 31, 2002 and incorporated herein by reference). |
10.1.9 | | Eighth Amendment to Second Amended and Restated Limited Partnership Agreement of the Operating Partnership, dated September 14, 2001 (filed with the Company’s Amended Current Report on Form 8-K dated September 14, 2001 and incorporated herein by reference). |
10.1.10 | | Ninth Amendment to Second Amended and Restated Limited Partnership Agreement of the Operating Partnership, dated October 16, 2001 (filed on March 27, 2003 with the Company’s Annual Report on Form 10-K for the year ended December 31, 2002 and incorporated herein by reference). |
10.1.11 | | Tenth Amendment to Second Amended and Restated Limited Partnership Agreement of the Operating Partnership, dated December 29, 2001 (filed on March 27, 2003 with the Company’s Annual Report on Form 10-K for the year ended December 31, 2002 and incorporated herein by reference). |
10.1.12 | | Eleventh Amendment to Second Amended and Restated Limited Partnership Agreement of the Operating Partnership, dated December 15, 2002 (filed on March 27, 2003 with the Company’s Annual Report on Form 10-K for the year ended December 31, 2002 and incorporated herein by reference). |
10.1.13 | | Twelfth Amendment to Second Amended and Restated Limited Partnership Agreement of Corporate Office Properties, L.P., dated June 2, 2003 (filed on August 12, 2003 with the Registrant’s Quarterly Report on Form 10-Q for the quarter ended June 30, 2003 and incorporated herein by reference). |
10.1.14 | | Thirteenth Amendment to Second Amended and Restated Limited Partnership Agreement of Corporate Office Properties, L.P., dated August 11, 2003 (filed on March 27, 2003 with the Company’s Annual Report on Form 10-K for the year ended December 31, 2002 and incorporated herein by reference). |
10.1.15 | | Fourteenth Amendment to Second Amended and Restated Limited Partnership Agreement of Corporate Office Properties, L.P., dated December 18, 2003 (filed on March 11, 2004 with the Company’s Annual Report on Form 10-K for the year ended December 31, 2003 and incorporated herein by reference). |
10.1.16 | | Fifteenth Amendment to Second Amended and Restated Limited Partnership Agreement of Corporate Office Properties, L.P., dated January 31, 2004 (filed on March 11, 2004 with the Company’s Annual Report on Form 10-K for the year ended December 31, 2003 and incorporated herein by reference). |
10.1.17 | | Sixteenth Amendment to Second Amended and Restated Limited Partnership Agreement of Corporate Office Properties, L.P., dated April 15, 2004 (filed on May 7, 2004 with the Company’s Form 10-Q for the quarter ended March 31, 2004 and incorporated herein by reference). |
10.1.18 | | Seventeenth Amendment to Second Amended and Restated Limited Partnership Agreement of Corporate Office Properties, L.P., dated September 23, 2004 (filed with the Company’s Current Report on Form 8-K dated September 23, 2004 and incorporated herein by reference). |
10.1.19 | | Eighteenth Amendment to Second Amended and Restated Limited Partnership Agreement of Corporate Office Properties, L.P., dated April 18, 2005 (filed with the Company’s Form 8-K on April 22, 2005 and incorporated herein by reference). |
10.1.20 | | Nineteenth Amendment to Second Amended and Restated Limited Partnership Agreement of Corporate Office Properties, L.P., dated July 8, 2005 (filed with the Company’s Current Report on Form 8-K on July 14, 2005 and incorporated herein by reference). |
10.1.21 | | Twentieth Amendment to Second Amended and Restated Limited Partnership Agreement of Corporate Office Properties, L.P., dated June 29, 2006 (filed with the Company’s Current Report on Form 8-K dated July 6, 2006 and incorporated herein by reference). |
10.1.22 | | Twenty-First Amendment to Second Amended and Restated Limited Partnership Agreement of Corporate Office Properties, L.P., dated July 20, 2006 (filed with the Company’s Current Report on Form 8-K dated July 26, 2006 and incorporated herein by reference). |
10.1.23 | | Twenty-Second Amendment to Second Amended and Restated Limited Partnership Agreement of Corporate Office Properties, L.P., dated January 9, 2007 (filed with the Company’s Current Report on Form 8-K dated January 16, 2007 and incorporated herein by reference). |
10.1.24 | | Twenty-Third Amendment to Second Amended and Restated Limited Partnership Agreement of Corporate Office Properties, L.P., dated April 6, 2007 (filed with the Company’s Current Report on Form 8-K dated April 12, 2007 and incorporated herein by reference). |
|
| | |
EXHIBIT NO. | | DESCRIPTION |
10.1.25 | | Twenty-Fourth Amendment to Second Amended and Restated Limited Partnership Agreement of Corporate Office Properties, L.P., dated November 2, 2007 (filed with the Company’s Current Report on Form 8-K dated November 5, 2007 and incorporated herein by reference). |
10.1.26 | | Twenty-Fifth Amendment to Second Amended and Restated Limited Partnership Agreement of Corporate Office Properties, L.P., dated December 31, 2008 (filed with the Company’s Current Report on Form 8-K dated January 5, 2009 and incorporated herein by reference). |
10.1.27 | | Twenty-Sixth Amendment to Second Amended and Restated Limited Partnership Agreement of Corporate Office Properties, L.P., dated March 4, 2010 (filed with the Company’s Current Report on Form 8-K dated March 10, 2010 and incorporated herein by reference). |
10.1.28 | | Twenty-Seventh Amendment to Second Amended and Restated Limited Partnership Agreement of Corporate Office Properties, L.P., dated February 3, 2011 (filed with the Company’s Current Report on Form 8-K dated February 3, 2011 and incorporated herein by reference). |
10.1.29 | | Twenty-Eighth Amendment to Second Amended and Restated Limited Partnership Agreement of Corporate Office Properties, L.P., dated September 15, 2011 (filed with the Company’s Current Report on Form 8-K dated September 16, 2011 and incorporated herein by reference). |
10.1.30 | | Twenty-Ninth Amendment to Second Amended and Restated Limited Partnership Agreement of Corporate Office Properties, L.P., dated June 27, 2012 (filed with the Company’s Current Report on Form 8-K dated June 27, 2012 and incorporated herein by reference). |
10.1.31 | | Thirtieth Amendment to Second Amended and Restated Limited Partnership Agreement of Corporate Office Properties, L.P., dated July 16, 2013 (filed with the Company’s Current Report on Form 8-K dated July 19, 2013 and incorporated herein by reference). |
10.1.32 | | Thirty-First Amendment to Second Amended and Restated Limited Partnership Agreement of Corporate Office Properties, L.P., dated September 17, 2013 (filed with the Company’s Current Report on Form 8-K dated September 19, 2013 and incorporated herein by reference). |
10.2.1* | | Corporate Office Properties Trust 1998 Long Term Incentive Plan (filed with the Registrant’s Registration Statement on Form S-4 (Commission File No. 333-45649) and incorporated herein by reference). |
10.2.2* | | Amendment No. 1 to Corporate Office Properties Trust 1998 Long Term Incentive Plan (filed on August 13, 1999 with the Company’s Quarterly Report on Form 10-Q for the quarter ended June 30, 1999 and incorporated herein by reference). |
10.2.3* | | Amendment No. 2 to Corporate Office Properties Trust 1998 Long Term Incentive Plan (filed on March 22, 2002 with the Company’s Annual Report on Form 10-K for the year ended December 31, 2001 and incorporated herein by reference). |
10.3* | | Corporate Office Properties Trust Supplemental Nonqualified Deferred Compensation Plan (filed with the Registrant’s Registration Statement on Form S-8 (Commission File No. 333-87384) and incorporated herein by reference). |
10.4.1* | | Employment Agreement, dated July 13, 2005, between Corporate Office Properties, L.P. Corporate Office Properties Trust and Randall M. Griffin (filed with the Company’s Current Report on Form 8-K dated July 19, 2005 and incorporated herein by reference). |
10.4.2* | | Amendment to Employment Agreement, dated May 30, 2006, between Corporate Office Properties, L.P., Corporate Office Properties Trust and Randall M. Griffin (filed with the Company’s Current Report on Form 8-K dated June 1, 2006 and incorporated herein by reference). |
10.4.3* | | Second Amendment to Employment Agreement, dated December 31, 2008, between Corporate Office Properties, L.P., Corporate Office Properties Trust and Randall M. Griffin (filed with the Company’s Current Report on Form 8-K dated January 5, 2009 and incorporated herein by reference). |
10.4.4* | | Third Amendment to Employment Agreement, dated September 16, 2010, between Corporate Office Properties, L.P., Corporate Office Properties Trust and Randall M. Griffin (filed on October 29, 2010 with the Company’s Quarterly Report on Form 10-Q for the quarter ended September 30, 2010 and incorporated herein by reference). |
10.5.1* | | Employment Agreement, dated September 12, 2002, between the Operating Partnership, COPT and Roger A. Waesche, Jr. (filed on March 27, 2003 with the Company’s Annual Report on Form 10-K for the year ended December 31, 2002 and incorporated herein by reference). |
10.5.2* | | Amendment to Employment Agreement, dated March 4, 2005, between the Operating Partnership, COPT and Roger A. Waesche, Jr. (filed on March 16, 2005 with the Company’s Annual Report on Form 10-K for the year ended December 31, 2004 and incorporated herein by reference). |
10.5.3* | | Second Amendment to Employment Agreement, dated May 30, 2006, between Corporate Office Properties, L.P., Corporate Office Properties Trust, and Roger A. Waesche, Jr. (filed with the Company’s Current Report on Form 8-K dated June 1, 2006 and incorporated herein by reference). |
|
| | |
EXHIBIT NO. | | DESCRIPTION |
10.5.4* | | Third Amendment to Employment Agreement, dated July 31, 2006, between Corporate Office Properties, L.P., Corporate Office Properties Trust, and Roger A. Waesche, Jr. (filed with the Company’s Current Report on Form 8-K dated August 1, 2006 and incorporated herein by reference). |
10.5.5* | | Fourth Amendment to Employment Agreement, dated March 2, 2007, between Corporate Office Properties, L.P., Corporate Office Properties Trust, and Roger A. Waesche, Jr. (filed with the Company’s Annual Report on Form 10-K dated February 29, 2008 and incorporated herein by reference). |
10.5.6* | | Fifth Amendment to Employment Agreement, dated September 16, 2010, between Corporate Office Properties, L.P., Corporate Office Properties Trust, and Roger A. Waesche, Jr. (filed on October 29, 2010 with the Company’s Quarterly Report on Form 10-Q for the quarter ended September 30, 2010 and incorporated herein by reference). |
10.5.7* | | Sixth Amendment to Employment Agreement, dated December 12, 2012, between Corporate Office Properties, L.P., Corporate Office Properties Trust, and Roger A. Waesche, Jr. (filed with the Company’s Annual Report on Form 10-K dated February 12, 2013 and incorporated herein by reference). |
10.5.8* | | Letter Agreement, dated March 8, 2013, between Corporate Office Properties Trust, Corporate Office Properties, L.P., and Roger A. Waesche, Jr. (filed with the Company’s Current Report on Form 8-K dated March 13, 2013 and incorporated herein by reference). |
10.6.1* | | Employment Agreement, dated July 31, 2006, between Corporate Office Properties, L.P., Corporate Office Properties Trust and Stephen E. Riffee (filed with the Company’s Current Report on Form 8-K dated August 1, 2006 and incorporated herein by reference). |
10.6.2* | | First Amendment to Employment Agreement, dated December 31, 2008, between Corporate Office Properties, L.P., Corporate Office Properties Trust and Stephen E. Riffee (filed with the Company’s Current Report on Form 8-K dated January 5, 2009 and incorporated herein by reference). |
10.6.3* | | Second Amendment to Employment Agreement, dated September 16, 2010, between Corporate Office Properties, L.P., Corporate Office Properties Trust and Stephen E. Riffee (filed on October 29, 2010 with the Company’s Quarterly Report on Form 10-Q for the quarter ended September 30, 2010 and incorporated herein by reference). |
10.6.4* | | Employment Agreement, dated June 14, 2012, between Corporate Office Properties, L.P., Corporate Office Properties Trust and Stephen E. Riffee (filed with the Company’s Current Report on Form 8-K dated June 19, 2012 and incorporated herein by reference). |
10.7.1* | | Employment Agreement, dated December 31, 2008, between Corporate Development Services, LLC, Corporate Office Properties Trust and Wayne Lingafelter (filed with the Company’s Annual Report on Form 8-K dated January 5, 2009 and incorporated herein by reference). |
10.7.2* | | First Amendment to Employment Agreement, dated September 16, 2010, between Corporate Development Services, LLC, Corporate Office Properties Trust and Wayne Lingafelter (filed on October 29, 2010 with the Company’s Quarterly Report on Form 10-Q for the quarter ended September 30, 2010 and incorporated herein by reference). |
10.7.3* | | Second Amendment to Employment Agreement, dated June 20, 2014, between Corporate Office Properties, L.P., Corporate Office Properties Trust, and Wayne H. Lingafelter (filed on July 30, 2014 with the Company’s Quarterly Report on Form 10-Q for the quarter ended June 30, 2014 and incorporated herein by reference). |
10.7.4* | | Letter Agreement, dated August 28, 2014, between Corporate Office Properties Trust, Corporate Office Properties, L.P., and Wayne H. Lingafelter (filed with the Company’s Current Report on Form 8-K dated September 3, 2014 and incorporated herein by reference). |
10.8.1* | | Employment Agreement, dated September 15, 2011, between Corporate Office Properties, L.P., Corporate Office Properties Trust and Stephen E. Budorick (filed with the Company’s Current Report on Form 8-K dated September 16, 2011 and incorporated herein by reference). |
10.8.1* | | Letter Agreement, dated September 26, 2014, between Corporate Office Properties Trust, Corporate Office Properties, L.P., and Stephen E. Budorick (filed with the Company’s Current Report on Form 8-K dated October 1, 2014 and incorporated herein by reference). |
10.9 | | Amended and Restated Registration Rights Agreement, dated March 16, 1998, for the benefit of certain shareholders of the Company (filed on August 12, 1998 with the Company’s Quarterly Report on Form 10-Q for the quarter ended June 30, 1998 and incorporated herein by reference). |
10.10.1* | | Corporate Office Properties Trust Supplemental Nonqualified Deferred Compensation Plan (filed with the Company’s Current Report on Form 8-K dated December 10, 2008 and incorporated herein by reference). |
10.10.2* | | First Amendment to the Corporate Office Properties Trust Supplemental Nonqualified Deferred Compensation Plan dated December 4, 2008 (filed with the Company’s Current Report on Form 8-K dated December 10, 2008 and incorporated herein by reference). |
|
| | |
EXHIBIT NO. | | DESCRIPTION |
10.11.1* | | Corporate Office Properties Trust 2008 Omnibus Equity and Incentive Plan (included in Appendix A to the Company’s Definitive Proxy Statement on Schedule 14A filed with the Securities and Exchange Commission on April 9, 2008 and incorporated herein by reference). |
10.11.2* | | Corporate Office Properties Trust Amended and Restated 2008 Omnibus Equity and Incentive Plan (included in Annex A to the Company’s Definitive Proxy Statement on Schedule 14A filed with the Securities and Exchange Commission on March 30, 2010 and incorporated herein by reference). |
10.12* | | Corporate Office Properties Trust and Corporate Office Properties, L.P. Executive Change in Control and Severance Plan (filed with the Company’s Current Report on Form 8-K dated March 13, 2013 and incorporated herein by reference). |
10.13 | | Registration Rights Agreement, dated April 7, 2010, among Corporate Office Properties, L.P., Corporate Office Properties Trust, J.P. Morgan Securities Inc. and RBC Capital Markets Corporation (filed with the Company’s Current Report on Form 8-K dated April 16, 2010 and incorporated herein by reference). |
10.14 | | Common Stock Delivery Agreement, dated April 7, 2010, among Corporate Office Properties, L.P. and Corporate Office Properties Trust (filed with the Company’s Current Report on Form 8-K dated April 16, 2010 and incorporated herein by reference). |
10.15.1 | | Credit Agreement, dated as of September 1, 2011, by and among Corporate Office Properties, L.P.; Corporate Office Properties Trust; J.P. Morgan Securities LLC; KeyBanc Capital Markets; KeyBank National Association; JPMorgan Chase Bank, N.A.; Bank of America, N.A.; Royal Bank of Canada; Wells Fargo Bank, National Association; Barclays Bank PLC; PNC Bank, National Association; Regions Bank; Manufacturers and Traders Trust Company; and SunTrust Bank (filed with the Company’s Current Report on Form 8-K/A dated September 1, 2011 and incorporated herein by reference). |
10.15.2 | | Second Amendment to Credit Agreement, dated as of July 16, 2013, by and among Corporate Office Properties, L.P.; Corporate Office Properties Trust; J.P. Morgan Securities LLC; KeyBanc Capital Markets; KeyBank National Association; JPMorgan Chase Bank, N.A.; Bank of America, N.A.; Royal Bank of Canada; Wells Fargo Bank, National Association; Barclays Bank PLC; PNC Bank, National Association; Capital One, N.A., Regions Bank; Manufacturers and Traders Trust Company; and SunTrust Bank (filed with the Company’s Current Report on Form 8-K dated July 19, 2013 and incorporated herein by reference). |
10.16 | | Term Loan Agreement, dated as of September 1, 2011, by and among Corporate Office Properties, L.P.; Corporate Office Properties Trust; J.P. Morgan Securities LLC; KeyBanc Capital Markets; KeyBank National Association; JPMorgan Chase Bank, N.A.; Bank of America, N.A.; Royal Bank of Canada; Barclays Bank PLC; PNC Bank, National Association; Wells Fargo Bank, National Association; Regions Bank; Manufacturers and Traders Trust Company; and SunTrust Bank (filed with the Company’s Current Report on Form 8-K/A dated September 1, 2011 and incorporated herein by reference). |
10.17.1 | | Term Loan Agreement, dated as of February 14, 2012, by and among Corporate Office Properties, L.P.; Corporate Office Properties Trust; J.P. Morgan Securities LLC; KeyBanc Capital Markets; KeyBank National Association; JPMorgan Chase Bank, N.A.; Bank of America, N.A.; Royal Bank of Canada; and Wells Fargo Bank, National Association (filed with the Company’s Quarter Report on Form 10-Q for the quarter ended March 31, 2012 and incorporated herein by reference). |
10.17.2 | | Second Amendment to Term Loan Agreement, dated as of July 16, 2013, by and among Corporate Office Properties, L.P.; Corporate Office Properties Trust; J.P. Morgan Securities LLC; KeyBanc Capital Markets; KeyBank National Association; JPMorgan Chase Bank, N.A.; Bank of America, N.A.; Royal Bank of Canada; Barclays Bank PLC; PNC Bank, National Association; Wells Fargo Bank, National Association; Capital One, N.A.; Regions Bank; Manufacturers and Traders Trust Company; and SunTrust Bank (filed with the Company’s Current Report on Form 8-K dated July 19, 2013 and incorporated herein by reference). |
10.17.3 | | First Amendment to Term Loan Agreement, dated as of July 16, 2013, by and among Corporate Office Properties, L.P.; Corporate Office Properties Trust; J.P. Morgan Securities LLC; KeyBanc Capital Markets; KeyBank National Association; JPMorgan Chase Bank, N.A.; Bank of America, N.A.; PNC Bank, National Association; Royal Bank of Canada; and Wells Fargo Bank, National Association (filed with the Company’s Current Report on Form 8-K dated July 19, 2013 and incorporated herein by reference). |
10.18 | | Indenture, dated as of May 6, 2013, among Corporate Office Properties, L.P., as issuer, Corporate Office Properties Trust, as guarantor, and U.S. Bank National Association, as trustee (filed with the Company’s Current Report on Form 8-K dated May 7, 2013 and incorporated herein by reference). |
10.19 | | Registration Rights Agreement, dated May 6, 2013, among Corporate Office Properties, L.P., Corporate Office Properties Trust, J.P. Morgan Securities LLC and Wells Fargo Securities, LLC (filed with the Company’s Current Report on Form 8-K dated May 7, 2013 and incorporated herein by reference). |
10.20 | | Indenture, dated as of September 16, 2013, by and among Corporate Office Properties, L.P., as issuer, Corporate Office Properties Trust, as guarantor, and U.S. Bank National Association, as trustee (filed with the Company’s Current Report on Form 8-K dated September 19, 2013 and incorporated herein by reference). |
|
| | |
EXHIBIT NO. | | DESCRIPTION |
10.21 | | First Supplemental Indenture, dated September 16, 2013, by and among Corporate Office Properties, L.P., as issuer, Corporate Office Properties Trust, as guarantor, and U.S. Bank National Association, as trustee (filed with the Company’s Current Report on Form 8-K dated September 19, 2013 and incorporated herein by reference). |
10.22 | | Second Supplemental Indenture, dated as of May 14, 2014, among Corporate Office Properties, L.P., as issuer, Corporate Office Properties Trust, as guarantor, and U.S. Bank National Association, as trustee. (filed with the Company’s Current Report on Form 8-K dated May 14, 2014 and incorporated herein by reference). |
12.1 | | COPT’s Statement regarding Computation of Earnings to Combined Fixed Charges and Preferred Share Dividends (filed herewith). |
12.2 | | COPLP’s Statement regarding Computation of Consolidated Ratio of Earnings to Fixed Charges (filed herewith). |
21.1 | | Subsidiaries of COPT (filed herewith). |
21.2 | | Subsidiaries of COPLP (filed herewith). |
23.1 | | COPT’s Consent of Independent Registered Public Accounting Firm (filed herewith). |
23.2 | | COPLP’s Consent of Independent Registered Public Accounting Firm (filed herewith). |
31.1 | | Certification of the Chief Executive Officer of Corporate Office Properties Trust required by Rule 13a-14(a) under the Securities Exchange Act of 1934, as amended (filed herewith). |
31.2 | | Certification of the Chief Financial Officer of Corporate Office Properties Trust required by Rule 13a-14(a) under the Securities Exchange Act of 1934, as amended (filed herewith). |
31.3 | | Certification of the Chief Executive Officer of Corporate Office Properties, L.P. required by Rule 15d-14(a) under the Securities Exchange Act of 1934, as amended (filed herewith). |
31.4 | | Certification of the Chief Financial Officer of Corporate Office Properties, L.P. required by Rule 15d-14(a) under the Securities Exchange Act of 1934, as amended (filed herewith). |
32.1 | | Certification of the Chief Executive Officer of Corporate Office Properties Trust required by Rule 13a-14(b) under the Securities Exchange Act of 1934, as amended. (This exhibit shall not be deemed “filed” for purposes of Section 18 of the Securities Exchange Act of 1934, as amended, or otherwise subject to the liability of that section. Further, this exhibit shall not be deemed to be incorporated by reference into any filing under the Securities Exchange Act of 1933, as amended, or the Securities Exchange Act of 1934, as amended.) (Furnished herewith). |
32.2 | | Certification of the Chief Financial Officer of Corporate Office Properties Trust required by Rule 13a-14(b) under the Securities Exchange Act of 1934, as amended. (This exhibit shall not be deemed “filed” for purposes of Section 18 of the Securities Exchange Act of 1934, as amended, or otherwise subject to the liability of that section. Further, this exhibit shall not be deemed to be incorporated by reference into any filing under the Securities Exchange Act of 1933, as amended, or the Securities Exchange Act of 1934, as amended). (Furnished herewith). |
32.3 | | Certification of the Chief Executive Officer of Corporate Office Properties, L.P. required by Rule 15d-14(b) under the Securities Exchange Act of 1934, as amended. (This exhibit shall not be deemed “filed” for purposes of Section 18 of the Securities Exchange Act of 1934, as amended, or otherwise subject to the liability of that section. Further, this exhibit shall not be deemed to be incorporated by reference into any filing under the Securities Exchange Act of 1933, as amended, or the Securities Exchange Act of 1934, as amended.) (Furnished herewith). |
32.4 | | Certification of the Chief Financial Officer of Corporate Office Properties, L.P. required by Rule 15d-14(b) under the Securities Exchange Act of 1934, as amended. (This exhibit shall not be deemed “filed” for purposes of Section 18 of the Securities Exchange Act of 1934, as amended, or otherwise subject to the liability of that section. Further, this exhibit shall not be deemed to be incorporated by reference into any filing under the Securities Exchange Act of 1933, as amended, or the Securities Exchange Act of 1934, as amended). (Furnished herewith). |
101.INS | | XBRL Instance Document (filed herewith). |
101.SCH | | XBRL Taxonomy Extension Schema Document (filed herewith). |
101.CAL | | XBRL Taxonomy Extension Calculation Linkbase Document (filed herewith). |
101.LAB | | XBRL Extension Labels Linkbase (filed herewith). |
101.PRE | | XBRL Taxonomy Extension Presentation Linkbase Document (filed herewith). |
101.DEF | | XBRL Taxonomy Extension Definition Linkbase Document (filed herewith). |
* - Indicates a compensatory plan or arrangement required to be filed as an exhibit to this Form 10-K.
(c) Not applicable.
SIGNATURES
Pursuant to the requirements of Section 13 or 15(d) of the Securities Exchange Act of 1934, the Registrant has duly caused this report to be signed on its behalf by the undersigned, thereunto duly authorized.
|
| | | |
| | | CORPORATE OFFICE PROPERTIES TRUST |
| | | |
Date: | February 18, 2015 | By: | /s/ Roger A. Waesche, Jr. |
| | | Roger A. Waesche, Jr. |
| | | President and Chief Executive Officer |
| | | |
| | | |
Date: | February 18, 2015 | By: | /s/ Anthony Mifsud |
| | | Anthony Mifsud |
| | | Executive Vice President and Chief Financial Officer |
Pursuant to the requirements of the Securities Exchange Act of 1934, this report has been signed below by the following persons on behalf of the Registrant and in the capacities and on the dates indicated:
|
| | | |
Signatures | | Title | Date |
/s/ Thomas F. Brady | | Chairman of the Board and Trustee | February 18, 2015 |
(Thomas F. Brady) | | | |
/s/ Roger A. Waesche, Jr. | | President and Chief Executive Officer and Trustee | February 18, 2015 |
(Roger A. Waesche, Jr.) | | | |
/s/ Anthony Mifsud | | Executive Vice President and Chief Financial | February 18, 2015 |
(Anthony Mifsud) | | Officer (Principal Financial Officer) | |
/s/ Gregory J. Thor | | Senior Vice President, Controller and Chief | February 18, 2015 |
(Gregory J. Thor) | | Accounting Officer (Principal Accounting Officer) | |
/s/ Robert L. Denton | | Trustee | February 18, 2015 |
( Robert L. Denton) | | | |
/s/ Philip L. Hawkins | | Trustee | February 18, 2015 |
(Philip L. Hawkins) | | | |
/s/ Elizabeth A. Hight | | Trustee | February 18, 2015 |
(Elizabeth A. Hight) | | | |
/s/ David M. Jacobstein | | Trustee | February 18, 2015 |
(David M. Jacobstein) | | | |
/s/ Steven D. Kesler | | Trustee | February 18, 2015 |
(Steven D. Kesler) | | | |
/s/ C. Taylor Pickett | | Trustee | February 18, 2015 |
(C. Taylor Pickett) | | | |
/s/ Richard Szafranski | | Trustee | February 18, 2015 |
(Richard Szafranski) | | | |
Pursuant to the requirements of Section 13 or 15(d) of the Securities Exchange Act of 1934, the Registrant has duly caused this report to be signed on its behalf by the undersigned, thereunto duly authorized.
|
| | | |
| | | CORPORATE OFFICE PROPERTIES, L.P. |
| | | By: Corporate Office Properties Trust, |
| | | its General Partner |
| | | |
Date: | February 18, 2015 | By: | /s/ Roger A. Waesche, Jr. |
| | | Roger A. Waesche, Jr. |
| | | President and Chief Executive Officer |
| | | |
| | | |
Date: | February 18, 2015 | By: | /s/ Anthony Mifsud |
| | | Anthony Mifsud |
| | | Executive Vice President and Chief Financial Officer |
Pursuant to the requirements of the Securities Exchange Act of 1934, this report has been signed below by the following persons on behalf of the Registrant and in the capacities and on the dates indicated:
|
| | | |
Signatures | | Title | Date |
/s/ Thomas F. Brady | | Chairman of the Board and Trustee | February 18, 2015 |
(Thomas F. Brady) | | | |
/s/ Roger A. Waesche, Jr. | | President and Chief Executive Officer and Trustee | February 18, 2015 |
(Roger A. Waesche, Jr.) | | | |
/s/ Anthony Mifsud | | Executive Vice President and Chief Financial | February 18, 2015 |
(Anthony Mifsud) | | Officer (Principal Financial Officer) | |
/s/ Gregory J. Thor | | Senior Vice President, Controller and Chief | February 18, 2015 |
(Gregory J. Thor) | | Accounting Officer (Principal Accounting Officer) | |
/s/ Robert L. Denton | | Trustee | February 18, 2015 |
( Robert L. Denton) | | | |
/s/ Philip L. Hawkins | | Trustee | February 18, 2015 |
(Philip L. Hawkins) | | | |
/s/ Elizabeth A. Hight | | Trustee | February 18, 2015 |
(Elizabeth A. Hight) | | | |
/s/ David M. Jacobstein | | Trustee | February 18, 2015 |
(David M. Jacobstein) | | | |
/s/ Steven D. Kesler | | Trustee | February 18, 2015 |
(Steven D. Kesler) | | | |
/s/ C. Taylor Pickett | | Trustee | February 18, 2015 |
(C. Taylor Pickett) | | | |
/s/ Richard Szafranski | | Trustee | February 18, 2015 |
(Richard Szafranski) | | | |
INDEX TO FINANCIAL STATEMENTS AND SCHEDULE
|
| |
Management’s Reports of Internal Control Over Financial Reporting | |
Corporate Office Properties Trust | |
Corporate Office Properties, L.P. | |
| |
Reports of Independent Registered Public Accounting Firm | |
Corporate Office Properties Trust | |
Corporate Office Properties, L.P. | |
| |
Consolidated Financial Statements of Corporate Office Properties Trust | |
| |
| |
| |
| |
| |
| |
Consolidated Financial Statements of Corporate Office Properties, L.P. | |
| |
| |
| |
| |
| |
| |
| |
| |
Financial Statements Schedules | |
| |
| |
Corporate Office Properties Trust Management’s Report On Internal Control Over Financial Reporting
Management is responsible for establishing and maintaining adequate internal control over financial reporting, and for performing an assessment of the effectiveness of internal control over financial reporting as of December 31, 2014. Internal control over financial reporting is a process designed to provide reasonable assurance regarding the reliability of financial reporting and the preparation of financial statements for external purposes in accordance with generally accepted accounting principles. Our internal control over financial reporting includes those policies and procedures that (i) pertain to the maintenance of records that, in reasonable detail, accurately and fairly reflect the transactions and dispositions of our assets; (ii) provide reasonable assurance that transactions are recorded as necessary to permit preparation of financial statements in accordance with generally accepted accounting principles, and that our receipts and expenditures are being made only in accordance with authorizations of our management and trustees; and (iii) provide reasonable assurance regarding prevention or timely detection of unauthorized acquisition, use or disposition of our assets that could have a material effect on the financial statements. Because of its inherent limitations, internal control over financial reporting may not prevent or detect misstatements. Also, projections of any evaluation of effectiveness to future periods are subject to the risk that controls may become inadequate because of changes in conditions, or that the degree of compliance with the policies or procedures may deteriorate.
Management performed an assessment of the effectiveness of our internal control over financial reporting as of December 31, 2014 based upon criteria in Internal Control - Integrated Framework issued by the Committee of Sponsoring Organizations of the Treadway Commission (“COSO”). Based on our assessment, management determined that our internal control over financial reporting was effective as of December 31, 2014 based on the criteria in Internal Control-Integrated Framework (2013) issued by the COSO.
The effectiveness of our internal control over financial reporting as of December 31, 2014 has been audited by PricewaterhouseCoopers LLP, an independent registered public accounting firm, as stated in their report which appears herein.
Corporate Office Properties, L.P. Management’s Report On Internal Control Over Financial Reporting
Management is responsible for establishing and maintaining adequate internal control over financial reporting, and for performing an assessment of the effectiveness of internal control over financial reporting as of December 31, 2014. Internal control over financial reporting is a process designed to provide reasonable assurance regarding the reliability of financial reporting and the preparation of financial statements for external purposes in accordance with generally accepted accounting principles. Our internal control over financial reporting includes those policies and procedures that (i) pertain to the maintenance of records that, in reasonable detail, accurately and fairly reflect the transactions and dispositions of our assets; (ii) provide reasonable assurance that transactions are recorded as necessary to permit preparation of financial statements in accordance with generally accepted accounting principles, and that our receipts and expenditures are being made only in accordance with authorizations of our management and trustees; and (iii) provide reasonable assurance regarding prevention or timely detection of unauthorized acquisition, use or disposition of our assets that could have a material effect on the financial statements. Because of its inherent limitations, internal control over financial reporting may not prevent or detect misstatements. Also, projections of any evaluation of effectiveness to future periods are subject to the risk that controls may become inadequate because of changes in conditions, or that the degree of compliance with the policies or procedures may deteriorate.
Management performed an assessment of the effectiveness of our internal control over financial reporting as of December 31, 2014 based upon criteria in Internal Control - Integrated Framework issued by the Committee of Sponsoring Organizations of the Treadway Commission (“COSO”). Based on our assessment, management determined that our internal control over financial reporting was effective as of December 31, 2014 based on the criteria in Internal Control-Integrated Framework (2013) issued by the COSO.
The effectiveness of our internal control over financial reporting as of December 31, 2014 has been audited by PricewaterhouseCoopers LLP, an independent registered public accounting firm, as stated in their report which appears herein.
Report of Independent Registered Public Accounting Firm
To the Board of Trustees and Shareholders of Corporate Office Properties Trust:
In our opinion, the consolidated financial statements listed in the accompanying index present fairly, in all material respects, the financial position of Corporate Office Properties Trust and its subsidiaries at December 31, 2014 and December 31, 2013, and the results of their operations and their cash flows for each of the three years in the period ended December 31, 2014 in conformity with accounting principles generally accepted in the United States of America. In addition, in our opinion, the financial statement schedules listed in the accompanying index present fairly, in all material respects, the information set forth therein when read in conjunction with the related consolidated financial statements. Also in our opinion, the Company maintained, in all material respects, effective internal control over financial reporting as of December 31, 2014, based on criteria established in Internal Control - Integrated Framework (2013) issued by the Committee of Sponsoring Organizations of the Treadway Commission (COSO). The Company’s management is responsible for these financial statements and financial statement schedules, for maintaining effective internal control over financial reporting and for its assessment of the effectiveness of internal control over financial reporting, included in the accompanying “Management's Report on Internal Control over Financial Reporting”. Our responsibility is to express opinions on these financial statements, on the financial statement schedules, and on the Company’s internal control over financial reporting based on our integrated audits. We conducted our audits in accordance with the standards of the Public Company Accounting Oversight Board (United States). Those standards require that we plan and perform the audits to obtain reasonable assurance about whether the financial statements are free of material misstatement and whether effective internal control over financial reporting was maintained in all material respects. Our audits of the financial statements included examining, on a test basis, evidence supporting the amounts and disclosures in the financial statements, assessing the accounting principles used and significant estimates made by management, and evaluating the overall financial statement presentation. Our audit of internal control over financial reporting included obtaining an understanding of internal control over financial reporting, assessing the risk that a material weakness exists, and testing and evaluating the design and operating effectiveness of internal control based on the assessed risk. Our audits also included performing such other procedures as we considered necessary in the circumstances. We believe that our audits provide a reasonable basis for our opinions.
A company’s internal control over financial reporting is a process designed to provide reasonable assurance regarding the reliability of financial reporting and the preparation of financial statements for external purposes in accordance with generally accepted accounting principles. A company’s internal control over financial reporting includes those policies and procedures that (i) pertain to the maintenance of records that, in reasonable detail, accurately and fairly reflect the transactions and dispositions of the assets of the company; (ii) provide reasonable assurance that transactions are recorded as necessary to permit preparation of financial statements in accordance with generally accepted accounting principles, and that receipts and expenditures of the company are being made only in accordance with authorizations of management and directors of the company; and (iii) provide reasonable assurance regarding prevention or timely detection of unauthorized acquisition, use, or disposition of the company’s assets that could have a material effect on the financial statements.
Because of its inherent limitations, internal control over financial reporting may not prevent or detect misstatements. Also, projections of any evaluation of effectiveness to future periods are subject to the risk that controls may become inadequate because of changes in conditions, or that the degree of compliance with the policies or procedures may deteriorate.
As discussed in Note 2 to the consolidated financial statements, the Company adopted accounting standards update (“ASU”) No. 2014-08, “Reporting Discontinued Operations and Disclosures of Disposals of Components of an Entity", which changed the criteria for reporting discontinued operations in 2014.
/s/ PricewaterhouseCoopers LLP
Baltimore, MD
February 18, 2015
Report of Independent Registered Public Accounting Firm
To the Board of Trustees and Unitholders of Corporate Office Properties, L.P.:
In our opinion, the consolidated financial statements listed in the accompanying index present fairly, in all material respects, the financial position of Corporate Office Properties, L.P. and its subsidiaries at December 31, 2014 and December 31, 2013, and the results of their operations and their cash flows for each of the three years in the period ended December 31, 2014 in conformity with accounting principles generally accepted in the United States of America. In addition, in our opinion, the financial statement schedules listed in the accompanying index present fairly, in all material respects, the information set forth therein when read in conjunction with the related consolidated financial statements. Also in our opinion, the Company maintained, in all material respects, effective internal control over financial reporting as of December 31, 2014, based on criteria established in Internal Control - Integrated Framework (2013) issued by the Committee of Sponsoring Organizations of the Treadway Commission (COSO). The Company’s management is responsible for these financial statements and financial statement schedules, for maintaining effective internal control over financial reporting and for its assessment of the effectiveness of internal control over financial reporting, included in the accompanying “Management's Report on Internal Control over Financial Reporting”. Our responsibility is to express opinions on these financial statements, on the financial statement schedules, and on the Company’s internal control over financial reporting based on our integrated audits. We conducted our audits in accordance with the standards of the Public Company Accounting Oversight Board (United States). Those standards require that we plan and perform the audits to obtain reasonable assurance about whether the financial statements are free of material misstatement and whether effective internal control over financial reporting was maintained in all material respects. Our audits of the financial statements included examining, on a test basis, evidence supporting the amounts and disclosures in the financial statements, assessing the accounting principles used and significant estimates made by management, and evaluating the overall financial statement presentation. Our audit of internal control over financial reporting included obtaining an understanding of internal control over financial reporting, assessing the risk that a material weakness exists, and testing and evaluating the design and operating effectiveness of internal control based on the assessed risk. Our audits also included performing such other procedures as we considered necessary in the circumstances. We believe that our audits provide a reasonable basis for our opinions.
A company’s internal control over financial reporting is a process designed to provide reasonable assurance regarding the reliability of financial reporting and the preparation of financial statements for external purposes in accordance with generally accepted accounting principles. A company’s internal control over financial reporting includes those policies and procedures that (i) pertain to the maintenance of records that, in reasonable detail, accurately and fairly reflect the transactions and dispositions of the assets of the company; (ii) provide reasonable assurance that transactions are recorded as necessary to permit preparation of financial statements in accordance with generally accepted accounting principles, and that receipts and expenditures of the company are being made only in accordance with authorizations of management and directors of the company; and (iii) provide reasonable assurance regarding prevention or timely detection of unauthorized acquisition, use, or disposition of the company’s assets that could have a material effect on the financial statements.
Because of its inherent limitations, internal control over financial reporting may not prevent or detect misstatements. Also, projections of any evaluation of effectiveness to future periods are subject to the risk that controls may become inadequate because of changes in conditions, or that the degree of compliance with the policies or procedures may deteriorate.
As discussed in Note 2 to the consolidated financial statements, the Company adopted accounting standards update (“ASU”) No. 2014-08, “Reporting Discontinued Operations and Disclosures of Disposals of Components of an Entity", which changed the criteria for reporting discontinued operations in 2014.
/s/ PricewaterhouseCoopers LLP
Baltimore, MD
February 18, 2015
Corporate Office Properties Trust and Subsidiaries
Consolidated Balance Sheets
(in thousands, except share data)
|
| | | | | | | |
| December 31, |
| 2014 | | 2013 |
Assets | |
| | |
|
Properties, net: | |
| | |
|
Operating properties, net | $ | 2,751,488 |
| | $ | 2,702,693 |
|
Projects in development or held for future development | 545,426 |
| | 511,608 |
|
Total properties, net | 3,296,914 |
| | 3,214,301 |
|
Assets held for sale, net | 14,339 |
| | — |
|
Cash and cash equivalents | 6,077 |
| | 54,373 |
|
Restricted cash and marketable securities | 9,069 |
| | 11,448 |
|
Accounts receivable (net of allowance for doubtful accounts of $717 and $2,976, respectively) | 26,901 |
| | 27,000 |
|
Deferred rent receivable (net of allowance of $1,418 and $2,126, respectively) | 95,910 |
| | 89,456 |
|
Intangible assets on real estate acquisitions, net | 43,854 |
| | 59,258 |
|
Deferred leasing and financing costs, net | 64,797 |
| | 66,267 |
|
Investing receivables | 52,147 |
| | 53,663 |
|
Prepaid expenses and other assets | 60,249 |
| | 54,186 |
|
Total assets | $ | 3,670,257 |
| | $ | 3,629,952 |
|
Liabilities and equity | |
| | |
|
Liabilities: | |
| | |
|
Debt, net | $ | 1,920,057 |
| | $ | 1,927,703 |
|
Accounts payable and accrued expenses | 123,035 |
| | 98,785 |
|
Rents received in advance and security deposits | 31,011 |
| | 31,492 |
|
Dividends and distributions payable | 29,862 |
| | 29,080 |
|
Deferred revenue associated with operating leases | 13,031 |
| | 10,369 |
|
Interest rate derivatives | 1,855 |
| | 3,309 |
|
Other liabilities | 12,105 |
| | 14,207 |
|
Total liabilities | 2,130,956 |
| | 2,114,945 |
|
Commitments and contingencies (Note 23) |
|
| |
|
|
Redeemable noncontrolling interest | 18,417 |
| | 17,758 |
|
Equity: | |
| | |
|
Corporate Office Properties Trust’s shareholders’ equity: | |
| | |
|
Preferred Shares of beneficial interest at liquidation preference | 199,083 |
| | 249,083 |
|
Common Shares of beneficial interest ($0.01 par value; 125,000,000 shares authorized, shares issued and outstanding of 93,255,284 at December 31, 2014 and 87,394,512 at December 31, 2013) | 933 |
| | 874 |
|
Additional paid-in capital | 1,969,968 |
| | 1,814,015 |
|
Cumulative distributions in excess of net income | (717,264 | ) | | (641,868 | ) |
Accumulated other comprehensive (loss) income | (1,297 | ) | | 3,480 |
|
Total Corporate Office Properties Trust’s shareholders’ equity | 1,451,423 |
| | 1,425,584 |
|
Noncontrolling interests in subsidiaries: | |
| | |
|
Common units in COPLP | 51,534 |
| | 53,468 |
|
Preferred units in COPLP | 8,800 |
| | 8,800 |
|
Other consolidated entities | 9,127 |
| | 9,397 |
|
Noncontrolling interests in subsidiaries | 69,461 |
| | 71,665 |
|
Total equity | 1,520,884 |
| | 1,497,249 |
|
Total liabilities, redeemable noncontrolling interest and equity | $ | 3,670,257 |
| | $ | 3,629,952 |
|
See accompanying notes to consolidated financial statements.
Corporate Office Properties Trust and Subsidiaries
Consolidated Statements of Operations
(in thousands, except per share data)
|
| | | | | | | | | | | |
| For the Years Ended December 31, |
| 2014 | | 2013 | | 2012 |
Revenues | | | | | |
Rental revenue | $ | 386,396 |
| | $ | 377,611 |
| | $ | 353,080 |
|
Tenant recoveries and other real estate operations revenue | 93,329 |
| | 83,386 |
| | 81,219 |
|
Construction contract and other service revenues | 106,748 |
| | 62,363 |
| | 73,836 |
|
Total revenues | 586,473 |
| | 523,360 |
| | 508,135 |
|
Expenses | |
| | |
| | |
Property operating expenses | 179,934 |
| | 167,199 |
| | 159,206 |
|
Depreciation and amortization associated with real estate operations | 136,086 |
| | 113,214 |
| | 107,998 |
|
Construction contract and other service expenses | 100,058 |
| | 58,875 |
| | 70,576 |
|
Impairment losses | 1,416 |
| | 5,857 |
| | 43,678 |
|
General, administrative and leasing expenses | 31,794 |
| | 30,869 |
| | 31,900 |
|
Business development expenses and land carry costs | 5,573 |
| | 5,436 |
| | 5,711 |
|
Total operating expenses | 454,861 |
| | 381,450 |
| | 419,069 |
|
Operating income | 131,612 |
| | 141,910 |
| | 89,066 |
|
Interest expense | (92,393 | ) | | (82,010 | ) | | (86,401 | ) |
Interest and other income | 4,923 |
| | 3,834 |
| | 7,172 |
|
Loss on early extinguishment of debt | (9,552 | ) | | (27,030 | ) | | (943 | ) |
Income from continuing operations before equity in income (loss) of unconsolidated entities and income taxes | 34,590 |
| | 36,704 |
| | 8,894 |
|
Equity in income (loss) of unconsolidated entities | 229 |
| | 2,110 |
| | (546 | ) |
Income tax expense | (310 | ) | | (1,978 | ) | | (381 | ) |
Income from continuing operations | 34,509 |
| | 36,836 |
| | 7,967 |
|
Discontinued operations | 26 |
| | 55,692 |
| | 12,353 |
|
Income before gain on sales of real estate | 34,535 |
| | 92,528 |
| | 20,320 |
|
Gain on sales of real estate, net of income taxes | 10,671 |
| | 9,016 |
| | 21 |
|
Net income | 45,206 |
| | 101,544 |
| | 20,341 |
|
Net (income) loss attributable to noncontrolling interests: | |
| | |
| | |
Common units in COPLP | (1,006 | ) | | (3,283 | ) | | 87 |
|
Preferred units in COPLP | (660 | ) | | (660 | ) | | (660 | ) |
Other consolidated entities | (3,285 | ) | | (3,894 | ) | | 1,209 |
|
Net income attributable to COPT | 40,255 |
| | 93,707 |
| | 20,977 |
|
Preferred share dividends | (15,939 | ) | | (19,971 | ) | | (20,844 | ) |
Issuance costs associated with redeemed preferred shares | (1,769 | ) | | (2,904 | ) | | (1,827 | ) |
Net income (loss) attributable to COPT common shareholders | $ | 22,547 |
| | $ | 70,832 |
| | $ | (1,694 | ) |
Net income attributable to COPT: | |
| | |
| | |
Income from continuing operations | $ | 40,225 |
| | $ | 41,366 |
| | $ | 9,297 |
|
Discontinued operations, net | 30 |
| | 52,341 |
| | 11,680 |
|
Net income attributable to COPT | $ | 40,255 |
| | $ | 93,707 |
| | $ | 20,977 |
|
Basic earnings per common share (1) | |
| | |
| | |
Income (loss) from continuing operations | $ | 0.25 |
| | $ | 0.21 |
| | $ | (0.19 | ) |
Discontinued operations | — |
| | 0.62 |
| | 0.16 |
|
Net income (loss) attributable to COPT common shareholders | $ | 0.25 |
| | $ | 0.83 |
| | $ | (0.03 | ) |
Diluted earnings per common share (1) | | | | | |
Income (loss) from continuing operations | $ | 0.25 |
| | $ | 0.21 |
| | $ | (0.19 | ) |
Discontinued operations | — |
| | 0.62 |
| | 0.16 |
|
Net income (loss) attributable to COPT common shareholders | $ | 0.25 |
| | $ | 0.83 |
| | $ | (0.03 | ) |
(1) Basic and diluted earnings per common share are calculated based on amounts attributable to common shareholders of Corporate Office Properties Trust.
See accompanying notes to consolidated financial statements.
Corporate Office Properties Trust and Subsidiaries
Consolidated Statements of Comprehensive Income/Loss
(in thousands)
|
| | | | | | | | | | | | |
| | For the Years Ended December 31, |
| | 2014 | | 2013 | | 2012 |
Net income | | $ | 45,206 |
| | $ | 101,544 |
| | $ | 20,341 |
|
Other comprehensive (loss) income | | |
| | |
| | |
Unrealized (losses) gains on interest rate derivatives | | (7,799 | ) | | 6,791 |
| | (7,676 | ) |
Losses on interest rate derivatives included in interest expense | | 2,990 |
| | 2,740 |
| | 3,697 |
|
Losses on interest rate derivatives included in loss on early extinguishment of debt | | 38 |
| | — |
| | — |
|
Unrealized equity in other comprehensive income of equity method investee | | — |
| | 1,070 |
| | — |
|
Realized equity in other comprehensive income of equity method investee | | — |
| | (1,070 | ) | | — |
|
Other comprehensive (loss) income | | (4,771 | ) | | 9,531 |
| | (3,979 | ) |
Comprehensive income | | 40,435 |
| | 111,075 |
| | 16,362 |
|
Comprehensive (income) loss attributable to noncontrolling interests | | (4,957 | ) | | (8,453 | ) | | 961 |
|
Comprehensive income attributable to COPT | | $ | 35,478 |
| | $ | 102,622 |
| | $ | 17,323 |
|
See accompanying notes to consolidated financial statements.
Corporate Office Properties Trust and Subsidiaries
Consolidated Statements of Equity
(Dollars in thousands) |
| | | | | | | | | | | | | | | | | | | | | | | | | | | |
| Preferred Shares | | Common Shares | | Additional Paid-in Capital | | Cumulative Distributions in Excess of Net Income | | Accumulated Other Comprehensive Loss | | Noncontrolling Interests | | Total |
Balance at December 31, 2011 (72,011,324 common shares outstanding) | $ | 216,333 |
| | $ | 720 |
| | $ | 1,451,078 |
| | $ | (534,041 | ) | | $ | (1,733 | ) | | $ | 73,542 |
| | $ | 1,205,899 |
|
Conversion of common units to common shares (234,246 shares) | — |
| | 2 |
| | 2,812 |
| | — |
| | — |
| | (2,814 | ) | | — |
|
Preferred shares issued to the public (6,900,000 shares) | 172,500 |
| | — |
| | (6,848 | ) | | — |
| | — |
| | — |
| | 165,652 |
|
Common shares issued to the public (8,625,000 shares) | — |
| | 86 |
| | 204,610 |
| | — |
| | — |
| | — |
| | 204,696 |
|
Redemption of preferred shares (2,200,000 shares) | (55,000 | ) | | — |
| | 1,827 |
| | (1,827 | ) | | — |
| | — |
| | (55,000 | ) |
Exercise of share options (61,624 shares) | — |
| | — |
| | 928 |
| | — |
| | — |
| | — |
| | 928 |
|
Share-based compensation | — |
| | 1 |
| | 11,183 |
| | — |
| | — |
| | — |
| | 11,184 |
|
Restricted common share redemptions (139,851 shares) | — |
| | — |
| | (3,379 | ) | | — |
| | — |
| | — |
| | (3,379 | ) |
Adjustments to noncontrolling interests resulting from changes in ownership of COPLP | — |
| | — |
| | (4,627 | ) | | — |
| | — |
| | 4,627 |
| | — |
|
Comprehensive income | — |
| | — |
| | — |
| | 20,977 |
| | (3,702 | ) | | 1,652 |
| | 18,927 |
|
Dividends | — |
| | — |
| | — |
| | (102,564 | ) | | — |
| | — |
| | (102,564 | ) |
Distributions to owners of common and preferred units in COPLP | — |
| | — |
| | — |
| | — |
| | — |
| | (5,277 | ) | | (5,277 | ) |
Distributions to noncontrolling interest in other consolidated entities | — |
| | — |
| | — |
| | — |
| | — |
| | (655 | ) | | (655 | ) |
Adjustment to arrive at fair value of redeemable noncontrolling interest | — |
| | — |
| | (3,955 | ) | | — |
| | — |
| | — |
| | (3,955 | ) |
Tax benefit from share-based compensation | — |
| | — |
| | 43 |
| | — |
| | — |
| | — |
| | 43 |
|
Balance at December 31, 2012 (80,952,986 common shares outstanding) | 333,833 |
| | 809 |
| | 1,653,672 |
| | (617,455 | ) | | (5,435 | ) | | 71,075 |
| | 1,436,499 |
|
Redemption of preferred shares (3,390,000 shares) | (84,750 | ) | | — |
| | 2,904 |
| | (2,904 | ) | | — |
| | — |
| | (84,750 | ) |
Conversion of common units to common shares (311,343 shares) | — |
| | 3 |
| | 3,994 |
| | — |
| | — |
| | (3,997 | ) | | — |
|
Common shares issued to the public (4,485,000 shares) | — |
| | 45 |
| | 117,916 |
| | — |
| | — |
| | — |
| | 117,961 |
|
Common shares issued under at-the-market program (1,500,000 shares) | — |
| | 15 |
| | 38,432 |
| | — |
| | — |
| | — |
| | 38,447 |
|
Acquisition of property and noncontrolling interest in other consolidated entity for COPLP common units | — |
| | — |
| | (1,296 | ) | | — |
| | — |
| | 2,665 |
| | 1,369 |
|
Exercise of share options (39,331 shares) | — |
| | — |
| | 779 |
| | — |
| | — |
| | — |
| | 779 |
|
Share-based compensation | — |
| | 2 |
| | 7,603 |
| | — |
| | — |
| | — |
| | 7,605 |
|
Restricted common share redemptions (78,440 shares) | — |
| | — |
| | (2,002 | ) | | — |
| | — |
| | — |
| | (2,002 | ) |
Adjustments to noncontrolling interests resulting from changes in ownership of COPLP | — |
| | — |
| | (744 | ) | | — |
| | — |
| | 744 |
| | — |
|
Comprehensive income | — |
| | — |
| | — |
| | 93,707 |
| | 8,915 |
| | 7,077 |
| | 109,699 |
|
Dividends | — |
| | — |
| | — |
| | (115,216 | ) | | — |
| | — |
| | (115,216 | ) |
Distributions to owners of common and preferred units in COPLP | — |
| | — |
| | — |
| | — |
| | — |
| | (4,940 | ) | | (4,940 | ) |
Contributions from noncontrolling interests in other consolidated entities | — |
| | — |
| | — |
| | — |
| | — |
| | 86 |
| | 86 |
|
Distributions to noncontrolling interests in other consolidated entities | — |
| | — |
| | — |
| | — |
| | — |
| | (1,045 | ) | | (1,045 | ) |
Adjustment to arrive at fair value of redeemable noncontrolling interest | — |
| | — |
| | (7,121 | ) | | — |
| | — |
| | — |
| | (7,121 | ) |
Tax loss from share-based compensation | — |
| | — |
| | (122 | ) | | — |
| | — |
| | — |
| | (122 | ) |
Balance at December 31, 2013 (87,394,512 common shares outstanding) | 249,083 |
| | 874 |
| | 1,814,015 |
| | (641,868 | ) | | 3,480 |
| | 71,665 |
| | 1,497,249 |
|
Redemption of preferred shares (2,000,000 shares) | (50,000 | ) | | — |
| | 1,769 |
| | (1,769 | ) | | — |
| | — |
| | (50,000 | ) |
Conversion of common units to common shares (140,149 shares) | — |
| | 2 |
| | 1,841 |
| | — |
| | — |
| | (1,843 | ) | | — |
|
Common shares issued to the public (5,520,000 shares) | — |
| | 55 |
| | 148,611 |
| | — |
| | — |
| | — |
| | 148,666 |
|
Exercise of share options (62,888 shares) | — |
| | — |
| | 1,489 |
| | — |
| | — |
| | — |
| | 1,489 |
|
Share-based compensation | — |
| | 2 |
| | 7,048 |
| | — |
| | — |
| | — |
| | 7,050 |
|
Restricted common share redemptions (57,537 shares) | — |
| | — |
| | (1,554 | ) | | — |
| | — |
| | — |
| | (1,554 | ) |
Adjustments to noncontrolling interests resulting from changes in ownership of COPLP | — |
| | — |
| | (3,382 | ) | | — |
| | — |
| | 3,382 |
| | — |
|
Comprehensive income | — |
| | — |
| | — |
| | 40,255 |
| | (4,777 | ) | | 2,796 |
| | 38,274 |
|
Dividends | — |
| | — |
| | — |
| | (113,882 | ) | | — |
| | — |
| | (113,882 | ) |
Distributions to owners of common and preferred units in COPLP | — |
| | — |
| | — |
| | — |
| | — |
| | (4,929 | ) | | (4,929 | ) |
Contributions from noncontrolling interests in other consolidated entities | — |
| | — |
| | — |
| | — |
| | — |
| | 3 |
| | 3 |
|
Distributions to noncontrolling interests in other consolidated entities | — |
| | — |
| | — |
| | — |
| | — |
| | (1,613 | ) | | (1,613 | ) |
Adjustment to arrive at fair value of redeemable noncontrolling interest | — |
| | — |
| | 134 |
| | — |
| | — |
| | — |
| | 134 |
|
Tax loss from share-based compensation | — |
| | — |
| | (3 | ) | | — |
| | — |
| | — |
| | (3 | ) |
Balance at December 31, 2014 (93,255,284 common shares outstanding) | $ | 199,083 |
| | $ | 933 |
| | $ | 1,969,968 |
| | $ | (717,264 | ) | | $ | (1,297 | ) | | $ | 69,461 |
| | $ | 1,520,884 |
|
See accompanying notes to consolidated financial statements.
Corporate Office Properties Trust and Subsidiaries
Consolidated Statements of Cash Flows
(in thousands)
|
| | | | | | | | | | | |
| For the Years Ended December 31, |
| 2014 | | 2013 | | 2012 |
Cash flows from operating activities | |
| | |
| | |
Revenues from real estate operations received | $ | 479,605 |
| | $ | 482,763 |
| | $ | 483,421 |
|
Construction contract and other service revenues received | 89,180 |
| | 63,647 |
| | 77,831 |
|
Property operating expenses paid | (178,803 | ) | | (176,243 | ) | | (174,683 | ) |
Construction contract and other service expenses paid | (79,271 | ) | | (63,853 | ) | | (67,952 | ) |
General, administrative, leasing, business development and land carry costs paid | (29,521 | ) | | (28,022 | ) | | (22,904 | ) |
Interest expense paid | (79,095 | ) | | (81,575 | ) | | (87,394 | ) |
Previously accreted interest expense paid | — |
| | (11,116 | ) | | — |
|
Settlement of interest rate derivatives | — |
| | — |
| | (29,738 | ) |
Proceeds from sale of trading marketable securities | — |
| | 298 |
| | 18,975 |
|
Exit costs on property dispositions | — |
| | (979 | ) | | (4,146 | ) |
Payments in connection with early extinguishment of debt | (9,017 | ) | | (27,909 | ) | | (2,637 | ) |
Interest and other income received | 607 |
| | 1,962 |
| | 1,073 |
|
Income taxes refunded (paid) | 200 |
| | 6 |
| | (8 | ) |
Net cash provided by operating activities | 193,885 |
| | 158,979 |
| | 191,838 |
|
Cash flows from investing activities | |
| | |
| | |
Construction, development and redevelopment | (200,385 | ) | | (201,808 | ) | | (165,275 | ) |
Tenant improvements on operating properties | (27,037 | ) | | (21,950 | ) | | (27,103 | ) |
Other capital improvements on operating properties | (28,720 | ) | | (23,940 | ) | | (20,066 | ) |
Acquisitions of operating properties | — |
| | — |
| | (48,308 | ) |
Proceeds from dispositions of properties | 57,782 |
| | 148,569 |
| | 290,603 |
|
Investing receivables funded | (3,731 | ) | | (14,077 | ) | | (14,232 | ) |
Investing receivables payments received | 10,279 |
| | 144 |
| | 10,113 |
|
Leasing costs paid | (16,234 | ) | | (14,429 | ) | | (13,278 | ) |
Decrease (increase) in restricted cash associated with investing activities | 1,137 |
| | 8,178 |
| | (872 | ) |
Other | (2,780 | ) | | (477 | ) | | 2,162 |
|
Net cash (used in) provided by investing activities | (209,689 | ) | | (119,790 | ) | | 13,744 |
|
Cash flows from financing activities | |
| | |
| | |
Proceeds from debt | | | | | |
Revolving Credit Facility | 232,000 |
| | 504,000 |
| | 329,000 |
|
Unsecured senior notes | 297,342 |
| | 592,413 |
| | — |
|
Other debt proceeds | 11,569 |
| | 94,049 |
| | 403,117 |
|
Repayments of debt | | | | | |
Revolving Credit Facility | (149,000 | ) | | (504,000 | ) | | (991,000 | ) |
Scheduled principal amortization | (6,517 | ) | | (9,481 | ) | | (11,684 | ) |
Other debt repayments | (394,653 | ) | | (612,093 | ) | | (124,386 | ) |
Deferred financing costs paid | (708 | ) | | (9,361 | ) | | (3,371 | ) |
Net proceeds from issuance of preferred shares | — |
| | — |
| | 165,652 |
|
Net proceeds from issuance of common shares | 150,174 |
| | 157,444 |
| | 205,425 |
|
Redemption of preferred shares | (50,000 | ) | | (84,750 | ) | | (55,000 | ) |
Common share dividends paid | (96,330 | ) | | (93,474 | ) | | (89,161 | ) |
Preferred share dividends paid | (16,731 | ) | | (21,335 | ) | | (19,087 | ) |
Distributions paid to noncontrolling interests in COPLP | (5,008 | ) | | (4,958 | ) | | (5,828 | ) |
Restricted share redemptions | (1,554 | ) | | (2,002 | ) | | (3,379 | ) |
Other | (3,076 | ) | | (1,862 | ) | | (845 | ) |
Net cash (used in) provided by financing activities | (32,492 | ) | | 4,590 |
| | (200,547 | ) |
Net (decrease) increase in cash and cash equivalents | (48,296 | ) | | 43,779 |
| | 5,035 |
|
Cash and cash equivalents | |
| | |
| | |
Beginning of period | 54,373 |
| | 10,594 |
| | 5,559 |
|
End of period | $ | 6,077 |
| | $ | 54,373 |
| | $ | 10,594 |
|
See accompanying notes to consolidated financial statements.
Corporate Office Properties Trust and Subsidiaries
Consolidated Statements of Cash Flows (continued)
(in thousands)
|
| | | | | | | | | | | |
| For the Years Ended December 31, |
| 2014 | | 2013 | | 2012 |
Reconciliation of net income to net cash provided by operating activities: | |
| | |
| | |
Net income | $ | 45,206 |
| | $ | 101,544 |
| | $ | 20,341 |
|
Adjustments to reconcile net income to net cash provided by operating activities: | |
| | |
| | |
Depreciation and other amortization | 138,490 |
| | 119,773 |
| | 124,418 |
|
Impairment losses | 1,419 |
| | 31,068 |
| | 62,702 |
|
Settlement of previously accreted interest expense | — |
| | (11,116 | ) | | — |
|
Amortization of deferred financing costs | 4,666 |
| | 5,451 |
| | 6,243 |
|
Increase in deferred rent receivable | (3,520 | ) | | (5,196 | ) | | (11,776 | ) |
Amortization of net debt discounts | 921 |
| | 1,159 |
| | 3,155 |
|
Gain on sales of real estate | (10,695 | ) | | (11,687 | ) | | (20,961 | ) |
Share-based compensation | 6,164 |
| | 6,530 |
| | 9,982 |
|
Loss (gain) on early extinguishment of debt | 651 |
| | (68,689 | ) | | (3,430 | ) |
Other | (3,242 | ) | | (3,093 | ) | | (4,551 | ) |
Changes in operating assets and liabilities: | |
| | | | |
Decrease (increase) in accounts receivable | 94 |
| | (10,334 | ) | | 8,049 |
|
Decrease in restricted cash and marketable securities | 1,352 |
| | 576 |
| | 14,934 |
|
(Increase) decrease in prepaid expenses and other assets | (12,231 | ) | | (5,128 | ) | | 8,550 |
|
Increase in accounts payable, accrued expenses and other liabilities | 25,091 |
| | 3,960 |
| | 4,101 |
|
(Decrease) increase in rents received in advance and security deposits | (481 | ) | | 4,161 |
| | (1,916 | ) |
Decrease in interest rate derivatives in connection with cash settlement | — |
| | — |
| | (28,003 | ) |
Net cash provided by operating activities | $ | 193,885 |
| | $ | 158,979 |
| | $ | 191,838 |
|
Supplemental schedule of non-cash investing and financing activities: | |
| | |
| | |
(Decrease) increase in accrued capital improvements, leasing and other investing activity costs | $ | (3,779 | ) | | $ | 2,947 |
| | $ | (1,227 | ) |
Decrease in property in connection with transfer of property in settlement of debt | $ | — |
| | $ | 73,780 |
| | $ | 12,042 |
|
Decrease in debt in connection with transfer of property in settlement of debt | $ | — |
| | $ | 146,500 |
| | $ | 16,304 |
|
(Decrease) increase in fair value of derivatives applied to accumulated other comprehensive income (loss) and noncontrolling interests | $ | (4,866 | ) | | $ | 9,470 |
| | $ | 4,040 |
|
Dividends/distribution payable | $ | 29,862 |
| | $ | 29,080 |
| | $ | 28,698 |
|
COPLP common units issued to acquire property and noncontrolling interest in other consolidated entity | $ | — |
| | $ | 5,194 |
| | $ | — |
|
Decrease in noncontrolling interests and increase in shareholders’ equity in connection with the conversion of common units into common shares | $ | 1,843 |
| | $ | 3,997 |
| | $ | 2,814 |
|
Adjustments to noncontrolling interests resulting from changes in COPLP ownership | $ | 3,382 |
| | $ | 744 |
| | $ | 4,627 |
|
(Decrease) increase in redeemable noncontrolling interest and (increase) decrease in equity to carry redeemable noncontrolling interest at fair value | $ | (134 | ) | | $ | 7,121 |
| | $ | 3,955 |
|
See accompanying notes to consolidated financial statements.
Corporate Office Properties, L.P. and Subsidiaries
Consolidated Balance Sheets
(in thousands, except unit data)
|
| | | | | | | |
| December 31, |
| 2014 | | 2013 |
Assets | |
| | |
|
Properties, net: | |
| | |
|
Operating properties, net | $ | 2,751,488 |
| | $ | 2,702,693 |
|
Projects in development or held for future development | 545,426 |
| | 511,608 |
|
Total properties, net | 3,296,914 |
| | 3,214,301 |
|
Assets held for sale, net | 14,339 |
| | — |
|
Cash and cash equivalents | 6,077 |
| | 54,373 |
|
Restricted cash and marketable securities | 3,187 |
| | 3,981 |
|
Accounts receivable (net of allowance for doubtful accounts of $717 and $2,976, respectively) | 26,901 |
| | 27,000 |
|
Deferred rent receivable (net of allowance of $1,418 and $2,126, respectively) | 95,910 |
| | 89,456 |
|
Intangible assets on real estate acquisitions, net | 43,854 |
| | 59,258 |
|
Deferred leasing and financing costs, net | 64,797 |
| | 66,267 |
|
Investing receivables | 52,147 |
| | 53,663 |
|
Prepaid expenses and other assets | 60,249 |
| | 54,186 |
|
Total assets | $ | 3,664,375 |
| | $ | 3,622,485 |
|
Liabilities and equity | |
| | |
|
Liabilities: | |
| | |
|
Debt, net | $ | 1,920,057 |
| | $ | 1,927,703 |
|
Accounts payable and accrued expenses | 123,035 |
| | 98,785 |
|
Rents received in advance and security deposits | 31,011 |
| | 31,492 |
|
Distributions payable | 29,862 |
| | 29,080 |
|
Deferred revenue associated with operating leases | 13,031 |
| | 10,369 |
|
Interest rate derivatives | 1,855 |
| | 3,309 |
|
Other liabilities | 6,223 |
| | 6,740 |
|
Total liabilities | 2,125,074 |
| | 2,107,478 |
|
Commitments and contingencies (Note 23) |
|
| |
|
|
Redeemable noncontrolling interest | 18,417 |
| | 17,758 |
|
Equity: | |
| | |
|
Corporate Office Properties, L.P.’s equity: | |
| | |
|
Preferred units | | | |
General partner, preferred units outstanding of 7,431,667 at December 31, 2014 and 9,431,667 at December 31, 2013 | 199,083 |
| | 249,083 |
|
Limited partner, 352,000 preferred units outstanding at December 31, 2014 and 2013 | 8,800 |
| | 8,800 |
|
Common units, 93,255,284 and 87,394,512 held by the general partner and 3,837,551 and 3,977,700 held by limited partners at December 31, 2014 and 2013, respectively | 1,305,219 |
| | 1,226,318 |
|
Accumulated other comprehensive (loss) income | (1,381 | ) | | 3,605 |
|
Total Corporate Office Properties, L.P.’s equity | 1,511,721 |
| | 1,487,806 |
|
Noncontrolling interests in subsidiaries | 9,163 |
| | 9,443 |
|
Total equity | 1,520,884 |
| | 1,497,249 |
|
Total liabilities, redeemable noncontrolling interest and equity | $ | 3,664,375 |
| | $ | 3,622,485 |
|
See accompanying notes to consolidated financial statements.
Corporate Office Properties, L.P. and Subsidiaries
Consolidated Statements of Operations
(in thousands, except per unit data) |
| | | | | | | | | | | |
| For the Years Ended December 31, |
| 2014 | | 2013 | | 2012 |
Revenues | | | | | |
Rental revenue | $ | 386,396 |
| | $ | 377,611 |
| | $ | 353,080 |
|
Tenant recoveries and other real estate operations revenue | 93,329 |
| | 83,386 |
| | 81,219 |
|
Construction contract and other service revenues | 106,748 |
| | 62,363 |
| | 73,836 |
|
Total revenues | 586,473 |
| | 523,360 |
| | 508,135 |
|
Expenses | |
| | |
| | |
Property operating expenses | 179,934 |
| | 167,199 |
| | 159,206 |
|
Depreciation and amortization associated with real estate operations | 136,086 |
| | 113,214 |
| | 107,998 |
|
Construction contract and other service expenses | 100,058 |
| | 58,875 |
| | 70,576 |
|
Impairment losses | 1,416 |
| | 5,857 |
| | 43,678 |
|
General, administrative and leasing expenses | 31,794 |
| | 30,869 |
| | 31,900 |
|
Business development expenses and land carry costs | 5,573 |
| | 5,436 |
| | 5,711 |
|
Total operating expenses | 454,861 |
| | 381,450 |
| | 419,069 |
|
Operating income | 131,612 |
| | 141,910 |
| | 89,066 |
|
Interest expense | (92,393 | ) | | (82,010 | ) | | (86,401 | ) |
Interest and other income | 4,923 |
| | 3,834 |
| | 7,172 |
|
Loss on early extinguishment of debt | (9,552 | ) | | (27,030 | ) | | (943 | ) |
Income from continuing operations before equity in income (loss) of unconsolidated entities and income taxes | 34,590 |
| | 36,704 |
| | 8,894 |
|
Equity in income (loss) of unconsolidated entities | 229 |
| | 2,110 |
| | (546 | ) |
Income tax expense | (310 | ) | | (1,978 | ) | | (381 | ) |
Income from continuing operations | 34,509 |
| | 36,836 |
| | 7,967 |
|
Discontinued operations | 26 |
| | 55,692 |
| | 12,353 |
|
Income before gain on sales of real estate | 34,535 |
| | 92,528 |
| | 20,320 |
|
Gain on sales of real estate, net of income taxes | 10,671 |
| | 9,016 |
| | 21 |
|
Net income | 45,206 |
| | 101,544 |
| | 20,341 |
|
Net (income) loss attributable to noncontrolling interests in consolidated entities | (3,276 | ) | | (3,907 | ) | | 507 |
|
Net income attributable to COPLP | 41,930 |
| | 97,637 |
| | 20,848 |
|
Preferred unit distributions | (16,599 | ) | | (20,631 | ) | | (21,504 | ) |
Issuance costs associated with redeemed preferred units | (1,769 | ) | | (2,904 | ) | | (1,827 | ) |
Net income (loss) attributable to COPLP common unitholders | $ | 23,562 |
| | $ | 74,102 |
| | $ | (2,483 | ) |
Net income attributable to COPLP: | |
| | |
| | |
Income from continuing operations | $ | 41,899 |
| | $ | 42,875 |
| | $ | 9,194 |
|
Discontinued operations, net | 31 |
| | 54,762 |
| | 11,654 |
|
Net income attributable to COPLP | $ | 41,930 |
| | $ | 97,637 |
| | $ | 20,848 |
|
Basic earnings per common unit (1) | |
| | |
| | |
Income (loss) from continuing operations | $ | 0.25 |
| | $ | 0.21 |
| | $ | (0.19 | ) |
Discontinued operations | — |
| | 0.62 |
| | 0.15 |
|
Net income (loss) attributable to COPLP common unitholders | $ | 0.25 |
| | $ | 0.83 |
| | $ | (0.04 | ) |
Diluted earnings per common unit (1) | | | | | |
Income (loss) from continuing operations | $ | 0.25 |
| | $ | 0.21 |
| | $ | (0.19 | ) |
Discontinued operations | — |
| | 0.62 |
| | 0.15 |
|
Net income (loss) attributable to COPLP common unitholders | $ | 0.25 |
| | $ | 0.83 |
| | $ | (0.04 | ) |
(1) Basic and diluted earnings per common unit are calculated based on amounts attributable to common unitholders of Corporate Office Properties, L.P.
See accompanying notes to consolidated financial statements.
Corporate Office Properties, L.P. and Subsidiaries
Consolidated Statements of Comprehensive Income/Loss
(in thousands)
|
| | | | | | | | | | | | |
| | For the Years Ended December 31, |
| | 2014 | | 2013 | | 2012 |
Net income | | $ | 45,206 |
| | $ | 101,544 |
| | $ | 20,341 |
|
Other comprehensive (loss) income | | | | | | |
Unrealized (losses) gains on interest rate derivatives | | (7,799 | ) | | 6,791 |
| | (7,676 | ) |
Losses on interest rate derivatives included in interest expense | | 2,990 |
| | 2,740 |
| | 3,697 |
|
Losses on interest rate derivatives included in loss on early extinguishment of debt | | 38 |
| | — |
| | — |
|
Unrealized equity in other comprehensive income of equity method investee | | — |
| | 1,070 |
| | — |
|
Realized equity in other comprehensive income of equity method investee | | — |
| | (1,070 | ) | | — |
|
Other comprehensive (loss) income | | (4,771 | ) | | 9,531 |
| | (3,979 | ) |
Comprehensive income | | 40,435 |
| | 111,075 |
| | 16,362 |
|
Comprehensive (income) loss attributable to noncontrolling interests | | (3,492 | ) | | (4,125 | ) | | 615 |
|
Comprehensive income attributable to COPLP | | $ | 36,943 |
| | $ | 106,950 |
| | $ | 16,977 |
|
See accompanying notes to consolidated financial statements.
Corporate Office Properties, L.P. and Subsidiaries
Consolidated Statements of Equity
(Dollars in thousands) |
| | | | | | | | | | | | | | | | | | | | | | | | | | | | | | | | |
| Limited Partner Preferred Units | | General Partner Preferred Units | | Common Units | | Accumulated Other Comprehensive Income (Loss) | | Noncontrolling Interests in Subsidiaries | | Total Equity |
| Units | | Amount | | Units | | Amount | | Units | | Amount | | | |
Balance at December 31, 2011 | 352,000 |
| | $ | 8,800 |
| | 8,121,667 |
| | $ | 216,333 |
| | 76,313,112 |
| | $ | 972,107 |
| | $ | (1,837 | ) | | $ | 10,496 |
| | $ | 1,205,899 |
|
Issuance of preferred units resulting from public issuance of preferred shares | — |
| | — |
| | 6,900,000 |
| | 172,500 |
| | — |
| | (6,848 | ) | | — |
| | — |
| | 165,652 |
|
Redemption of preferred units resulting from redemption of preferred shares | — |
| | — |
| | (2,200,000 | ) | | (55,000 | ) | | — |
| | — |
| | — |
| | — |
| | (55,000 | ) |
Issuance of common units resulting from public issuance of common shares | — |
| | — |
| | — |
| | — |
| | 8,625,000 |
| | 204,696 |
| | — |
| | — |
| | 204,696 |
|
Issuance of common units resulting from exercise of share options | — |
| | — |
| | — |
| | — |
| | 61,624 |
| | 928 |
| | — |
| | — |
| | 928 |
|
Share-based compensation | — |
| | — |
| | — |
| | — |
| | 160,643 |
| | 11,184 |
| | — |
| | — |
| | 11,184 |
|
Restricted common unit redemptions | — |
| | — |
| | — |
| | — |
| | (139,851 | ) | | (3,379 | ) | | — |
| | — |
| | (3,379 | ) |
Comprehensive loss | — |
| | 660 |
| | — |
| | 20,844 |
| | — |
| | (656 | ) | | (3,871 | ) | | 1,950 |
| | 18,927 |
|
Distributions to owners of common and preferred units | — |
| | (660 | ) | | — |
| | (20,844 | ) | | — |
| | (86,337 | ) | | — |
| | — |
| | (107,841 | ) |
Distributions to noncontrolling interests in subsidiaries | — |
| | — |
| | — |
| | — |
| | — |
| | — |
| | — |
| | (655 | ) | | (655 | ) |
COPT contribution to COPLP of distribution from subsidiary | — |
| | — |
| | — |
| | — |
| | — |
| | 1,608 |
| | — |
| | (1,608 | ) | | — |
|
Adjustment to arrive at fair value of redeemable noncontrolling interest | — |
| | — |
| | — |
| | — |
| | — |
| | (3,955 | ) | | — |
| | — |
| | (3,955 | ) |
Tax benefit from share-based compensation | — |
| | — |
| | — |
| | — |
| | — |
| | 43 |
| | — |
| | — |
| | 43 |
|
Balance at December 31, 2012 | 352,000 |
| | 8,800 |
| | 12,821,667 |
| | 333,833 |
| | 85,020,528 |
| | 1,089,391 |
| | (5,708 | ) | | 10,183 |
| | 1,436,499 |
|
Redemption of preferred units resulting from redemption of preferred shares | — |
| | — |
| | (3,390,000 | ) | | (84,750 | ) | | — |
| | — |
| | — |
| | — |
| | (84,750 | ) |
Issuance of common units resulting from public issuance of common shares | — |
| | — |
| | — |
| | — |
| | 4,485,000 |
| | 117,961 |
| | — |
| | — |
| | 117,961 |
|
Issuance of common units resulting from common shares issued under COPT at-the-market program | — |
| | — |
| | — |
| | — |
| | 1,500,000 |
| | 38,447 |
| | — |
| | — |
| | 38,447 |
|
Acquisition of property and noncontrolling interest in subsidiary for COPLP common units | — |
| | — |
| | — |
| | — |
| | 221,501 |
| | 3,899 |
| | — |
| | (2,530 | ) | | 1,369 |
|
Issuance of common units resulting from exercise of share options | — |
| | — |
| | — |
| | — |
| | 39,331 |
| | 779 |
| | — |
| | — |
| | 779 |
|
Share-based compensation | — |
| | — |
| | — |
| | — |
| | 184,292 |
| | 7,605 |
| | — |
| | — |
| | 7,605 |
|
Restricted common unit redemptions | — |
| | — |
| | — |
| | — |
| | (78,440 | ) | | (2,002 | ) | | — |
| | — |
| | (2,002 | ) |
Comprehensive income | — |
| | 660 |
| | — |
| | 19,971 |
| | — |
| | 77,006 |
| | 9,313 |
| | 2,749 |
| | 109,699 |
|
Distributions to owners of common and preferred units | — |
| | (660 | ) | | — |
| | (19,971 | ) | | — |
| | (99,525 | ) | | — |
| | — |
| | (120,156 | ) |
Contributions from noncontrolling interests in subsidiaries | — |
| | — |
| | — |
| | — |
| | — |
| | — |
| | — |
| | 86 |
| | 86 |
|
Distributions to noncontrolling interests in subsidiaries | — |
| | — |
| | — |
| | — |
| | — |
| | — |
| | — |
| | (1,045 | ) | | (1,045 | ) |
Adjustment to arrive at fair value of redeemable noncontrolling interest | — |
| | — |
| | — |
| | — |
| | — |
| | (7,121 | ) | | — |
| | — |
| | (7,121 | ) |
Tax loss from share-based compensation | — |
| | — |
| | — |
| | — |
| | — |
| | (122 | ) | | — |
| | — |
| | (122 | ) |
Balance at December 31, 2013 | 352,000 |
| | 8,800 |
| | 9,431,667 |
| | 249,083 |
| | 91,372,212 |
| | 1,226,318 |
| | 3,605 |
| | 9,443 |
| | 1,497,249 |
|
Redemption of preferred units resulting from redemption of preferred shares | — |
| | — |
| | (2,000,000 | ) | | (50,000 | ) | | — |
| | — |
| | — |
| | — |
| | (50,000 | ) |
Issuance of common units resulting from public issuance of common shares | — |
| | — |
| | — |
| | — |
| | 5,520,000 |
| | 148,666 |
| | — |
| | — |
| | 148,666 |
|
Issuance of common units resulting from exercise of share options | — |
| | — |
| | — |
| | — |
| | 62,888 |
| | 1,489 |
| | — |
| | — |
| | 1,489 |
|
Share-based compensation | — |
| | — |
| | — |
| | — |
| | 195,272 |
| | 7,050 |
| | — |
| | — |
| | 7,050 |
|
Restricted common unit redemptions | — |
| | — |
| | — |
| | — |
| | (57,537 | ) | | (1,554 | ) | | — |
| | — |
| | (1,554 | ) |
Comprehensive income | — |
| | 660 |
| | — |
| | 15,939 |
| | — |
| | 25,331 |
| | (4,986 | ) | | 1,330 |
| | 38,274 |
|
Distributions to owners of common and preferred units | — |
| | (660 | ) | | — |
| | (15,939 | ) | | — |
| | (102,212 | ) | | — |
| | — |
| | (118,811 | ) |
Contributions from noncontrolling interests in subsidiaries | — |
| | — |
| | — |
| | — |
| | — |
| | — |
| | — |
| | 3 |
| | 3 |
|
Distributions to noncontrolling interests in subsidiaries | — |
| | — |
| | — |
| | — |
| | — |
| | — |
| | — |
| | (1,613 | ) | | (1,613 | ) |
Adjustment to arrive at fair value of redeemable noncontrolling interest | — |
| | — |
| | — |
| | — |
| | — |
| | 134 |
| | — |
| | — |
| | 134 |
|
Tax loss from share-based compensation | — |
| | — |
| | — |
| | — |
| | — |
| | (3 | ) | | — |
| | — |
| | (3 | ) |
Balance at December 31, 2014 | 352,000 |
| | $ | 8,800 |
| | 7,431,667 |
| | $ | 199,083 |
| | 97,092,835 |
| | $ | 1,305,219 |
| | $ | (1,381 | ) | | $ | 9,163 |
| | $ | 1,520,884 |
|
Corporate Office Properties, L.P. and Subsidiaries
Consolidated Statements of Cash Flows
(in thousands)
|
| | | | | | | | | | | |
| For the Years Ended December 31, |
| 2014 | | 2013 | | 2012 |
Cash flows from operating activities | |
| | |
| | |
Revenues from real estate operations received | $ | 479,605 |
| | $ | 482,763 |
| | $ | 483,421 |
|
Construction contract and other service revenues received | 89,180 |
| | 63,647 |
| | 77,831 |
|
Property operating expenses paid | (178,803 | ) | | (176,243 | ) | | (174,683 | ) |
Construction contract and other service expenses paid | (79,271 | ) | | (63,853 | ) | | (67,952 | ) |
General, administrative, leasing, business development and land carry costs paid | (29,521 | ) | | (28,022 | ) | | (22,904 | ) |
Interest expense paid | (79,095 | ) | | (81,575 | ) | | (87,394 | ) |
Previously accreted interest expense paid | — |
| | (11,116 | ) | | — |
|
Settlement of interest rate derivatives | — |
| | — |
| | (29,738 | ) |
Proceeds from sale of trading marketable securities | — |
| | 298 |
| | 18,975 |
|
Exit costs on property dispositions | — |
| | (979 | ) | | (4,146 | ) |
Payments in connection with early extinguishment of debt | (9,017 | ) | | (27,909 | ) | | (2,637 | ) |
Interest and other income received | 607 |
| | 1,962 |
| | 1,073 |
|
Income taxes refunded (paid) | 200 |
| | 6 |
| | (8 | ) |
Net cash provided by operating activities | 193,885 |
| | 158,979 |
| | 191,838 |
|
Cash flows from investing activities | |
| | |
| | |
Construction, development and redevelopment | (200,385 | ) | | (201,808 | ) | | (165,275 | ) |
Tenant improvements on operating properties | (27,037 | ) | | (21,950 | ) | | (27,103 | ) |
Other capital improvements on operating properties | (28,720 | ) | | (23,940 | ) | | (20,066 | ) |
Acquisitions of operating properties | — |
| | — |
| | (48,308 | ) |
Proceeds from dispositions of properties | 57,782 |
| | 148,569 |
| | 290,603 |
|
Investing receivables funded | (3,731 | ) | | (14,077 | ) | | (14,232 | ) |
Investing receivables payments received | 10,279 |
| | 144 |
| | 10,113 |
|
Leasing costs paid | (16,234 | ) | | (14,429 | ) | | (13,278 | ) |
Decrease (increase) in restricted cash associated with investing activities | 1,137 |
| | 8,178 |
| | (872 | ) |
Other | (2,780 | ) | | (477 | ) | | 2,162 |
|
Net cash (used in) provided by investing activities | (209,689 | ) | | (119,790 | ) | | 13,744 |
|
Cash flows from financing activities | |
| | |
| | |
Proceeds from debt | | | | | |
Revolving Credit Facility | 232,000 |
| | 504,000 |
| | 329,000 |
|
Unsecured senior notes | 297,342 |
| | 592,413 |
| | — |
|
Other debt proceeds | 11,569 |
| | 94,049 |
| | 403,117 |
|
Repayments of debt | | | | | |
Revolving Credit Facility | (149,000 | ) | | (504,000 | ) | | (991,000 | ) |
Scheduled principal amortization | (6,517 | ) | | (9,481 | ) | | (11,684 | ) |
Other debt repayments | (394,653 | ) | | (612,093 | ) | | (124,386 | ) |
Deferred financing costs paid | (708 | ) | | (9,361 | ) | | (3,371 | ) |
Net proceeds from issuance of preferred units | — |
| | — |
| | 165,652 |
|
Net proceeds from issuance of common units | 150,174 |
| | 157,444 |
| | 205,425 |
|
Redemption of preferred units | (50,000 | ) | | (84,750 | ) | | (55,000 | ) |
Common unit distributions paid | (100,678 | ) | | (97,772 | ) | | (94,329 | ) |
Preferred unit distributions paid | (17,391 | ) | | (21,995 | ) | | (19,747 | ) |
Restricted unit redemptions | (1,554 | ) | | (2,002 | ) | | (3,379 | ) |
Other | (3,076 | ) | | (1,862 | ) | | (845 | ) |
Net cash (used in) provided by financing activities | (32,492 | ) | | 4,590 |
| | (200,547 | ) |
Net (decrease) increase in cash and cash equivalents | (48,296 | ) | | 43,779 |
| | 5,035 |
|
Cash and cash equivalents | |
| | |
| | |
Beginning of period | 54,373 |
| | 10,594 |
| | 5,559 |
|
End of period | $ | 6,077 |
| | $ | 54,373 |
| | $ | 10,594 |
|
See accompanying notes to consolidated financial statements.
Corporate Office Properties, L.P. and Subsidiaries
Consolidated Statements of Cash Flows (Continued)
(in thousands)
|
| | | | | | | | | | | |
| For the Years Ended December 31, |
| 2014 | | 2013 | | 2012 |
Reconciliation of net income to net cash provided by operating activities: | |
| | |
| | |
Net income | $ | 45,206 |
| | $ | 101,544 |
| | $ | 20,341 |
|
Adjustments to reconcile net income to net cash provided by operating activities: | |
| | |
| | |
Depreciation and other amortization | 138,490 |
| | 119,773 |
| | 124,418 |
|
Impairment losses | 1,419 |
| | 31,068 |
| | 62,702 |
|
Settlement of previously accreted interest expense | — |
| | (11,116 | ) | | — |
|
Amortization of deferred financing costs | 4,666 |
| | 5,451 |
| | 6,243 |
|
Increase in deferred rent receivable | (3,520 | ) | | (5,196 | ) | | (11,776 | ) |
Amortization of net debt discounts | 921 |
| | 1,159 |
| | 3,155 |
|
Gain on sales of real estate | (10,695 | ) | | (11,687 | ) | | (20,961 | ) |
Share-based compensation | 6,164 |
| | 6,530 |
| | 9,982 |
|
Loss (gain) on early extinguishment of debt | 651 |
| | (68,689 | ) | | (3,430 | ) |
Other | (3,242 | ) | | (3,093 | ) | | (4,551 | ) |
Changes in operating assets and liabilities: | |
| | | | |
Decrease (increase) in accounts receivable | 94 |
| | (10,334 | ) | | 8,049 |
|
(Increase) decrease in restricted cash and marketable securities | (234 | ) | | 1,267 |
| | 14,122 |
|
(Increase) decrease in prepaid expenses and other assets | (12,231 | ) | | (5,128 | ) | | 8,550 |
|
Increase in accounts payable, accrued expenses and other liabilities | 26,677 |
| | 3,269 |
| | 4,913 |
|
(Decrease) increase in rents received in advance and security deposits | (481 | ) | | 4,161 |
| | (1,916 | ) |
Decrease in interest rate derivatives in connection with cash settlement | — |
| | — |
| | (28,003 | ) |
Net cash provided by operating activities | $ | 193,885 |
| | $ | 158,979 |
| | $ | 191,838 |
|
Supplemental schedule of non-cash investing and financing activities: | |
| | |
| | |
(Decrease) increase in accrued capital improvements, leasing and other investing activity costs | $ | (3,779 | ) | | $ | 2,947 |
| | $ | (1,227 | ) |
Decrease in property in connection with transfer of property in settlement of debt | $ | — |
| | $ | 73,780 |
| | $ | 12,042 |
|
Decrease in debt in connection with transfer of property in settlement of debt | $ | — |
| | $ | 146,500 |
| | $ | 16,304 |
|
(Decrease) increase in fair value of derivatives applied to accumulated other comprehensive income (loss) and noncontrolling interests | $ | (4,866 | ) | | $ | 9,470 |
| | $ | 4,040 |
|
Distributions payable | $ | 29,862 |
| | $ | 29,080 |
| | $ | 28,698 |
|
COPLP common units issued to acquire property and noncontrolling interest in other consolidated entity | $ | — |
| | $ | 5,194 |
| | $ | — |
|
(Decrease) increase in redeemable noncontrolling interest and (increase) decrease in equity to carry redeemable noncontrolling interest at fair value | $ | (134 | ) | | $ | 7,121 |
| | $ | 3,955 |
|
See accompanying notes to consolidated financial statements.
Corporate Office Properties Trust and Subsidiaries and Corporate Office Properties, L.P. and Subsidiaries
Notes to Consolidated Financial Statements
1. Organization
Corporate Office Properties Trust (“COPT”) and subsidiaries (collectively, the “Company”) is a fully-integrated and self-managed real estate investment trust (“REIT”). Corporate Office Properties, L.P. (“COPLP”) and subsidiaries (collectively, the “Operating Partnership”) is the entity through which COPT, the sole general partner of COPLP, conducts almost all of its operations and owns almost all of its assets. Unless otherwise expressly stated or the context otherwise requires, “we”, “us” and “our” as used herein refer to each of the Company and the Operating Partnership. We focus primarily on serving the specialized requirements of United States Government agencies and their contractors, most of whom are engaged in national security and information technology related activities. We generally acquire, develop, manage and lease office and data center properties concentrated in large office parks located near knowledge-based government demand drivers and/or in targeted markets or submarkets in the Greater Washington, DC/Baltimore region. As of December 31, 2014, our properties included the following (all references to number of properties, square footage, acres and megawatts are unaudited):
| |
• | 173 operating office properties totaling 16.8 million square feet (excluding two properties serving as collateral for a nonrecourse mortgage loan in default, as discussed further in Note 11); |
| |
• | 13 office properties under, or contractually committed for, construction or redevelopment that we estimate will total approximately 1.6 million square feet upon completion; |
| |
• | 1,464 acres of land we control that we believe are potentially developable into approximately 18.3 million square feet; and |
| |
• | a partially operational, wholesale data center which upon completion and stabilization is expected to have a critical load of 19.25 megawatts. |
COPLP owns real estate both directly and through subsidiary partnerships and limited liability companies (“LLCs”). In addition to owning real estate, COPLP also owns subsidiaries that provide real estate services such as property management and construction and development services primarily for our properties but also for third parties. Some of these services are performed by a taxable REIT subsidiary (“TRS”).
Equity interests in COPLP are in the form of common and preferred units. As of December 31, 2014, COPT owned 96.0% of the outstanding COPLP common units (“common units”) and 95.5% of the outstanding COPLP preferred units (“preferred units”); the remaining common and preferred units in COPLP were owned by third parties. Common units in COPLP not owned by COPT carry certain redemption rights. The number of common units in COPLP owned by COPT is equivalent to the number of outstanding common shares of beneficial interest (“common shares”) of COPT, and the entitlement of all COPLP common units to quarterly distributions and payments in liquidation is substantially the same as those of COPT common shareholders. Similarly, in the case of each series of preferred units in COPLP held by COPT, there is a series of preferred shares of beneficial interest (“preferred shares”) in COPT that is equivalent in number and carries substantially the same terms as such series of COPLP preferred units. COPT’s common shares are publicly traded on the New York Stock Exchange (“NYSE”) under the ticker symbol “OFC”.
Because COPLP is managed by COPT, and COPT conducts substantially all of its operations through COPLP, we refer to COPT’s executive officers as COPLP’s executive officers, and although, as a partnership, COPLP does not have a board of trustees, we refer to COPT’s Board of Trustees as COPLP’s Board of Trustees.
2. Summary of Significant Accounting Policies
Basis of Presentation
The COPT consolidated financial statements include the accounts of COPT, the Operating Partnership, their subsidiaries and other entities in which COPT has a majority voting interest and control. The COPLP consolidated financial statements include the accounts of COPLP, its subsidiaries and other entities in which COPLP has a majority voting interest and control. We also consolidate certain entities when control of such entities can be achieved through means other than voting rights (“variable interest entities” or “VIEs”) if we are deemed to be the primary beneficiary of such entities. We eliminate all significant intercompany balances and transactions in consolidation.
We use the equity method of accounting when we own an interest in an entity and can exert significant influence over but cannot control the entity’s operations. We discontinue equity method accounting if our investment in an entity (and net
Corporate Office Properties Trust and Subsidiaries and Corporate Office Properties, L.P. and Subsidiaries
Notes to Consolidated Financial Statements (Continued)
advances) is reduced to zero unless we have guaranteed obligations of the entity or are otherwise committed to provide further financial support for the entity.
We use the cost method of accounting when we own an interest in an entity and cannot exert significant influence over its operations.
Prior Out of Period Adjustment
During the second quarter of 2013, we identified an error related to the estimated fair value of a redeemable noncontrolling interest in a real estate joint venture. Changes in such fair value are reported as changes in equity with no impact to net income or comprehensive income. The error resulted in an understatement of the line entitled “redeemable noncontrolling interest” in the mezzanine section of our consolidated balance sheet and an overstatement of the line entitled “additional paid-in capital” in the equity section of our consolidated balance sheet of $3.7 million as of December 31, 2012. We have determined that this adjustment was not material to our financial statements for 2012 or 2013. Accordingly, this change is reported as an out-of-period adjustment in the consolidated statement of equity for the year ended December 31, 2013.
Use of Estimates in the Preparation of Financial Statements
We make estimates and assumptions when preparing financial statements under generally accepted accounting principles (“GAAP”). These estimates and assumptions affect various matters, including:
| |
• | the reported amounts of assets and liabilities in our consolidated balance sheets at the dates of the financial statements; |
| |
• | the disclosure of contingent assets and liabilities at the dates of the financial statements; and |
| |
• | the reported amounts of revenues and expenses in our consolidated statements of operations during the reporting periods. |
Significant estimates are inherent in the presentation of our financial statements in a number of areas, including the evaluation of the collectability of accounts and notes receivable, the allocation of property acquisition costs, the determination of estimated useful lives of assets, the determination of lease terms, the evaluation of impairment of long-lived assets, the amount of revenue recognized relating to tenant improvements and the level of expense recognized in connection with share-based compensation. Actual results could differ from these and other estimates.
Acquisitions of Properties
Upon completion of property acquisitions, we allocate the purchase price to tangible and intangible assets and liabilities associated with such acquisitions based on our estimates of their fair values. We determine these fair values by using market data and independent appraisals available to us and making numerous estimates and assumptions. We allocate property acquisitions to the following components:
| |
• | properties based on a valuation performed under the assumption that the property is vacant upon acquisition (the “if-vacant value”). The if-vacant value is allocated between land and buildings or, in the case of properties under development, construction in progress. We also allocate additional amounts to properties for in-place tenant improvements based on our estimate of improvements per square foot provided under market leases that would be attributable to the remaining non-cancellable terms of the respective leases; |
| |
• | above- and below-market lease intangible assets or liabilities based on the present value (using an interest rate which reflects the risks associated with the leases acquired) of the difference between: (1) the contractual amounts to be received pursuant to the in-place leases; and (2) our estimate of fair market lease rates for the corresponding space, measured over a period equal to the remaining non-cancelable term of the lease. The capitalized above- and below-market lease values are amortized as adjustments to rental revenue over the remaining lease terms of the respective leases; |
| |
• | in-place lease value based on our estimates of: (1) the present value of additional income to be realized as a result of leases being in place on the acquired properties; and (2) costs to execute similar leases. Our estimate of additional income to be realized includes carrying costs, such as real estate taxes, insurance and other operating expenses, and revenues during the expected lease-up periods considering current market conditions. Our estimate of costs to execute similar leases includes leasing commissions, legal and other related costs; |
| |
• | tenant relationship value based on our evaluation of the specific characteristics of each tenant's lease and our overall relationship with that respective tenant. Characteristics we consider in determining these values include the nature and |
Corporate Office Properties Trust and Subsidiaries and Corporate Office Properties, L.P. and Subsidiaries
Notes to Consolidated Financial Statements (Continued)
extent of our existing business relationships with the tenant, growth prospects for developing new business with the tenant, the tenant's credit quality and expectations of lease renewals, among other factors; and
| |
• | above- and below- market cost arrangements (such as real estate tax treaties or above- or below- market ground leases) based on the present value of the expected benefit from any such arrangements in place on the property at the time of acquisition. |
Properties
We report properties to be developed or held and used in operations at our depreciated cost, reduced for impairment losses. The preconstruction stage of the development or redevelopment of an operating property includes efforts and related costs to secure land control and zoning, evaluate feasibility and complete other initial tasks which are essential to development.
We capitalize interest expense, real estate taxes and direct and indirect project costs (including related compensation and other indirect costs) associated with properties, or portions thereof, undergoing construction, development and redevelopment activities. In capitalizing interest expense, if there is a specific borrowing for the property undergoing construction, development and redevelopment activities, we apply the interest rate of that borrowing to the average accumulated expenditures that do not exceed such borrowing; for the portion of expenditures exceeding any such specific borrowing, we apply our weighted average interest rate on other borrowings to the expenditures. We continue to capitalize costs while construction, development or redevelopment activities are underway until a property becomes “operational,” which occurs when lease terms commence (generally when the tenant has control of the leased space and we have delivered the premises to the tenant as required under the terms of such lease), but no later than one year after the cessation of major construction activities. When leases commence on portions of a newly-constructed or redeveloped property in the period prior to one year from the cessation of major construction activities, we consider that property to be “partially operational.” When a property is partially operational, we allocate the costs associated with the property between the portion that is operational and the portion under construction. We start depreciating newly-constructed and redeveloped properties as they become operational.
Most of our leases involve some form of improvements to leased space. When we are required to provide improvements under the terms of a lease, we determine whether the improvements constitute landlord assets or tenant assets. If the improvements are landlord assets, we capitalize the cost of the improvements and recognize depreciation expense associated with such improvements over the shorter of the useful life of the assets or the term of the lease and recognize any payments from the tenant as rental revenue over the term of the lease. If the improvements are tenant assets, we defer the cost of improvements funded by us as a lease incentive asset and amortize it as a reduction of rental revenue over the term of the lease. In determining whether improvements constitute landlord or tenant assets, we consider numerous factors, including: whether the improvements are unique to the tenant or reusable by other tenants; whether the tenant is permitted to alter or remove the improvements without our consent or without compensating us for any lost fair value; whether the ownership of the improvements remains with us or remains with the tenant at the end of the lease term; and whether the economic substance of the lease terms is properly reflected.
We depreciate our fixed assets using the straight-line method over their estimated useful lives as follows: |
| | |
| | Estimated Useful Lives |
Buildings and building improvements | | 10-40 years |
Land improvements | | 10-20 years |
Tenant improvements on operating properties | | Related lease term |
Equipment and personal property | | 3-10 years |
We assess each of our operating properties for impairment quarterly using cash flow projections and estimated fair values that we derive for each of the properties. We update the leasing and other assumptions used in these projections regularly, paying particular attention to properties that have experienced chronic vacancy or face significant market challenges. We review our plans and intentions for our development projects and land parcels quarterly. If our analyses indicate that the carrying values of operating properties, properties in development or land held for future development may be impaired, we perform a recovery analysis for such properties. For long-lived assets to be held and used, we analyze recoverability based on the estimated undiscounted future cash flows expected to be generated from the operations and eventual disposition of the assets over, in most cases, a ten-year holding period. If we believe there is a significant possibility that we might dispose of the assets earlier, we analyze recoverability using a probability weighted analysis of the estimated undiscounted future cash flows expected to be generated from the operations and eventual disposition of the assets over the various possible holding periods. If the recovery analysis indicates that the carrying value of a tested property is not recoverable from estimated future cash flows, it is written
Corporate Office Properties Trust and Subsidiaries and Corporate Office Properties, L.P. and Subsidiaries
Notes to Consolidated Financial Statements (Continued)
down to its estimated fair value and an impairment loss is recognized. If and when our plans change, we revise our recoverability analyses to use the cash flows expected from the operations and eventual disposition of each asset using holding periods that are consistent with our revised plans. Changes in holding periods may require us to recognize significant impairment losses.
Property fair values are determined based on contract prices, indicative bids, discounted cash flow analyses or yield analyses. Estimated cash flows used in such analyses are based on our plans for the property and our views of market and economic conditions. The estimates consider factors such as current and future rental rates, occupancies for the tested property and comparable properties, estimated operating and capital expenditures and recent sales data for comparable properties; most of these factors are influenced by market data obtained from real estate leasing and brokerage firms and our direct experience with the properties and their markets.
When we determine that a property is held for sale, we discontinue the recording of depreciation expense on the property and estimate the property’s fair value, net of selling costs; if we then determine that the estimated fair value, net of selling costs, is less than the net book value of the property, we recognize an impairment loss equal to the difference and reduce the net book value of the property. For periods in which a property is classified as held for sale, we classify the assets of the property as held for sale on our consolidated balance sheet for such periods.
For dispositions of operating properties occurring prior to the quarterly period ended June 30, 2014 in which we have no significant continuing involvement in such properties, or for operating properties held for sale prior to the quarterly period ended June 30, 2014, we classify the results of operations for such properties as discontinued operations; interest expense that is specifically identifiable to properties included in discontinued operations is used in the computation of interest expense attributable to discontinued operations. As discussed further below, we adopted guidance issued by the Financial Accounting Standards Board (“FASB”) related to the reporting of discontinued operations and disclosures of disposals of components of an entity effective for the quarterly period ended June 30, 2014. This guidance defines a discontinued operation as a component or group of components disposed or classified as held for sale that represents a strategic shift that has (or will have) a major effect on an entity’s operations and financial results; the guidance states that a strategic shift could include a disposal of a major geographical area of operations, a major line of business, a major equity method investment or other major parts of an entity. We have had no properties newly classified as discontinued operations subsequent to our adoption of this guidance.
Sales of Interests in Real Estate
We recognize gains from sales of interests in real estate using the full accrual method, provided that various criteria relating to the terms of sale and any subsequent involvement by us with the real estate sold are met.
Cash and Cash Equivalents
Cash and cash equivalents include all cash and liquid investments that mature three months or less from when they are purchased. Cash equivalents are reported at cost, which approximates fair value. We maintain our cash in bank accounts in amounts that may exceed Federally insured limits at times. We have not experienced any losses in these accounts in the past and believe that we are not exposed to significant credit risk because our accounts are deposited with major financial institutions.
Investments in Marketable Securities
We classify marketable securities as trading securities when we have the intent to sell such securities in the near term, and classify other marketable securities as available-for-sale securities. We determine the appropriate classification of investments in marketable securities at the acquisition date and re-evaluate the classification at each balance sheet date. We report investments in marketable securities classified as trading securities at fair value, with unrealized gains and losses recognized through earnings; on our consolidated statements of cash flows, we classify cash flows from these securities as operating activities. We report investments in marketable securities classified as available-for-sale securities at fair value, with net unrealized gains or losses deferred to accumulated other comprehensive income (loss) (“AOCI”) and realized gains and losses resulting from sales of such investments recognized through earnings; on our consolidated statements of cash flows, we classify cash flows from interest and dividends earned on these securities as operating activities and cash flows from purchases, sales and maturities of these securities as investing activities.
Corporate Office Properties Trust and Subsidiaries and Corporate Office Properties, L.P. and Subsidiaries
Notes to Consolidated Financial Statements (Continued)
Accounts and Deferred Rents Receivable and Investing Receivables
We maintain allowances for estimated losses resulting from the failure of our customers or borrowers to satisfy their payment obligations. We use judgment in estimating these allowances based primarily upon the payment history and credit status of the entities associated with the individual receivables. We write off these receivables when we believe the facts and circumstances indicate that continued pursuit of collection is no longer warranted. When we earn interest income in connection with receivables for which we have established allowances, we establish allowances in connection with such interest income that is unpaid. When cash is received in connection with receivables for which we have established allowances, we reduce the amount of losses previously recognized.
Intangible Assets and Deferred Revenue on Real Estate Acquisitions
We capitalize intangible assets and deferred revenue on real estate acquisitions as described in the section above entitled “Acquisitions of Properties.” We amortize the intangible assets and deferred revenue as follows: |
| | |
Asset Type | | Amortization Period |
Above- and below-market leases | | Related lease terms |
In-place lease value | | Related lease terms |
Tenant relationship value | | Estimated period of time that tenant will lease space in property |
Above- and below-market cost arrangements | | Term of arrangements |
Market concentration premium | | 40 years |
We recognize the amortization of acquired above-market and below-market leases as adjustments to rental revenue. We recognize the amortization of above- and below- market cost arrangements as adjustments to property operating expenses. We recognize the amortization of other intangible assets on property acquisitions as amortization expense.
Deferred Leasing and Financing Costs, Net
We defer costs incurred to obtain new tenant leases or extend existing tenant leases, including related compensation costs. We amortize these costs evenly over the lease terms. When tenant leases are terminated early, we expense any unamortized deferred leasing costs associated with those leases over the shortened term of the lease.
We defer costs of financing arrangements and recognize these costs as interest expense over the related loan terms on a straight-line basis, which approximates the amortization that would occur under the effective interest method of amortization. We expense any unamortized loan costs when loans are retired early.
Noncontrolling Interests
COPT’s consolidated noncontrolling interests are comprised of interests in COPLP not owned by COPT (discussed further in Note 15) and consolidated real estate joint ventures (discussed further in Note 6). COPLP’s consolidated noncontrolling interests are comprised primarily of interests in our consolidated real estate joint ventures. Also included in COPLP’s consolidated noncontrolling interests are interests in several real estate entities owned directly by COPT, or a wholly owned subsidiary of COPT, that generally do not exceed 1% of interests in such entities. We evaluate whether noncontrolling interests are subject to redemption features outside of our control. For noncontrolling interests that are currently redeemable for cash at the option of the holders of such interests or deemed probable to eventually become redeemable, we classify such interests as redeemable noncontrolling interests in the mezzanine section of our consolidated balance sheets; we adjust these interests each period to the greater of their fair value or carrying amount (initial amount as adjusted for allocations of income and losses and contributions and distributions), with a corresponding offset to additional paid-in capital on COPT’s consolidated balance sheets or common units on COPLP’s balance sheet, and only recognize reductions in such interests to the extent of their carrying amount. Our other noncontrolling interests are reported in the equity section of our consolidated balance sheets. The amounts reported for noncontrolling interests on our consolidated statements of operations represent the portion of these entities’ income or losses not attributable to us.
Corporate Office Properties Trust and Subsidiaries and Corporate Office Properties, L.P. and Subsidiaries
Notes to Consolidated Financial Statements (Continued)
Revenue Recognition
We recognize minimum rents, net of abatements, on a straight-line basis over the term of tenant leases. A lease term generally commences when: (1) the tenant has control of the leased space (legal right to use the property); and (2) we have delivered the premises to the tenant as required under the terms of such lease. The term of a lease generally includes periods when a tenant: (1) may not terminate its lease obligation early; (2) may terminate its lease obligation early in exchange for a fee or penalty that we consider material enough such that termination would not be probable; (3) possesses renewal rights and the tenant’s failure to exercise such rights imposes a penalty on the tenant material enough such that renewal appears reasonably assured; or (4) possesses bargain renewal options for such periods. We report the amount by which our minimum rental revenue recognized on a straight-line basis under leases exceeds the contractual rent billings associated with such leases as deferred rent receivable on our consolidated balance sheets. Amounts by which our minimum rental revenue recognized on a straight-line basis under leases are less than the contractual rent billings associated with such leases are included in deferred revenue associated with operating leases on our consolidated balance sheets.
In connection with a tenant’s entry into, or modification of, a lease, if we make cash payments to, or on behalf of, the tenant for purposes other than funding the construction of landlord assets, we defer the amount of such payments as lease incentives. As discussed above, when we are required to provide improvements under the terms of a lease, we determine whether the improvements constitute landlord assets or tenant assets; if the improvements are tenant assets, we defer the cost of improvements funded by us as a lease incentive asset. We amortize lease incentives as a reduction of rental revenue over the term of the lease.
We recognize tenant recovery revenue in the same periods in which we incur the related expenses. Tenant recovery revenue includes payments from tenants as reimbursement for property taxes, utilities and other property operating expenses.
We recognize fees received for lease terminations as revenue and write off against such revenue any (1) deferred rents receivable, and (2) deferred revenue, lease incentives and intangible assets that are amortizable into rental revenue associated with the leases; the resulting net amount is the net revenue from the early termination of the leases. When a tenant's lease for space in a property is terminated early but the tenant continues to lease such space under a new or modified lease in the property, the net revenue from the early termination of the lease is recognized evenly over the remaining life of the new or modified lease in place on that property.
We recognize fees for services provided by us once services are rendered, fees are determinable and collectability is assured. We recognize revenue under construction contracts using the percentage of completion method when the revenue and costs for such contracts can be estimated with reasonable accuracy; when these criteria do not apply to a contract, we recognize revenue on that contract using the completed contract method. Under the percentage of completion method, we recognize a percentage of the total estimated revenue on a contract based on the cost of services provided on the contract as of a point in time relative to the total estimated costs on the contract.
Interest Rate Derivatives
Our primary objectives in using interest rate derivatives are to add stability to interest expense and to manage exposure to interest rate movements. To accomplish this objective, we primarily use interest rate swaps as part of our interest rate risk management strategy. Interest rate swaps designated as cash flow hedges involve the receipt of variable-rate amounts from a counterparty in exchange for our making fixed-rate payments over the life of the agreements without exchange of the underlying notional amount. Derivatives are used to hedge the cash flows associated with interest rates on existing debt as well as future debt. We recognize all derivatives as assets or liabilities on our consolidated balance sheet at fair value. We defer the effective portion of changes in fair value of the designated cash flow hedges to AOCI and reclassify such deferrals to interest expense as interest expense is recognized on the hedged forecasted transactions. We recognize the ineffective portion of the change in fair value of interest rate derivatives directly in interest expense. When an interest rate swap designated as a cash flow hedge no longer qualifies for hedge accounting, we recognize changes in fair value of the hedge previously deferred to AOCI, along with any changes in fair value occurring thereafter, through earnings. We do not use interest rate derivatives for trading or speculative purposes. We manage counter-party risk by only entering into contracts with major financial institutions based upon their credit ratings and other risk factors.
We use standard market conventions and techniques such as discounted cash flow analysis, option pricing models, replacement cost and termination cost in computing the fair value of derivatives at each balance sheet date. We made an
Corporate Office Properties Trust and Subsidiaries and Corporate Office Properties, L.P. and Subsidiaries
Notes to Consolidated Financial Statements (Continued)
accounting policy election to use an exception provided for in the applicable accounting guidance with respect to measuring counterparty credit risk for derivative instruments; this election enables us to measure the fair value of groups of assets and liabilities associated with derivative instruments consistently with how market participants would price the net risk exposure as of the measurement date.
Please refer to Note 12 for additional information pertaining to interest rate derivatives.
Expense Classification
We classify as property operations expense costs incurred for property taxes, ground rents, utilities, property management, insurance, repairs, exterior and interior maintenance and tenant revenue collection losses, as well as associated labor and indirect costs attributable to these costs.
We classify as general and administrative and leasing expenses costs incurred for corporate-level management, public company administration, asset management, leasing, investor relations, marketing and corporate-level insurance (including general business, director and officers and key man life) and leasing prospects, as well as associated labor and indirect costs attributable to these costs.
Share-Based Compensation
We issue two forms of share-based compensation: restricted COPT common shares (“restricted shares”) and COPT performance share units (“PSUs”). We also issued options to purchase COPT common shares (“options”) in prior years. We account for share-based compensation in accordance with authoritative guidance provided by the FASB that establishes standards for the accounting for transactions in which an entity exchanges its equity instruments for goods or services, focusing primarily on accounting for transactions in which an entity obtains employee services in share-based payment transactions. The guidance requires us to measure the cost of employee services received in exchange for an award of equity instruments based generally on the fair value of the award on the grant date; such cost is then recognized over the period during which the employee is required to provide service in exchange for the award. No compensation cost is recognized for equity instruments for which employees do not render the requisite service. The guidance also requires that share-based compensation be computed based on awards that are ultimately expected to vest; as a result, future forfeitures of awards are estimated at the time of grant and revised, if necessary, in subsequent periods if actual forfeitures differ from those estimates. If an award is voluntarily cancelled by an employee, we recognize the previously unrecognized cost associated with the original award on the date of such cancellation. We capitalize costs associated with share-based compensation attributable to employees engaged in construction and development activities.
When we adopted the authoritative guidance on accounting for share-based compensation, we elected to adopt the alternative transition method for calculating the tax effects of share-based compensation. This method enabled us to use a simplified method to establishing the beginning balance of the additional paid-in capital pool related to the tax effects of employee share-based compensation that was available to absorb tax deficiencies recognized subsequent to the adoption of this guidance.
We compute the fair value of options using the Black-Scholes option-pricing model. Under that model, the risk-free interest rate is based on the U.S. Treasury yield curve in effect at the time of grant. The expected option life is based on our historical experience of employee exercise behavior. Expected volatility is based on historical volatility of COPT common shares. Expected dividend yield is based on the average historical dividend yield on our common shares over a period of time ending on the grant date of the options.
We compute the fair value of PSUs using a Monte Carlo model. Under that model, the baseline common share value is based on the market value on the grant date. The risk-free interest rate is based on the U.S. Treasury yield curve in effect at the time of grant. Expected volatility is based on historical volatility of COPT’s common shares.
Recent Accounting Pronouncements
We adopted guidance issued by the FASB related to the reporting of discontinued operations and disclosures of disposals of components of an entity effective for the quarterly period ended June 30, 2014. This guidance defines a discontinued operation as a component or group of components disposed or classified as held for sale that represents a strategic shift that has (or will
Corporate Office Properties Trust and Subsidiaries and Corporate Office Properties, L.P. and Subsidiaries
Notes to Consolidated Financial Statements (Continued)
have) a major effect on an entity’s operations and financial results; the guidance states that a strategic shift could include a disposal of a major geographical area of operations, a major line of business, a major equity method investment or other major parts of an entity. The guidance also provides for additional disclosure requirements in connection with both discontinued operations and other dispositions not qualifying as discontinued operations. The guidance applies prospectively to new disposals and new classifications of disposal groups as held for sale after the effective date. Our adoption of the guidance will result in fewer disposed or held for sale properties being reported as discontinued operations in our results of operations (including operating properties sold during the current period) but will not otherwise materially affect our consolidated financial statements.
In May 2014, the FASB issued guidance regarding the recognition of revenue from contracts with customers. Under this guidance, an entity will recognize revenue to depict the transfer of goods or services to customers in an amount that reflects the consideration to which the entity expects to be entitled in exchange for those goods or services. Additionally, this guidance requires improved disclosures regarding the nature, amount, timing and uncertainty of revenue and cash flows arising from contracts with customers. We are required to adopt this guidance for our annual and interim periods beginning January 1, 2017, using one of two methods: retrospective restatement for each reporting period presented at the time of adoption, or retrospectively with the cumulative effect of initially applying this guidance recognized at the date of initial application. We are currently assessing the financial impact of this guidance on our consolidated financial statements.
3. Fair Value Measurements
Accounting standards define fair value as the exit price, or the amount that would be received upon sale of an asset or paid to transfer a liability in an orderly transaction between market participants as of the measurement date. The standards also establish a hierarchy for inputs used in measuring fair value that maximizes the use of observable inputs and minimizes the use of unobservable inputs by requiring that the most observable inputs be used when available. Observable inputs are inputs market participants would use in valuing the asset or liability developed based on market data obtained from sources independent of us. Unobservable inputs are inputs that reflect our assumptions about the factors market participants would use in valuing the asset or liability developed based upon the best information available in the circumstances. The hierarchy of these inputs is broken down into three levels: Level 1 inputs are quoted prices (unadjusted) in active markets for identical assets or liabilities; Level 2 inputs include (1) quoted prices for similar assets or liabilities in active markets, (2) quoted prices for identical or similar assets or liabilities in inactive markets and (3) inputs (other than quoted prices) that are observable for the asset or liability, either directly or indirectly; and Level 3 inputs are unobservable inputs for the asset or liability. Categorization within the valuation hierarchy is based upon the lowest level of input that is most significant to the fair value measurement.
Recurring Fair Value Measurements
The assets held in connection with a non-qualified elective deferred compensation plan held by COPT (comprised primarily of mutual funds and equity securities) and the corresponding liability to the participants are measured at fair value on a recurring basis on COPT’s consolidated balance sheet using quoted market prices, as are other marketable securities that we hold. The deferred compensation plan assets and other marketable securities are included in the line entitled restricted cash and marketable securities on COPT’s consolidated balance sheets. The offsetting liability associated with the deferred compensation plan is adjusted to fair value at the end of each accounting period based on the fair value of the plan assets and reported in other liabilities on COPT’s consolidated balance sheets. The assets of the non-qualified elective deferred compensation plan and other marketable securities that we hold are classified in Level 1 of the fair value hierarchy. The liability associated with the deferred compensation plan is classified in Level 2 of the fair value hierarchy.
The fair values of our interest rate derivatives are determined using widely accepted valuation techniques, including a discounted cash flow analysis on the expected cash flows of each derivative. This analysis reflects the contractual terms of the derivatives, including the period to maturity, and uses observable market-based inputs, including interest rate market data and implied volatilities in such interest rates. While we determined that the majority of the inputs used to value our derivatives fall within Level 2 of the fair value hierarchy, the credit valuation adjustments associated with our interest rate derivatives utilize Level 3 inputs, such as estimates of current credit spreads to evaluate the likelihood of default. However, as of December 31, 2014, we assessed the significance of the impact of the credit valuation adjustments on the overall valuation of our derivatives and determined that these adjustments are not significant. As a result, we determined that our interest rate derivative valuations in their entirety are classified in Level 2 of the fair value hierarchy.
Corporate Office Properties Trust and Subsidiaries and Corporate Office Properties, L.P. and Subsidiaries
Notes to Consolidated Financial Statements (Continued)
As of December 31, 2014 and 2013, we owned warrants to purchase 50,000 common shares in The KEYW Holding Corporation (“KEYW”) at an exercise price of $9.25 per share. KEYW is an entity supporting the intelligence community's operations and transformation to Cyber Age mission by providing engineering services and integrated platforms that support the intelligence process. We compute the fair value of these warrants using the Black-Scholes option-pricing model. Under that model, the risk-free interest rate is based on the U.S. Treasury yield curve in effect as of the valuation date. The expected life is based on the period of time until the expiration of the warrants. The expected volatility is based on an average of the historical volatility of companies in KEYW’s industry that we deem to be comparable. The expected dividend yield is based on the dividend yield on KEYW’s common shares as of the date of valuation. The warrants are classified in Level 2 of the fair value hierarchy.
In addition to the warrants in KEYW described above, we also owned 1.9 million shares, or approximately 7%, of KEYW’s common stock as of December 31, 2011. We sold all of these shares in 2012 for $14.0 million. We recognized revenue from a lease with KEYW in one of our properties of $2.4 million in 2012.
As discussed further in Note 6, our partner in a real estate joint venture has the right to require us to acquire its interest at fair value beginning in March 2020; accordingly, we classify the fair value of our partner’s interest as a redeemable noncontrolling interest in the mezzanine section of our consolidated balance sheet. We determine the fair value of the interest based on unobservable inputs after considering the assumptions that market participants would make in pricing the interest. We apply a discount rate to the estimated future cash flows allocable to our partner from the properties underlying the joint venture. Estimated cash flows used in such analyses are based on our plans for the properties and our views of market and economic conditions, and consider items such as current and future rental rates, occupancies for the properties and comparable properties and estimated operating and capital expenditures. In determining the fair value of our partner’s interest as of December 31, 2014 and 2013, we used a discount rate of 15.5%, which factored in risk appropriate to the level of future property development expected to be undertaken by the joint venture. A significant increase (decrease) in the discount rate used in determining the fair value would result in a significantly (lower) higher fair value. Given our reliance on the unobservable inputs, the valuations are classified in Level 3 of the fair value hierarchy.
The carrying values of cash and cash equivalents, restricted cash, accounts receivable, other assets (excluding investing receivables) and accounts payable and accrued expenses are reasonable estimates of their fair values because of the short maturities of these instruments. As discussed in Note 9, we estimated the fair values of our investing receivables based on the discounted estimated future cash flows of the loans (categorized within Level 3 of the fair value hierarchy); the discount rates used approximate current market rates for loans with similar maturities and credit quality, and the estimated cash payments include scheduled principal and interest payments. For our disclosure of debt fair values in Note 11, we estimated the fair value of our unsecured senior notes and exchangeable senior notes based on quoted market rates for publicly-traded debt (categorized within Level 2 of the fair value hierarchy) and estimated the fair value of our other debt based on the discounted estimated future cash payments to be made on such debt (categorized within Level 3 of the fair value hierarchy); the discount rates used approximate current market rates for loans, or groups of loans, with similar maturities and credit quality, and the estimated future payments include scheduled principal and interest payments. Fair value estimates are made at a specific point in time, are subjective in nature and involve uncertainties and matters of significant judgment. Settlement at such fair value amounts may not be possible and may not be a prudent management decision.
For additional fair value information, please refer to Note 9 for investing receivables, Note 11 for debt and Note 12 for interest rate derivatives.
Corporate Office Properties Trust and Subsidiaries and Corporate Office Properties, L.P. and Subsidiaries
Notes to Consolidated Financial Statements (Continued)
COPT and Subsidiaries
The tables below set forth financial assets and liabilities of COPT and its subsidiaries that are accounted for at fair value on a recurring basis as of December 31, 2014 and 2013 and the hierarchy level of inputs used in measuring their respective fair values under applicable accounting standards (in thousands):
|
| | | | | | | | | | | | | | | | |
Description | | Quoted Prices in
Active Markets for
Identical Assets(Level 1) | | Significant Other
Observable Inputs(Level 2) | | Significant
Unobservable Inputs(Level 3) | | Total |
December 31, 2014: | | | | | | | | |
Assets: | | |
| | |
| | |
| | |
|
Marketable securities in deferred compensation plan (1) | | |
| | |
| | |
| | |
|
Mutual funds | | $ | 5,756 |
| | $ | — |
| | $ | — |
| | $ | 5,756 |
|
Other | | 126 |
| | — |
| | — |
| | 126 |
|
Interest rate derivatives (2) | | — |
| | 274 |
| | — |
| | 274 |
|
Warrants to purchase common stock in KEYW (2) | | — |
| | 164 |
| | — |
| | 164 |
|
Total Assets | | $ | 5,882 |
| | $ | 438 |
| | $ | — |
| | $ | 6,320 |
|
Liabilities: | | |
| | |
| | |
| | |
|
Deferred compensation plan liability (3) | | $ | — |
| | $ | 5,882 |
| | $ | — |
| | $ | 5,882 |
|
Interest rate derivatives | | — |
| | 1,855 |
| | — |
| | 1,855 |
|
Total Liabilities | | $ | — |
| | $ | 7,737 |
| | $ | — |
| | $ | 7,737 |
|
Redeemable noncontrolling interest | | $ | — |
| | $ | — |
| | $ | 18,417 |
| | $ | 18,417 |
|
| | | | | | | | |
December 31, 2013: | | | | | | | | |
Assets: | | |
| | |
| | |
| | |
|
Marketable securities in deferred compensation plan (1) | | |
| | |
| | |
| | |
|
Mutual funds | | $ | 7,090 |
| | $ | — |
| | $ | — |
| | $ | 7,090 |
|
Common stocks | | 176 |
| | — |
| | — |
| | 176 |
|
Other | | 201 |
| | — |
| | — |
| | 201 |
|
Common stock (1) | | 298 |
| | — |
| | — |
| | 298 |
|
Interest rate derivatives (2) | | — |
| | 6,594 |
| | | | 6,594 |
|
Warrants to purchase common stock in KEYW (2) | | — |
| | 301 |
| | — |
| | 301 |
|
Total Assets | | $ | 7,765 |
| | $ | 6,895 |
| | $ | — |
| | $ | 14,660 |
|
Liabilities: | | |
| | |
| | |
| | |
|
Deferred compensation plan liability (3) | | $ | — |
| | $ | 7,467 |
| | $ | — |
| | $ | 7,467 |
|
Interest rate derivatives | | — |
| | 3,309 |
| | — |
| | 3,309 |
|
Total Liabilities | | $ | — |
| | $ | 10,776 |
| | $ | — |
| | $ | 10,776 |
|
Redeemable noncontrolling interest | | $ | — |
| | $ | — |
| | $ | 17,758 |
| | $ | 17,758 |
|
(1) Included in the line entitled “restricted cash and marketable securities” on COPT’s consolidated balance sheet.
(2) Included in the line entitled “prepaid expenses and other assets” on COPT’s consolidated balance sheet.
(3) Included in the line entitled “other liabilities” on COPT’s consolidated balance sheet.
Corporate Office Properties Trust and Subsidiaries and Corporate Office Properties, L.P. and Subsidiaries
Notes to Consolidated Financial Statements (Continued)
COPLP and Subsidiaries
The tables below set forth financial assets and liabilities of COPLP and its subsidiaries that are accounted for at fair value on a recurring basis as of December 31, 2014 and 2013 and the hierarchy level of inputs used in measuring their respective fair values under applicable accounting standards (in thousands):
|
| | | | | | | | | | | | | | | | |
Description | | Quoted Prices in
Active Markets for
Identical Assets(Level 1) | | Significant Other
Observable Inputs(Level 2) | | Significant
Unobservable Inputs(Level 3) | | Total |
December 31, 2014: | | | | | | | | |
Assets: | | |
| | |
| | |
| | |
|
Interest rate derivatives (1) | | $ | — |
| | $ | 274 |
| | $ | — |
| | $ | 274 |
|
Warrants to purchase common stock in KEYW (1) | | — |
| | 164 |
| | — |
| | 164 |
|
Total Assets | | $ | — |
| | $ | 438 |
| | $ | — |
| | $ | 438 |
|
Liabilities: | | |
| | |
| | |
| | |
|
Interest rate derivatives | | $ | — |
| | $ | 1,855 |
| | $ | — |
| | $ | 1,855 |
|
Redeemable noncontrolling interest | | $ | — |
| | $ | — |
| | $ | 18,417 |
| | $ | 18,417 |
|
| | | | | | | | |
December 31, 2013: | | | | | | | | |
Assets: | | |
| | |
| | |
| | |
|
Common stock (2) | | $ | 298 |
| | $ | — |
| | $ | — |
| | $ | 298 |
|
Interest rate derivatives (1) | | — |
| | 6,594 |
| | — |
| | 6,594 |
|
Warrants to purchase common stock in KEYW (1) | | — |
| | 301 |
| | — |
| | 301 |
|
Total Assets | | $ | 298 |
| | $ | 6,895 |
| | $ | — |
| | $ | 7,193 |
|
Liabilities: | | |
| | |
| | |
| | |
|
Interest rate derivatives | | $ | — |
| | $ | 3,309 |
| | $ | — |
| | $ | 3,309 |
|
Redeemable noncontrolling interest | | $ | — |
| | $ | — |
| | $ | 17,758 |
| | $ | 17,758 |
|
(1) Included in the line entitled “prepaid expenses and other assets” on COPLP’s consolidated balance sheet.
(2) Included in the line entitled “restricted cash and marketable securities” on COPLP’s consolidated balance sheet.
Nonrecurring Fair Value Measurements
In 2014, we recognized impairment losses totaling $1.4 million primarily in connection with certain of our operating properties in the Greater Baltimore, Maryland (“Greater Baltimore”) region that were disposed in the current period. After shortening our expected holding period for these properties during the year, we determined that the carrying amount of the properties would not likely be recovered from the cash flows from the operations and sales of the properties over the shortened period.
In 2013, we recognized the following impairment losses:
| |
• | for certain of our operating properties that served as collateral for a nonrecourse loan, we expected that the cash flows to be generated by the properties would be insufficient to fund debt service requirements on the loan. While we sought to negotiate various alternatives with the lender, on December 23, 2013, we conveyed the properties to the lender to extinguish the loan. We recognized non-cash impairment losses of $11.0 million (all classified as discontinued operations and including $560,000 in exit costs) on these properties in 2013 resulting primarily from the carrying amount of certain of these properties located in Colorado Springs, Colorado (“Colorado Springs”) exceeding their fair value; |
| |
• | $15.2 million (all classified as discontinued operations and including $419,000 in exit costs) in connection with properties and land no longer aligned with our strategy that we sold, mostly in Colorado Springs; and |
| |
• | $5.9 million on two properties in the Greater Baltimore region that Management concluded no longer met our strategic investment criteria. After shortening our expected holding period for these properties during the period, we determined that the carrying amount of the properties would not likely be recovered from the cash flows from the operations and sales of the properties over the shortened period. |
Corporate Office Properties Trust and Subsidiaries and Corporate Office Properties, L.P. and Subsidiaries
Notes to Consolidated Financial Statements (Continued)
The table below sets forth the fair value hierarchy of the valuation technique we used to determine the fair values of the properties (dollars in thousands):
|
| | | | | | | | | | | | | | | | | | | | |
| | | | |
| | Fair Value of Properties Held as of December 31, 2013 | | |
| | Quoted Prices in | | | | Significant | | | | Impairment |
| | Active Markets for | | Significant Other | | Unobservable | | | | Losses |
| | Identical Assets | | Observable Inputs | | Inputs | | | | Recognized in |
Description | | (Level 1) | | (Level 2) | | (Level 3) | | Total | | 2013 (1) |
Assets (2): | | |
| | |
| | |
| | |
| | |
Properties, net | | $ | — |
| | $ | — |
| | $ | 4,459 |
| | $ | 4,459 |
| | $ | 31,068 |
|
(1) Represents aggregate impairment losses on non recurring fair value measurements resulting in such losses, excluding exit costs incurred of $979,000.
(2) Reflects balance sheet classifications of assets at time of fair value measurement, excluding the effect of held for sale classifications.
The table below sets forth quantitative information about significant unobservable inputs used for the Level 3 fair value measurements reported above as of December 31, 2013 (dollars in thousands):
|
| | | | | | | | |
Valuation Technique | | Fair Value on Measurement Date | | Unobservable Input | | Range (Weighted Average) |
Discounted cash flow | | $ | 4,459 |
| | Discount rate | | 10.0% (1) |
| | | | Terminal capitalization rate | | 9.5% (1) |
| | | | Market rent growth rate | | 3.0% (1) |
| | | | Expense growth rate | | 3.0% (1) |
(1) Only one value applied for this unobservable input.
2012 Impairment Losses
We recognized impairment losses in 2012 in connection with the following:
| |
• | our office properties and developable land in Greater Philadelphia, Pennsylvania. Our Board of Trustees approved a plan by Management to shorten the holding period for these properties because they no longer met our strategic investment criteria. We determined that the carrying amounts of these properties would not likely be recovered from the cash flows from the operations and sales of such properties over the likely remaining holding period. Accordingly, we recognized aggregate non-cash impairment losses of $46.1 million in 2012 for the amounts by which the carrying values of the properties exceeded their respective estimated fair values. These losses contemplated our expectation that we would incur future cash expenditures of approximately $25.0 million to complete the redevelopment of certain of these properties; |
| |
• | properties sold, or identified for sale, that are no longer aligned with our strategy of $19.0 million ($23.2 million classified as discontinued operations and including $4.2 million in exit costs), including $6.9 million pertaining to certain properties in Colorado Springs classified as held for sale at December 31, 2012, and approximately $5.1 million related to our disposition of an additional property from which the cash flows were not sufficient to recover its carrying value; and |
| |
• | construction costs incurred on a property held for future development of $1.9 million. |
4. Concentration of Rental Revenue
We derived large concentrations of our revenue from real estate operations from certain tenants during the periods set forth in our consolidated statements of operations. The following table summarizes the percentage of our rental revenue (which excludes tenant recoveries and other real estate operations revenue) earned from (1) individual tenants that accounted for at least 5% of our rental revenue from continuing and discontinued operations and (2) the aggregate of the five tenants from which
Corporate Office Properties Trust and Subsidiaries and Corporate Office Properties, L.P. and Subsidiaries
Notes to Consolidated Financial Statements (Continued)
we recognized the most rental revenue in the respective years: |
| | | | | | | | | |
| | For the Years Ended December 31, |
| | 2014 | | 2013 | | 2012 |
United States Government | | 18 | % | | 18 | % | | 18 | % |
Northrop Grumman Corporation (1) | | 6 | % | | 8 | % | | 7 | % |
Booz Allen Hamilton, Inc. | | 6 | % | | 6 | % | | 6 | % |
Computer Sciences Corporation (1) | | N/A |
| | 5 | % | | 5 | % |
Five largest tenants | | 39 | % | | 41 | % | | 39 | % |
(1) Includes affiliated organizations and agencies and predecessor companies.
Our rental revenue from the United States Government was earned primarily from properties in the Baltimore/Washington Corridor, San Antonio, Texas (“San Antonio”), St. Mary’s & King George Counties and Colorado Springs regions. We also derived in excess of 90% of our construction contract revenue from the United States Government in each of the years set forth on the consolidated statements of operations.
In addition, we derived large concentrations of our total revenue from real estate operations (defined as the sum of rental revenue and tenant recoveries and other real estate operations revenue) from certain geographic regions. These concentrations are set forth in the segment information provided in Note 18. Several of these regions, including the Baltimore/Washington Corridor, Northern Virginia, Washington, DC - Capitol Riverfront, St. Mary’s & King George Counties and Greater Baltimore, are within close proximity to each other, and all but three of our regions with real estate operations (San Antonio, Huntsville, Alabama (“Huntsville”) and Colorado Springs) are located in the Mid-Atlantic region of the United States.
5. Properties, net
Operating properties, net consisted of the following (in thousands):
|
| | | | | | | |
| December 31, |
| 2014 | | 2013 |
Land | $ | 439,355 |
| | $ | 430,472 |
|
Buildings and improvements | 3,015,216 |
| | 2,869,870 |
|
Less: accumulated depreciation | (703,083 | ) | | (597,649 | ) |
Operating properties, net | $ | 2,751,488 |
| | $ | 2,702,693 |
|
In 2014, we recognized $12.9 million in additional depreciation expense resulting from our revision of the useful life of a property in Greater Philadelphia that was removed from service for redevelopment.
Projects we had in development or held for future development consisted of the following (in thousands):
|
| | | | | | | |
| December 31, |
| 2014 | | 2013 |
Land | $ | 214,977 |
| | $ | 245,676 |
|
Construction in progress, excluding land | 330,449 |
| | 265,932 |
|
Projects in development or held for future development | $ | 545,426 |
| | $ | 511,608 |
|
Corporate Office Properties Trust and Subsidiaries and Corporate Office Properties, L.P. and Subsidiaries
Notes to Consolidated Financial Statements (Continued)
2014 Dispositions
In 2014, we completed dispositions of the following operating properties (dollars in thousands):
|
| | | | | | | | | | | | | | | | | | |
Project Name | | Location | | Date of Sale | | Number of Buildings | | Total Rentable Square Feet | | Transaction Value | | Gain on Disposition |
4969 and 4979 Mercantile Road | | White Marsh, MD | | 7/14/2014 | | 2 |
| | 96,721 |
| | $ | 5,960 |
| | $ | 2,124 |
|
9930 and 9940 Franklin Square | | White Marsh, MD | | 7/30/2014 | | 2 |
| | 71,992 |
| | 10,475 |
| | 2,303 |
|
5020, 5022, 5024 and 5026 Campbell Boulevard | | White Marsh, MD | | 8/4/2014 | | 4 |
| | 134,245 |
| | 12,400 |
| | 666 |
|
| | | | | | 8 |
| | 302,958 |
| | $ | 28,835 |
| | $ | 5,093 |
|
We also sold land in 2014 for $28.3 million and recognized gains of $5.6 million on the sales.
2014 Construction Activities
In 2014, we placed into service an aggregate of 692,000 square feet in five newly constructed office properties located in the Baltimore/Washington Corridor, Northern Virginia and Huntsville. As of December 31, 2014, we had eight office properties under construction, or for which we were contractually committed to construct, that we estimate will total 1.2 million square feet upon completion, including four in Northern Virginia, two in the Baltimore/Washington Corridor, one in San Antonio and one in Huntsville. We also had five office properties under redevelopment that we estimate will total 344,000 square feet upon completion, including three in the Baltimore/Washington Corridor, one in Greater Philadelphia and one in St. Mary’s County, Maryland.
2013 Dispositions
In April 2011, we completed a review of our portfolio and identified a number of properties that were no longer closely aligned with our strategy, and our Board of Trustees approved a plan by Management to dispose of some of these properties (the “Strategic Reallocation Plan”). In December 2011, we identified additional properties for disposal, and our Board of Trustees approved a plan by management to increase the scope of the Strategic Reallocation Plan to include the disposition of additional properties. We completed dispositions of the following properties in 2013 primarily in connection with the Strategic Reallocation Plan (dollars in thousands):
|
| | | | | | | | | | | | | | | | | | |
Project Name | | Location | | Date of Sale | | Number of Buildings | | Total Rentable Square Feet | | Transaction Value | | Gain on Disposition |
920 Elkridge Landing Road | | Linthicum, MD | | 6/25/2013 | | 1 |
| | 103,000 |
| | $ | 6,900 |
| | $ | — |
|
4230 Forbes Boulevard | | Lanham, MD | | 12/11/2013 | | 1 |
| | 56,000 |
| | 5,600 |
| | 1,507 |
|
December 2013 Colorado Springs Portfolio Disposition | | Colorado Springs, CO | | 12/12/2013 | | 15 |
| | 1,165,000 |
| | 133,925 |
| | 1,164 |
|
December 2013 Portfolio Conveyance | | Colorado Springs, CO and Linthicum, MD | | 12/23/2013 | | 14 |
| | 1,021,000 |
| | 146,876 |
| | — |
|
| | | | | | 31 |
| | 2,345,000 |
| | $ | 293,301 |
| | $ | 2,671 |
|
Each of the above dispositions represents property sales except for the December 2013 Portfolio Conveyance, the disposition of which was completed in connection with a debt extinguishment, as described further below. We also had a disposition of a non-operating property in 2013 for an aggregate transaction value of $3.5 million. In addition to the gains on dispositions reflected above, we recognized impairment losses on certain of these assets that are disclosed in Note 3.
On December 23, 2013, the mortgage lender on a $146.5 million nonrecourse mortgage loan that was secured by the December 2013 Portfolio Conveyance accepted a deed in lieu of foreclosure on the properties. As a result, we transferred title to the properties to the mortgage lender and we were relieved of the debt obligation plus accrued interest. As of the transfer date, the property had an estimated fair value of $74 million. Upon completion of this transfer, we recognized a gain on extinguishment of debt of $67.8 million, representing the excess of the mortgage loan and interest payable extinguished over
Corporate Office Properties Trust and Subsidiaries and Corporate Office Properties, L.P. and Subsidiaries
Notes to Consolidated Financial Statements (Continued)
the carrying values of the properties transferred as of the transfer date (which included the effect of previous impairment losses) and related closing costs.
2013 Construction Activities
In 2013, we placed into service an aggregate of 812,000 square feet in eight newly constructed office properties located in the Baltimore/Washington Corridor, Northern Virginia and Huntsville.
6. Real Estate Joint Ventures
Consolidated Real Estate Joint Ventures
The table below sets forth information pertaining to our investments in consolidated real estate joint ventures as of December 31, 2014 (dollars in thousands):
|
| | | | | | | | | | | | | | | | | |
| | | Nominal | | | | | | | | |
| | | Ownership | | | | December 31, 2014 | (1) |
| Date | | % as of | | | | Total | | Encumbered | | Total |
| Acquired | | 12/31/2014 | | Nature of Activity | | Assets | | Assets | | Liabilities |
LW Redstone Company, LLC | 3/23/2010 | | 85% | | Operates four buildings and developing others (2) | | $ | 143,534 |
| | $ | 66,620 |
| | $ | 41,659 |
|
M Square Associates, LLC | 6/26/2007 | | 50% | | Operates two buildings and developing others (3) | | 59,414 |
| | 48,856 |
| | 39,077 |
|
| | | | | | | $ | 202,948 |
| | $ | 115,476 |
| | $ | 80,736 |
|
(1) Excludes amounts eliminated in consolidation.
(2) This joint venture’s property is in Huntsville, Alabama.
(3) This joint venture’s properties are in College Park, Maryland (in the Baltimore/Washington Corridor).
With regard to our consolidated joint ventures:
| |
• | For LW Redstone, LLC, we anticipate funding certain infrastructure costs (up to a maximum of $76.0 million excluding accrued interest thereon) due to be reimbursed by the City of Huntsville as discussed further in Note 9; as of December 31, 2014, we had advanced $49.1 million to the City to fund such costs (included in investing receivables on our consolidated balance sheets, and including accrued interest thereon). We also expect to fund additional development and construction costs through equity contributions to the extent that third party financing is not obtained. Our partner was credited with a $9.0 million capital account upon formation and is not required to make any future equity contributions. While net cash flow distributions to the partners vary depending on the source of the funds distributed, cash flows are generally distributed as follows: |
| |
• | cumulative preferred returns on capital invested to fund the project’s infrastructure costs on a pro rata basis to us and our partner; |
| |
• | cumulative preferred returns on our capital invested to fund the project’s vertical construction; |
| |
• | return of our invested capital; |
| |
• | return of our partner’s capital; |
| |
• | any remaining residual 85% to us and 15% to our partner. |
Our partner has the right to require us to acquire its interest for fair value beginning in March 2020; accordingly, we classify the fair value of our partner’s interest as redeemable noncontrolling interests in the mezzanine section of our consolidated balance sheet. We disclose the activity for this redeemable noncontrolling interest in Note 13. We have the right to purchase our partner’s interest at fair value upon the earlier of five years following the project’s achievement of a construction commencement threshold of 4.4 million square feet or March 2040; the project had achieved 561,000 square feet of construction commencement through December 31, 2014; and
| |
• | For M Square Associates, LLC, net cash flows of this entity will be distributed to the partners as follows: (1) member loans and accrued interest; (2) our preferred return and capital contributions used to fund infrastructure costs; (3) the partners’ preferred returns and capital contributions used to fund all other costs, including the base land value credit, in proportion to the accrued returns and capital accounts; and (4) residual amounts distributed 50% to each member. |
The ventures discussed above include only ones in which parties other than COPLP and COPT own interests.
Corporate Office Properties Trust and Subsidiaries and Corporate Office Properties, L.P. and Subsidiaries
Notes to Consolidated Financial Statements (Continued)
During the periods included herein, we also owned investments in the following consolidated real estate joint ventures:
| |
• | Arundel Preserve #5, LLC, a joint venture owning property in Hanover, Maryland (in the Baltimore/Washington Corridor) and in which we had a 50% nominal ownership interest. On September 17, 2013, we acquired our partner’s noncontrolling interest, along with incremental additional land value in the venture, in exchange for 221,501 common units in COPLP valued at $5.2 million; |
| |
• | MOR Forbes 2 LLC, a joint venture owning property in Lanham, Maryland (in the Baltimore/Washington Corridor) and in which we had a 50% nominal ownership interest. On December 11, 2013, the joint venture sold the property, after which the proceeds were distributed to the partners and there was substantially no remaining business operations or property; and |
| |
• | COPT-FD Indian Head, LLC, a joint venture owning property in Charles County, Maryland (in our “Other” region). On August 7, 2014, the joint venture’s property was repurchased by Charles County under the terms of a development agreement for $6.4 million, after which the proceeds were distributed to the partners and there was no remaining business operations or assets. |
We consolidate the real estate joint ventures described above because we have: (1) the power to direct the matters that most significantly impact the activities of the joint ventures, including development, leasing and management of the properties constructed by the VIEs; and (2) the right to receive returns on our fundings and, in many cases, the obligation to fund the activities of the ventures to the extent that third-party financing is not obtained, both of which could be potentially significant to the VIEs.
Our commitments and contingencies pertaining to our real estate joint ventures are disclosed in Note 23.
Unconsolidated Real Estate Joint Venture
During the periods included herein, we had a 20% ownership interest in an unconsolidated real estate joint venture that operated 16 operating properties, and in which we had a negative investment balance of $6.4 million as of December 31, 2012. We historically accounted for the investment in the joint venture using the equity method of accounting primarily because: (1) we shared with our partner the power to direct the matters that most significantly impact the activities of the joint venture, including the management and operations of the properties and disposal rights with respect to such properties; and (2) our partner had the right to receive benefits and absorb losses that could be significant to the VIE through its proportionately larger investment. We deferred the gain on our initial contribution of property to the joint venture in a prior period due to certain guarantees described in Note 23, and we subsequently recognized losses in excess of our investment due to such guarantees and our intent to support the joint venture. During the fourth quarter of 2012, the holder of the mortgage debt encumbering all of the joint venture’s properties notified us of the debt’s default, initiated foreclosure proceedings and terminated responsibility that we carried for management of the properties; accordingly, we discontinued recognition of losses on this investment under the equity method effective in October 2012 due to our having neither the obligation nor intent to support the joint venture. The carrying amount of our investment in this joint venture was lower than our share of the equity in the joint venture by $4.5 million as of December 31, 2012 due to our deferral of the gain on our contribution of the real estate into the joint venture upon its formation and our discontinuance of loss recognition under the equity method effective October 2012.
On December 6, 2013, the holder of the mortgage debt foreclosed on the properties. As a result, title to the properties was transferred to the mortgage lender and the joint venture was relieved of the debt obligation. The joint venture still had $5.6 million in nonrecourse mezzanine debt as of December 31, 2014; however, the joint venture no longer holds any property or other assets and has ceased all business operations. We continue to be subject to standard nonrecourse loan guarantees relating to this joint venture that are described further in Note 23; however, we assessed the nature of these guarantees and determined that the likelihood of us incurring any liability from these guarantees was remote. Therefore, we recognized a gain on the substantive disposition of our investment in the joint venture in 2013 of $6.3 million, which is included in the line entitled “gain on sales of real estate, net of income taxes” on our consolidated statements of operations.
Under the terms of the agreements governing the joint venture, net cash flows were to be distributed to the partners in proportion to their respective ownership interests. We did not recognize fees from the joint venture for property management, construction and leasing services we provided in 2012.
Corporate Office Properties Trust and Subsidiaries and Corporate Office Properties, L.P. and Subsidiaries
Notes to Consolidated Financial Statements (Continued)
The following table sets forth the condensed statements of operations for this unconsolidated real estate joint venture (in thousands):
|
| | | | | | | | | |
| | | For the Years Ended December 31, |
| | | 2013 | | 2012 |
Revenues | | | $ | 6,519 |
| | $ | 7,316 |
|
Property operating expenses | | | (2,818 | ) | | (2,829 | ) |
Interest expense | | | (10,463 | ) | | (7,672 | ) |
Depreciation and amortization expense | | | (2,067 | ) | | (2,283 | ) |
Gain on early extinguishment of debt | | | 23,013 |
| | — |
|
Net income (loss) | | | $ | 14,184 |
| | $ | (5,468 | ) |
7. Intangible Assets on Real Estate Acquisitions
Intangible assets on real estate acquisitions consisted of the following (in thousands):
|
| | | | | | | | | | | | | | | | | | | | | | | | |
| | December 31, 2014 | | December 31, 2013 |
| | Gross Carrying Amount | | Accumulated Amortization | | Net Carrying Amount | | Gross Carrying Amount | | Accumulated Amortization | | Net Carrying Amount |
In-place lease value | | $ | 123,759 |
| | $ | 101,040 |
| | $ | 22,719 |
| | $ | 125,504 |
| | $ | 93,885 |
| | $ | 31,619 |
|
Tenant relationship value | | 42,301 |
| | 28,492 |
| | 13,809 |
| | 44,414 |
| | 25,962 |
| | 18,452 |
|
Below-market cost arrangements | | 12,415 |
| | 5,984 |
| | 6,431 |
| | 12,416 |
| | 5,136 |
| | 7,280 |
|
Above-market leases | | 8,659 |
| | 8,159 |
| | 500 |
| | 8,925 |
| | 7,970 |
| | 955 |
|
Market concentration premium | | 1,333 |
| | 938 |
| | 395 |
| | 1,333 |
| | 381 |
| | 952 |
|
| | $ | 188,467 |
| | $ | 144,613 |
| | $ | 43,854 |
| | $ | 192,592 |
| | $ | 133,334 |
| | $ | 59,258 |
|
Amortization of the intangible asset categories set forth above totaled $15.2 million in 2014, $16.2 million in 2013 and $21.4 million in 2012. The approximate weighted average amortization periods of the categories set forth above follow: in-place lease value: six years; tenant relationship value: seven years; below-market cost arrangements: 31 years; above-market leases: two years; and market concentration premium: 28 years. The approximate weighted average amortization period for all of the categories combined is ten years. The estimated amortization expense associated with the intangible asset categories set forth above for the next five years is: $9.3 million for 2015; $8.4 million for 2016; $6.2 million for 2017; $3.8 million for 2018; and $3.4 million for 2019.
8. Deferred Leasing and Financing Costs
Deferred leasing and financing costs, net consisted of the following (in thousands): |
| | | | | | | | |
| | December 31, |
| | 2014 | | 2013 |
Deferred leasing costs | | $ | 123,925 |
| | $ | 110,711 |
|
Deferred financing costs | | 31,229 |
| | 36,390 |
|
Accumulated amortization | | (90,357 | ) | | (80,834 | ) |
Deferred leasing and financing costs, net | | $ | 64,797 |
| | $ | 66,267 |
|
Corporate Office Properties Trust and Subsidiaries and Corporate Office Properties, L.P. and Subsidiaries
Notes to Consolidated Financial Statements (Continued)
9. Investing Receivables
Investing receivables, including accrued interest thereon, consisted of the following (in thousands):
|
| | | | | | | | |
| | December 31, |
| | 2014 | | 2013 |
Notes receivable from City of Huntsville | | $ | 49,147 |
| | $ | 44,055 |
|
Other investing loans receivable | | 3,000 |
| | 9,608 |
|
| | $ | 52,147 |
| | $ | 53,663 |
|
Our notes receivable from the City of Huntsville funded infrastructure costs in connection with our LW Redstone Company, LLC joint venture (see Note 6) and carry an interest rate of 9.95%. These notes and the accrued and unpaid interest thereon, which is compounded annually on March 1st, will be repaid using the real estate taxes generated by the properties constructed by the joint venture. When these tax revenues are sufficient to cover the debt service on a certain increment of municipal bonds, the City of Huntsville will be required to issue bonds to repay the notes receivable and the accrued and unpaid interest thereon. Each note has a maturity date of the earlier of 30 years from the date issued or the expiration of the tax increment district comprising the constructed properties in 2045.
We did not have an allowance for credit losses in connection with our investing receivables as of December 31, 2014 or December 31, 2013. The fair value of these receivables approximated their carrying amounts as of December 31, 2014 and December 31, 2013.
10. Prepaid Expenses and Other Assets
Prepaid expenses and other assets consisted of the following (in thousands):
|
| | | | | | | |
| December 31, |
| 2014 | | 2013 |
Prepaid expenses | $ | 20,570 |
| | $ | 19,308 |
|
Lease incentives | 13,344 |
| | 8,435 |
|
Construction contract costs incurred in excess of billings | 6,656 |
| | 2,462 |
|
Furniture, fixtures and equipment, net | 6,637 |
| | 6,556 |
|
Deferred tax asset, net (1) | 4,002 |
| | 4,305 |
|
Operating notes receivable | 3,797 |
| | 1,692 |
|
Other equity method investments | 2,368 |
| | 2,258 |
|
Interest rate derivatives | 274 |
| | 6,594 |
|
Other assets | 2,601 |
| | 2,576 |
|
Prepaid expenses and other assets | $ | 60,249 |
| | $ | 54,186 |
|
(1) See Note 19 for further disclosure.
Operating notes receivable reported above includes amounts due from tenants with remaining terms exceeding one year totaling $3.6 million as of December 31, 2014 and $1.7 million as of December 31, 2013; we carried allowances for estimated losses for $252,000 of the December 31, 2014 balance and $87,000 of the December 31, 2013 balance.
Corporate Office Properties Trust and Subsidiaries and Corporate Office Properties, L.P. and Subsidiaries
Notes to Consolidated Financial Statements (Continued)
11. Debt
Debt Summary
Our debt consisted of the following (dollars in thousands):
|
| | | | | | | | | | | | | | | |
| Maximum | | | | | | | | |
| Availability as of | | Carrying Value as of | | | | Scheduled Maturity |
| December 31,
2014 | | December 31,
2014 | | December 31,
2013 | | Stated Interest Rates as of | | as of |
| | | | December 31, 2014 | | December 31, 2014 |
Mortgage and Other Secured Loans: | |
| | |
| | |
| | | | |
Fixed rate mortgage loans (1) | | | $ | 387,139 |
| | $ | 675,060 |
| | 3.96% - 10.65% (2) | | 2015-2024 |
Variable rate secured loan | | | 36,877 |
| | 37,691 |
| | LIBOR + 2.25% (3) | | November 2015 |
Total mortgage and other secured loans | |
| | 424,016 |
| | 712,751 |
| | | | |
Revolving Credit Facility (4) | $ | 800,000 |
| | 83,000 |
| | — |
| | LIBOR + 0.975% to 1.75% | | July 2017 |
Term Loan Facilities | (5) | | 520,000 |
| | 620,000 |
| | LIBOR + 1.10% to 2.60% (6) | | 2015-2019 |
Unsecured Senior Notes (4) | | | | | | | | | |
3.600% Senior Notes | | | 347,496 |
| | 347,244 |
| | 3.60% | | May 2023 |
5.250% Senior Notes | | | 245,797 |
| | 245,445 |
| | 5.25% | | February 2024 |
3.700% Senior Notes | | | 297,569 |
| | — |
| | 3.70% | | June 2021 |
Unsecured notes payable | | | 1,607 |
| | 1,700 |
| | 0% (7) | | 2026 |
4.25% Exchangeable Senior Notes (4) | | | 572 |
| | 563 |
| | 4.25% | | April 2030 |
Total debt | |
| | $ | 1,920,057 |
| | $ | 1,927,703 |
| | | | |
| |
(1) | Several of the fixed rate mortgages carry interest rates that were above or below market rates upon assumption and therefore were recorded at their fair value based on applicable effective interest rates. The carrying values of these loans reflect net unamortized premiums totaling $42,000 as of December 31, 2014 and $69,000 as of December 31, 2013. |
| |
(2) | The maximum stated interest rate would be 7.87%, excluding the incremental additional interest rate associated with the default rate on a nonrecourse mortgage loan discussed further below. The weighted average interest rate on our fixed rate mortgage loans was 8.10% as of December 31, 2014 (or 6.16% excluding the incremental additional interest rate associated with the default rate on the loan discussed above). |
| |
(3) | The interest rate on the loan outstanding was 2.41% as of December 31, 2014. |
| |
(4) | Refer to the paragraphs below for further disclosure. |
| |
(5) | As discussed below, we have the ability to borrow an additional $180.0 million in the aggregate under these term loan facilities, provided that there is no default under the facilities and subject to the approval of the lenders. |
| |
(6) | The weighted average interest rate on these loans was 1.80% as of December 31, 2014. |
| |
(7) | These notes carry interest rates that were below market rates upon assumption and therefore were recorded at their fair value based on applicable effective interest rates. The carrying value of these notes reflects an unamortized discount totaling $654,000 as of December 31, 2014 and $761,000 as of December 31, 2013. |
All debt is owed by the Operating Partnership. While COPT is not directly obligated by any debt, it has guaranteed the Operating Partnership’s Revolving Credit Facility, Term Loan Facilities, Unsecured Senior Notes and 4.25% Exchangeable Senior Notes.
Certain of our debt instruments require that we comply with a number of restrictive financial covenants, including maximum leverage ratio, unencumbered leverage ratio, minimum net worth, minimum fixed charge coverage, minimum unencumbered interest coverage ratio, minimum debt service and maximum secured indebtedness ratio. In addition, the terms of some of COPLP’s debt may limit its ability to make certain types of payments and other distributions to COPT in the event of default or when such payments or distributions may prompt failure of debt covenants. As of December 31, 2014, we were within the compliance requirements of these financial covenants.
Corporate Office Properties Trust and Subsidiaries and Corporate Office Properties, L.P. and Subsidiaries
Notes to Consolidated Financial Statements (Continued)
Our debt matures on the following schedule (in thousands):
|
| | | | |
2015 | $ | 343,545 |
| (1) |
2016 | 171,399 |
| |
2017 | 339,247 |
| (2) |
2018 | 2,036 |
| |
2019 | 122,094 |
| |
Thereafter | 951,489 |
| |
Total | $ | 1,929,810 |
| (3) |
| |
(1) | Includes $150.0 million pertaining to a nonrecourse mortgage loan on which we defaulted on the payment terms as discussed further below. Also includes $150.0 million that may be extended for two one-year periods at our option, subject to certain conditions. |
(2) Includes $333.0 million that may be extended for one year at our option, subject to certain conditions.
(3) Represents scheduled principal amortization and maturities only and therefore excludes net discounts of $9.8 million.
We capitalized interest costs of $6.1 million in 2014, $8.8 million in 2013 and $13.9 million in 2012.
The following table sets forth information pertaining to the fair value of our debt (in thousands):
|
| | | | | | | | | | | | | | | |
| December 31, 2014 | | December 31, 2013 |
| Carrying | | Estimated | | Carrying | | Estimated |
| Amount | | Fair Value | | Amount | | Fair Value |
Fixed-rate debt | |
| | |
| | |
| | |
|
Unsecured Senior Notes | $ | 890,862 |
| | $ | 901,599 |
| | $ | 592,689 |
| | $ | 575,374 |
|
4.25% Exchangeable Senior Notes | 572 |
| | 575 |
| | 563 |
| | 575 |
|
Other fixed-rate debt | 388,746 |
| | 355,802 |
| | 676,760 |
| | 650,997 |
|
Variable-rate debt | 639,877 |
| | 642,091 |
| | 657,691 |
| | 657,527 |
|
| $ | 1,920,057 |
| | $ | 1,900,067 |
| | $ | 1,927,703 |
| | $ | 1,884,473 |
|
Mortgage and Other Secured Loans
In April 2014, a wholly owned subsidiary defaulted on the payment terms of a $150.0 million nonrecourse mortgage loan secured by 15000 and 15010 Conference Center Drive, two operating properties in Northern Virginia with an aggregate estimated fair value that was less than the loan balance. This loan had an interest rate of 10.65% (including the effect of default interest) and was originally scheduled to mature in 2017. The lender subsequently accelerated the loan’s maturity date to July 2014. Additional disclosure regarding this loan is provided in the Management’s Discussion and Analysis of Financial Condition and Results of Operations section of this Annual Report on Form 10-K.
In December 2014, we completed the defeasance of, and full satisfaction of our obligations with respect to, (1) $103.0 million principal amount of secured nonrecourse mortgage loan due to mature on November 6, 2015 and bearing an interest rate of 5.53% and (2) $108.5 million principal amount of secured nonrecourse mortgage loan due to mature on January 1, 2016 and bearing an interest rate of 5.56%, as well as costs related to the defeasance and satisfaction. As a result, we recognized a loss on early extinguishment of debt of $9.1 million.
Revolving Credit Facility
We have a credit agreement providing for an unsecured revolving credit facility (the “Revolving Credit Facility”) with a group of lenders for which J.P. Morgan Securities LLC and KeyBanc Capital Markets acted as joint lead arrangers and joint book runners, KeyBank National Association acted as administrative agent and JPMorgan Chase Bank, N.A. and Bank of America, N.A. acted as co-syndication agents. The lenders’ aggregate commitment under the facility is $800.0 million, with the ability for us to increase the lenders’ aggregate commitment to $1.3 billion, provided that there is no default under the facility and subject to the approval of the lenders. Amounts available under the facility are computed based on 60% of our unencumbered asset value, as defined in the agreement. The facility matures on July 1, 2017, and may be extended by one year at our option, provided that there is no default under the facility and we pay an extension fee of 0.15% of the total availability under the facility. The interest rate on the facility is based on LIBOR (customarily the 30-day rate) plus 0.975% to 1.750%, as determined by the credit ratings assigned to COPLP by Standard & Poor’s Rating Services, Moody’s Investor Services, Inc. or
Corporate Office Properties Trust and Subsidiaries and Corporate Office Properties, L.P. and Subsidiaries
Notes to Consolidated Financial Statements (Continued)
Fitch Ratings Ltd. (collectively, the “Ratings Agencies”). The facility also carries a quarterly fee that is based on the lenders’ aggregate commitment under the facility multiplied by a per annum rate of 0.125% to 0.350%, as determined by the credit ratings assigned to COPLP by the Ratings Agencies. As of December 31, 2014, the maximum borrowing capacity under this facility totaled $800.0 million, of which $702.2 million was available.
Weighted average borrowings under our Revolving Credit Facility totaled $15.9 million in 2014 and $55.5 million in 2013. The weighted average interest rate on our Revolving Credit Facility was 1.47% in 2014 and 1.74% in 2013.
Term Loan Facilities
Effective September 1, 2011, we entered into an unsecured term loan agreement with the same group of lenders as the Revolving Credit Facility under which we borrowed $400.0 million, with a right for us to borrow an additional $100.0 million, provided that there is no default under the agreement and subject to the approval of the lenders. In 2013, we amended this term loan and repaid $150.0 million of the loan balance. In 2014, we repaid an additional $100.0 million of the loan balance. The term loan matures on September 1, 2015, and may be extended by two one-year periods at our option, provided that there is no default and we pay an extension fee of 0.15% of the total availability of the agreement. The variable interest rate on the term loan is based on the LIBOR rate (customarily the 30-day rate) plus 1.10% to 2.00%, as determined by the credit ratings assigned to COPLP by the Ratings Agencies.
Effective February 14, 2012, we entered into an unsecured term loan agreement with a group of lenders for which J.P. Morgan Securities LLC and KeyBank Capital Markets acted as joint lead arrangers and joint book runners, KeyBank National Association acted as administrative agent and JPMorgan Chase Bank, N.A. acted as syndication agent. We borrowed $250.0 million under the term loan. The term loan matures on February 14, 2017, and may be extended by one year at our option, provided that there is no default and we pay an extension fee of 0.15% of the total availability of the agreement. The variable interest rate on the loan is based on the LIBOR rate (customarily the 30-day rate) plus 1.10% to 2.00%, as determined by the credit ratings assigned to COPLP by the Ratings Agencies.
Effective August 3, 2012, we entered into an unsecured term loan agreement with a group of lenders for which Wells Fargo Securities, LLC acted as sole arranger and sole book runner, Wells Fargo Bank, National Association acted as administrative agent and Capital One, N.A. acted as documentation agent. We borrowed $120.0 million under the term loan, with the ability for us to borrow an additional $80.0 million, provided that there is no default under the loan and subject to the approval of the lenders. The term loan matures on August 2, 2019. The variable interest rate on the loan is based on the LIBOR rate (customarily the 30-day rate) plus 2.10% to 2.60%, as determined by our leverage levels.
Unsecured Senior Notes
In 2013 and 2014, we issued the following senior notes:
| |
• | a $350.0 million aggregate principal amount of 3.600% Senior Notes at an initial offering price of 99.816% of their face value on May 6, 2013, resulting in proceeds, after deducting discounts of the initial purchasers of the notes, but before other offering expenses, of $347.1 million. The notes mature on May 15, 2023. The carrying value of these notes reflects an unamortized discount totaling $2.5 million as of December 31, 2014 and $2.8 million as of December 31, 2013. The effective interest rate under the notes, including amortization of the issuance costs, was 3.70%; |
| |
• | a $250.0 million aggregate principal amount of 5.250% Senior Notes at an initial offering price of 98.783% of their face value on September 16, 2013, resulting in proceeds, after deducting underwriting discounts, but before other offering expenses, of $245.3 million. The notes mature on February 15, 2024. The carrying value of these notes reflects an unamortized discount totaling $4.2 million as of December 31, 2014 and $4.6 million as of December 31, 2013. The effective interest rate under the notes, including amortization of the issuance costs, was 5.49%; and |
| |
• | a $300.0 million aggregate principal amount of 3.700% Senior Notes at an initial offering price of 99.739% of their face value on May 14, 2014, resulting in proceeds, after deducting underwriting discounts, but before other offering expenses, of $297.3 million. The notes mature on June 15, 2021. The carrying value of these notes reflects an unamortized discount totaling $2.4 million as of December 31, 2014. The effective interest rate under the notes, including amortization of the issuance costs, was 3.85%. |
We may redeem these notes, in whole at any time or in part from time to time, at our option, at a redemption price equal to the greater of (1) the aggregate principal amount of the notes being redeemed or (2) the sum of the present values of the remaining
Corporate Office Properties Trust and Subsidiaries and Corporate Office Properties, L.P. and Subsidiaries
Notes to Consolidated Financial Statements (Continued)
scheduled payments of principal and interest thereon (not including any portion of such payments of interest accrued as of the date of redemption) discounted to its present value, on a semi-annual basis at an adjusted treasury rate plus a spread (30 basis points for the 3.600% Senior Notes, 40 basis points for the 5.250% Senior Notes and 25 basis points for the 3.700% Senior Notes), plus, in each case, accrued and unpaid interest thereon to the date of redemption. However, in each case, if this redemption occurs on or after three months prior to the maturity date, the redemption price will be equal to 100% of the principal amount of the notes being redeemed, plus accrued and unpaid interest thereon to, but not including, the applicable redemption date. These notes are unconditionally guaranteed by COPT.
Exchangeable Senior Notes
In 2010, COPLP issued a $240.0 million aggregate principal amount of 4.25% Exchangeable Senior Notes due 2030. In 2013, we repaid $239.4 million principal amount of these notes and recognized a $25.9 million loss on early extinguishment of debt. The carrying value of these notes included a principal amount of $575,000 and an unamortized discount totaling $3,000 as of December 31, 2014 and $12,000 as of December 31, 2013. Interest on the notes is payable on April 15 and October 15 of each year. These notes have an exchange settlement feature that provides that the notes may, under certain circumstances, be exchangeable for cash and, at COPLP’s discretion, COPT common shares at an exchange rate (subject to adjustment) of 20.8513 shares per one thousand dollar principal amount of the notes (exchange rate is as of December 31, 2014 and is equivalent to an exchange price of $47.96 per common share) (the initial exchange rate of the notes was based on a 20% premium over the closing price on the NYSE on the transaction pricing date). On or after April 20, 2015, COPLP may redeem the notes in cash in whole or in part. The holders of the notes have the right to require us to repurchase the notes in cash in whole or in part on each of April 15, 2015, April 15, 2020 and April 15, 2025, or in the event of a “fundamental change,” as defined under the terms of the notes, for a repurchase price equal to 100% of the principal amount of the notes plus accrued and unpaid interest. The notes are general unsecured senior obligations of COPLP and rank equally in right of payment with all other senior unsecured indebtedness of COPLP and are guaranteed by COPT. The effective interest rate under the notes, including amortization of the issuance costs, was 6.05%. Because the closing price of COPT’s common shares at December 31, 2014 and 2013 was less than the exchange price per common share applicable to these notes, the if-converted value of the notes did not exceed the principal amount. The table below sets forth interest expense recognized on these notes (in thousands):
|
| | | | | | | | | | | |
| For the Years Ended December 31, |
| 2014 | | 2013 | | 2012 |
Interest expense at stated interest rate | $ | 24 |
| | $ | 4,208 |
| | $ | 10,200 |
|
Interest expense associated with amortization of discount | 10 |
| | 1,615 |
| | 3,651 |
|
Total | $ | 34 |
| | $ | 5,823 |
| | $ | 13,851 |
|
12. Interest Rate Derivatives
The following table sets forth the key terms and fair values of our interest rate swap derivatives (dollars in thousands):
|
| | | | | | | | | | | | | | | | | | | |
| | | | | | | | | | Fair Value at |
Notional | | | | | | Effective | | Expiration | | December 31, |
Amount | | Fixed Rate | | Floating Rate Index | | Date | | Date | | 2014 | | 2013 |
$ | 100,000 |
| | 0.8320 | % | | One-Month LIBOR | | 1/3/2012 | | 9/1/2015 | | $ | (407 | ) | | $ | (861 | ) |
100,000 |
| | 0.8320 | % | | One-Month LIBOR | | 1/3/2012 | | 9/1/2015 | | (407 | ) | | (861 | ) |
36,877 |
| (1) | 3.8300 | % | | One-Month LIBOR + 2.25% | | 11/2/2010 | | 11/2/2015 | | (400 | ) | | (832 | ) |
100,000 |
| | 0.8055 | % | | One-Month LIBOR | | 9/2/2014 | | 9/1/2016 | | (317 | ) | | (94 | ) |
100,000 |
| | 0.8100 | % | | One-Month LIBOR | | 9/2/2014 | | 9/1/2016 | | (324 | ) | | (105 | ) |
100,000 |
| | 1.6730 | % | | One-Month LIBOR | | 9/1/2015 | | 8/1/2019 | | 239 |
| | 3,377 |
|
100,000 |
| | 1.7300 | % | | One-Month LIBOR | | 9/1/2015 | | 8/1/2019 | | 35 |
| | 3,217 |
|
100,000 |
| | 0.6123 | % | | One-Month LIBOR | | 1/3/2012 | | 9/1/2014 | | — |
| | (279 | ) |
100,000 |
| | 0.6100 | % | | One-Month LIBOR | | 1/3/2012 | | 9/1/2014 | | — |
| | (277 | ) |
|
| | |
| | | | | | | | $ | (1,581 | ) | | $ | 3,285 |
|
| |
(1) | The notional amount of this instrument is scheduled to amortize to $36.2 million. |
Corporate Office Properties Trust and Subsidiaries and Corporate Office Properties, L.P. and Subsidiaries
Notes to Consolidated Financial Statements (Continued)
Each of the one-month LIBOR interest rate swaps set forth in the table above was designated as a cash flow hedge of interest rate risk.
The table below sets forth the fair value of our interest rate derivatives as well as their classification on our consolidated balance sheets (in thousands):
|
| | | | | | | | | | | | |
| | December 31, 2014 | | December 31, 2013 |
Derivatives | | Balance Sheet Location | | Fair Value | | Balance Sheet Location | | Fair Value |
Interest rate swaps designated as cash flow hedges | | Prepaid expenses and other assets | | $ | 274 |
| | Prepaid expenses and other assets | | $ | 6,594 |
|
Interest rate swaps designated as cash flow hedges | | Interest rate derivatives | | (1,855 | ) | | Interest rate derivatives | | (3,309 | ) |
The table below presents the effect of our interest rate derivatives on our consolidated statements of operations and comprehensive income (in thousands):
|
| | | | | | | | | | | |
| For the Years Ended December 31, |
| 2014 | | 2013 | | 2012 |
Amount of (losses) gains recognized in accumulated other comprehensive income (loss) (“AOCI”) (effective portion) | $ | (7,799 | ) | | $ | 6,791 |
| | $ | (7,676 | ) |
Amount of losses reclassified from AOCI into interest expense (effective portion) | 2,990 |
| | 2,740 |
| | 3,697 |
|
Amount of loss reclassified from AOCI into loss on early extinguishment of debt | 38 |
| | — |
| | — |
|
Over the next 12 months, we estimate that approximately $2.9 million of losses will be reclassified from AOCI as an increase to interest expense.
We have agreements with each of our interest rate derivative counterparties that contain provisions under which, if we default or are capable of being declared in default on defined levels of our indebtedness, we could also be declared in default on our derivative obligations. These agreements also incorporate the loan covenant provisions of our indebtedness with a lender affiliate of the derivative counterparties. Failure to comply with the loan covenant provisions could result in our being declared in default on any derivative instrument obligations covered by the agreements. As of December 31, 2014, the fair value of interest rate derivatives in a liability position related to these agreements was $1.9 million, excluding the effects of accrued interest. As of December 31, 2014, we had not posted any collateral related to these agreements. We are not in default with any of these provisions. If we breached any of these provisions, we could be required to settle our obligations under the agreements at their termination value of $2.1 million.
13. Redeemable Noncontrolling Interest
The table below sets forth the activity in a redeemable noncontrolling interest in a consolidated real estate joint venture described in Note 6 (in thousands):
|
| | | | | | | | | | | | |
| | For the Years Ended December 31, |
| | 2014 | | 2013 | | 2012 |
Beginning balance | | $ | 17,758 |
| | $ | 10,298 |
| | $ | 8,908 |
|
Distribution to noncontrolling interest | | (1,369 | ) | | (1,037 | ) | | — |
|
Net income (loss) attributable to noncontrolling interest | | 2,162 |
| | 1,376 |
| | (2,565 | ) |
Adjustment to arrive at fair value of interest | | (134 | ) | | 7,121 |
| | 3,955 |
|
Ending balance | | $ | 18,417 |
| | $ | 17,758 |
| | $ | 10,298 |
|
Corporate Office Properties Trust and Subsidiaries and Corporate Office Properties, L.P. and Subsidiaries
Notes to Consolidated Financial Statements (Continued)
14. Equity - COPT and Subsidiaries
Preferred Shares
As of December 31, 2014, COPT had 25.0 million preferred shares authorized at $0.01 par value per share. The table below sets forth additional information pertaining to COPT’s outstanding preferred shares (dollars in thousands, except per share data):
|
| | | | | | | | | | | | | | | | | | |
Series | | # of Shares Issued | | Aggregate Liquidation Preference | | Month of Issuance | | Annual Dividend Yield | | Annual Dividend Per Share | | Earliest Redemption Date |
Series K | | 531,667 |
| | $ | 26,583 |
| | January 2007 | | 5.600 | % | | $ | 2.80000 |
| | 1/9/2017 |
Series L | | 6,900,000 |
| | 172,500 |
| | June 2012 | | 7.375 | % | | $ | 1.84375 |
| | 6/27/2017 |
| | 7,431,667 |
| | $ | 199,083 |
| | | | | | | | |
Each series of preferred shares is nonvoting and redeemable for cash in the amount of its liquidation preference at COPT’s option on or after the earliest redemption date. The Series K Cumulative Redeemable Preferred Shares are also convertible, subject to certain conditions, into common shares on the basis of 0.8163 common shares for each preferred share. Holders of all preferred shares are entitled to cumulative dividends, payable quarterly (as and if declared by the Board of Trustees). In the case of each series of preferred shares, there is a series of COPLP preferred units owned by COPT that carries substantially the same terms.
During 2013 and 2014, COPT redeemed all of the outstanding shares of its following series of preferred shares:
| |
• | the 7.625% Series J Preferred Shares on April 22, 2013 at a price of $25.00 per share, or $84.8 million in the aggregate, plus accrued and unpaid dividends thereon through the date of redemption, and recognized a $2.9 million decrease to net income available to common shareholders pertaining to the shares’ original issuance costs incurred at the time of the redemption; and |
| |
• | the 7.500% Series H Preferred Shares on June 16, 2014 at a price of $25.00 per share, or $50.0 million in the aggregate, plus accrued and unpaid dividends thereon through the date of redemption, and recognized a $1.8 million decrease to net income available to common shareholders pertaining to the shares’ original issuance costs incurred at the time of the redemption. |
Common Shares
During 2013 and 2014, COPT completed the following public offerings of common shares:
| |
• | 4.485 million common shares in March 2013 at a public offering price of $26.34 per share for net proceeds of $118.1 million after underwriter discounts but before offering expenses; and |
| |
• | 5.52 million common shares in November 2014 at a public offering price of $27.30 per share for net proceeds of $148.9 million after underwriter discounts but before offering expenses. |
COPT contributed the net proceeds from these issuances to COPLP in exchange for an equal number of units in COPLP.
In October 2012, COPT established an at-the-market (“ATM”) stock offering program under which it may, from time to time, offer and sell common shares in “at the market” stock offerings having an aggregate gross sales price of up to $150.0 million. Through December 31, 2014, COPT’s only issuance under the program was 1.5 million common shares issued on July 15, 2013 at a weighted average price of $26.05 per share under the ATM program; net proceeds from the shares issued totaled $38.5 million, after payment of $586,000 in commissions to sales agents; the proceeds from these shares were contributed to COPLP in exchange for an equal number of common units in COPLP. COPT’s remaining capacity under the ATM Plan is an aggregate gross sales price of $110.9 million in stock sales.
Holders of COPLP common units converted their units into COPT common shares on the basis of one common share for each common unit in the amount of 140,149 in 2014 and 311,343 in 2013.
COPT declared dividends per common share of $1.10 in 2014, 2013 and 2012.
Corporate Office Properties Trust and Subsidiaries and Corporate Office Properties, L.P. and Subsidiaries
Notes to Consolidated Financial Statements (Continued)
See Note 16 for disclosure of common share activity pertaining to our share-based compensation plans.
15. Equity - COPLP and Subsidiaries
General Partner Preferred Units
The table below sets forth information pertaining to preferred units in COPLP held by COPT at December 31, 2014 (dollars in thousands, except per unit data): |
| | | | | | | | | | | | | | | | | | |
Series | | # of Units Issued | | Aggregate Liquidation Preference | | Month of Issuance | | Annual Distribution Yield | | Annual Distribution Per Unit | | Earliest Redemption Date |
Series K | | 531,667 |
| | $ | 26,583 |
| | January 2007 | | 5.600 | % | | $ | 2.80000 |
| | 1/9/2017 |
Series L | | 6,900,000 |
| | 172,500 |
| | June 2012 | | 7.375 | % | | $ | 1.84375 |
| | 6/27/2017 |
| | 7,431,667 |
| | $ | 199,083 |
| | | | | | | | |
In the case of each series of preferred units, COPT had preferred shares that carry substantially the same terms. Each series of preferred units are redeemable for cash in the amount of its liquidation preference at our option on or after the earliest redemption date. The Series K Preferred Units are also convertible, subject to certain conditions, into common units on the basis of 0.8163 common units for each preferred unit. COPT, as holder of these preferred units, is entitled to cumulative distributions, payable quarterly (as and if declared by the Board of Trustees).
In 2013 and 2014, COPLP redeemed all of the outstanding units of its following series of preferred units held by COPT:
| |
• | the 7.625% Series J Preferred Units on April 22, 2013 at a price of $25.00 per unit, or $84.8 million in the aggregate, plus accrued and unpaid distributions thereon through the date of redemption, and recognized a $2.9 million decrease to net income available to common unitholders pertaining to the units’ original issuance costs at the time of the redemption; and |
| |
• | the 7.500% Series H Preferred Units on June 16, 2014 at a price of $25.00 per unit, or $50.0 million in the aggregate, plus accrued and unpaid distributions thereon through the date of redemption, and recognized a $1.8 million decrease to net income available to common unitholders pertaining to the units’ original issuance costs at the time of the redemption. |
Limited Partner Preferred Units
COPLP has 352,000 Series I Preferred Units issued to an unrelated party that have an aggregate liquidation preference of $8.8 million ($25.00 per unit), plus any accrued and unpaid distributions of return thereon (as described below), and may be redeemed for cash by COPLP at COPLP’s option any time after September 22, 2019. The owner of these units is entitled to a priority annual cumulative return equal to 7.5% of their liquidation preference through September 22, 2019; the annual cumulative preferred return increases for each subsequent five-year period, subject to certain maximum limits. These units are convertible into common units on the basis of 0.5 common units for each Series I Preferred Unit; the resulting common units would then be exchangeable for COPT common shares in accordance with the terms of COPLP’s agreement of limited partnership.
Common Units
COPT owned 96.0% of COPLP’s common units as of December 31, 2014 and 95.6% as of December 31, 2013.
During 2013 and 2014, COPT acquired additional common units through the following public offerings of common shares:
| |
• | 4.485 million common shares in March 2013 at a public offering price of $26.34 per share for net proceeds of $118.1 million (after underwriter discounts but before offering expenses) that were contributed to COPLP in exchange for an equal number of common units in COPLP; and |
| |
• | 5.52 million common shares in November 2014 at a public offering price of $27.30 per share for net proceeds of $148.9 million (after underwriter discounts but before offering expenses) that were contributed to COPLP in exchange for an equal number of common units in COPLP. |
On July 15, 2013, COPT issued 1.5 million common shares at a weighted average price of $26.05 per share, representing its only issuance under the ATM program through December 31, 2014. Net proceeds from the shares issued totaled $38.5
Corporate Office Properties Trust and Subsidiaries and Corporate Office Properties, L.P. and Subsidiaries
Notes to Consolidated Financial Statements (Continued)
million, after payment of $586,000 in commissions to sales agents. The common shares were contributed to COPLP in exchange for 1.5 million common units.
Limited partners in COPLP holding common units have the right to require COPLP to redeem all or a portion of their common units. COPLP (or COPT as the general partner) has the right, in its sole discretion, to deliver to such redeeming limited partners for each partnership unit either one COPT common share (subject to anti-dilution adjustment) or a cash payment equal to the then fair market value of such share (so adjusted) (based on the formula for determining such value set forth in the partnership agreement). Limited partners holding common units redeemed their units into common shares on the basis of one common share for each common unit in the amount of 140,149 in 2014 and 311,343 in 2013.
We declared distributions per common unit of $1.10 in 2014, 2013 and 2012.
16. Share-Based Compensation and Other Compensation Matters
Share-Based Compensation Plans
In May 2010, COPT adopted the Amended and Restated 2008 Omnibus Equity and Incentive Plan. COPT may issue equity-based awards under this plan to officers, employees, non-employee trustees and any other key persons of us and our subsidiaries, as defined in the plan. The plan provides for a maximum of 5.9 million common shares in COPT to be issued in the form of options, share appreciation rights, deferred share awards, restricted share awards, unrestricted share awards, performance shares, dividend equivalent rights and other equity-based awards and for the granting of cash-based awards. The plan expires on May 13, 2020.
In March 1998, COPT adopted a long-term incentive plan for our Trustees and employees. This plan, which expired in March 2008, provided for the award of options, restricted shares and dividend equivalents.
Grants of restricted shares and options under these plans to nonemployee Trustees generally vest on the first anniversary of the grant date provided that the Trustee remains in his or her position. Restricted shares and options granted to employees vest based on increments and over periods of time set forth under the terms of the respective awards provided that the employees remain employed by us. Options expire ten years after the date of grant. Shares for each of the share-based compensation plans are issued under registration statements on Form S-8 that became effective upon filing with the Securities and Exchange Commission. In connection with awards of common shares granted by COPT under such share-based compensation plans, COPLP issues to COPT an equal number of equity instruments with identical terms.
Corporate Office Properties Trust and Subsidiaries and Corporate Office Properties, L.P. and Subsidiaries
Notes to Consolidated Financial Statements (Continued)
The following table summarizes restricted share transactions under the share-based compensation plans for 2012, 2013 and 2014:
|
| | | | | | | |
| | Shares | | Weighted Average Grant Date Fair Value |
Unvested at December 31, 2011 | | 648,378 |
| | $ | 33.13 |
|
Granted | | 177,662 |
| | 23.64 |
|
Forfeited | | (17,019 | ) | | 31.43 |
|
Vested | | (374,378 | ) | | 32.72 |
|
Unvested at December 31, 2012 | | 434,643 |
| | 29.67 |
|
Granted | | 193,833 |
| | 25.91 |
|
Forfeited | | (9,541 | ) | | 27.59 |
|
Vested | | (241,487 | ) | | 30.97 |
|
Unvested at December 31, 2013 | | 377,448 |
| | 26.96 |
|
Granted | | 216,607 |
| | 26.73 |
|
Forfeited | | (21,335 | ) | | 25.10 |
|
Vested | | (182,213 | ) | | 28.56 |
|
Unvested at December 31, 2014 | | 390,507 |
| | $ | 26.19 |
|
Unvested shares as of December 31, 2014 that are expected to vest | | 375,686 |
| | $ | 26.18 |
|
The aggregate intrinsic value of restricted shares that vested was $4.9 million in 2014, $6.3 million in 2013 and $9.0 million in 2012.
Our Board of Trustees made the following grants of PSUs to executives from 2011 through 2014 (dollars in thousands):
|
| | | | | | | | | | | | | | |
Grant Date | | Number of PSUs Granted | | Performance Period Commencement Date | | Performance Period End Date | | Grant Date Fair Value | | Number of PSUs Outstanding as of December 31, 2014 |
3/3/2011 | | 56,883 |
| | 3/3/2011 | | 3/2/2014 | | $ | 2,796 |
| | — |
|
3/1/2012 | | 54,070 |
| | 1/1/2012 | | 12/31/2014 | | 1,772 |
| | 54,070 |
|
3/1/2013 | | 69,579 |
| | 1/1/2013 | | 12/31/2015 | | 1,867 |
| | 69,579 |
|
3/6/2014 | | 49,103 |
| | 1/1/2014 | | 12/31/2016 | | 1,723 |
| | 49,103 |
|
The PSUs each have three year performance periods concluding on the earlier of the respective performance period end dates set forth above or the date of: (1) termination by us without cause, death or disability of the executive or constructive discharge of the executive (collectively, “qualified termination”); or (2) a sale event. The number of PSUs earned (“earned PSUs”) at the end of the performance period will be determined based on the percentile rank of COPT’s total shareholder return relative to a peer group of companies, as set forth in the following schedule:
|
| | |
Percentile Rank | | Earned PSUs Payout % |
75th or greater | | 200% of PSUs granted |
50th or greater | | 100% of PSUs granted |
25th | | 50% of PSUs granted |
Below 25th | | 0% of PSUs granted |
Corporate Office Properties Trust and Subsidiaries and Corporate Office Properties, L.P. and Subsidiaries
Notes to Consolidated Financial Statements (Continued)
If the percentile rank exceeds the 25th percentile and is between two of the percentile ranks set forth in the table above, then the percentage of the earned PSUs will be interpolated between the ranges set forth in the table above to reflect any performance between the listed percentiles. At the end of the performance period, we, in settlement of the award, will issue a number of fully-vested COPT common shares equal to the sum of:
| |
• | the number of earned PSUs in settlement of the award plan; plus |
| |
• | the aggregate dividends that would have been paid with respect to the common shares issued in settlement of the earned PSUs through the date of settlement had such shares been issued on the grant date, divided by the share price on such settlement date, as defined under the terms of the agreement. |
If a performance period ends due to a sale event or qualified termination, the number of earned PSUs is prorated based on the portion of the three-year performance period that has elapsed. If employment is terminated by the employee or by us for cause, all PSUs are forfeited. PSUs do not carry voting rights.
Based on COPT’s total shareholder return relative to its peer group of companies:
| |
• | for the 2011 PSUs that vested in 2014, there was no payout value in connection with the vesting; and |
| |
• | for the 2012 PSUs that vested on December 31, 2014 to be paid out in 2015, approximately 40,000 shares will be issued in March 2015 in connection with the vesting. |
We computed grant date fair values for PSUs using Monte Carlo models and are recognizing these values over three-year periods that commenced on the respective grant dates. The grant date fair value and certain of the assumptions used in the Monte Carlo models for the PSUs granted in 2012, 2013 and 2014 are set forth below: |
| | | | | | | | | | | | |
| | For the Years Ended December 31, |
| | 2014 | | 2013 | | 2012 |
Grant date fair value | | $ | 35.09 |
| | $ | 26.84 |
| | $ | 32.77 |
|
Baseline common share value | | $ | 26.52 |
| | $ | 25.85 |
| | $ | 24.39 |
|
Expected volatility of common shares | | 28.6 | % | | 29.5 | % | | 43.2 | % |
Risk-free interest rate | | 0.66 | % | | 0.33 | % | | 0.41 | % |
Corporate Office Properties Trust and Subsidiaries and Corporate Office Properties, L.P. and Subsidiaries
Notes to Consolidated Financial Statements (Continued)
The following table summarizes option transactions under the share-based compensation plans for 2012, 2013 and 2014 (dollars in thousands, except per share data): |
| | | | | | | | | | | | | | | |
| | Shares | | Range of Exercise Price per Share | | Weighted Average Exercise Price per Share | | Weighted Average Remaining Contractual Term (in Years) | | Aggregate Intrinsic Value |
Outstanding at December 31, 2011 | | 945,422 |
| | $13.40 - $57.00 | | $ | 36.63 |
| | 4 | | $ | 510 |
|
Forfeited/Expired – 2012 | | (85,588 | ) | | $25.52 - $57.00 | | $ | 42.98 |
| | | | |
Exercised – 2012 | | (61,624 | ) | | $13.40 - $22.49 | | $ | 15.08 |
| | | | |
Outstanding at December 31, 2012 | | 798,210 |
| | $13.60 - $57.00 | | $ | 37.62 |
| | 3 | | $ | 325 |
|
Forfeited/Expired – 2013 | | (117,952 | ) | | $18.08 - $51.62 | | $ | 40.91 |
| | | | |
Exercised – 2013 | | (39,331 | ) | | $13.60 - $26.24 | | $ | 19.67 |
| | | | |
Outstanding at December 31, 2013 | | 640,927 |
| | $19.63 - $56.00 | | $ | 38.11 |
| | 2 | | $ | 68 |
|
Forfeited/Expired – 2014 | | (18,303 | ) | | $22.34 - $49.60 | | $ | 42.12 |
| | | | |
Exercised – 2014 | | (62,888 | ) | | $19.63 - $28.15 | | $ | 23.70 |
| | | | |
Outstanding at December 31, 2014 | | 559,736 |
| | $25.52 - $56.00 | | $ | 39.60 |
| | 2 | | $ | 167 |
|
Exercisable at December 31, 2012 | | 798,210 |
| | (1) | | $ | 37.62 |
| | | | |
Exercisable at December 31, 2013 | | 640,927 |
| | (2) | | $ | 38.11 |
| | | | |
Exercisable at December 31, 2014 | | 559,736 |
| | (3) | | $ | 39.60 |
| | | | |
| | | | | | | | | | |
| |
(1) | 9,500 of these options had an exercise price ranging from $13.60 to $16.73; 204,736 had an exercise price ranging from $16.74 to $30.04; 180,962 had an exercise price ranging from $30.05 to $41.28; and 403,012 had an exercise price ranging from $41.29 to $57.00. |
| |
(2) | 171,288 of these options had an exercise price ranging from $19.63 to $30.04; 145,187 had an exercise price ranging from$30.05 to $41.28; 160,402 had an exercise price ranging from $41.29 to $42.74; and 164,050 had an exercise price ranging from $42.75 to $56.00. |
| |
(3) | 105,672 of these options had an exercise price ranging from $25.52 to $30.04; 142,862 had an exercise price ranging from$30.05 to $41.28; 158,902 had an exercise price ranging from $41.29 to $42.74; and 152,300 had an exercise price ranging from $42.75 to $56.00. |
The aggregate intrinsic value of options exercised was $225,000 in 2014, $258,000 in 2013 and $553,000 in 2012.
We own a taxable REIT subsidiary that is subject to Federal and state income taxes. We realized a windfall tax (loss) benefit of $(3,000) in 2014, $(122,000) in 2013 and $43,000 in 2012 on options exercised and vesting restricted shares in connection with employees of that subsidiary.
The table below sets forth our reporting for share based compensation expense (in thousands): |
| | | | | | | | | | | | |
| | For the Years Ended December 31, |
| | 2014 | | 2013 | | 2012 |
General, administrative and leasing expenses | | $ | 5,307 |
| | $ | 5,412 |
| | $ | 8,611 |
|
Property operating expenses | | 857 |
| | 1,118 |
| | 1,371 |
|
Capitalized to development activities | | 886 |
| | 1,075 |
| | 1,202 |
|
Share-based compensation expense | | $ | 7,050 |
| | $ | 7,605 |
| | $ | 11,184 |
|
The amounts included in our consolidated statements of operations for share-based compensation reflected an estimate of pre-vesting forfeitures of 0% for PSUs and 0% to 5% for restricted shares.
As of December 31, 2014, all of our options are vested and fully expensed. As of December 31, 2014, there was $6.3 million of unrecognized compensation cost related to unvested restricted shares that is expected to be recognized over a weighted average period of approximately two years. As of December 31, 2014, there was $1.9 million of unrecognized compensation cost related to PSUs that is expected to be recognized over a weighted average performance period of approximately two years.
Corporate Office Properties Trust and Subsidiaries and Corporate Office Properties, L.P. and Subsidiaries
Notes to Consolidated Financial Statements (Continued)
401(k) Plan
We have a 401(k) defined contribution plan covering substantially all of our employees that permits participants to contribute up to 90% of their compensation, as defined in the Plan, per pay period on a before-tax basis or after-tax basis, or a combination of both, subject to limitations under the Internal Revenue Code of 1986 ( the “IRC”), as amended. Participants who are 50 years of age or older by the end of a particular plan year and have contributed the maximum 401(k) deferral amount allowed under the plan for that year are eligible to contribute an additional portion of their annual compensation on a before-tax basis as catch-up contributions, up to the annual limit under the IRC. We match 100% of the first 1% of pre-tax and/or after-tax contributions that participants contribute to the plan and 50% of the next 5% in participant contributions to the plan (representing an aggregate match by us of 3.5% on the first 6% of participant pre-tax and/or after-tax contributions to the plan). Participants’ contributions are fully vested. Participants are 50% vested in matching contributions after one year of credited service and 100% vested after two years of credited service. We fund all contributions with cash. Our matching contributions under the plan totaled approximately $1.2 million in 2014, $1.1 million in 2013 and $1.1 million in 2012. The 401(k) plan is fully funded as of December 31, 2014.
Deferred Compensation Plan
COPT has a non-qualified elective deferred compensation plan for certain members of our management team that permits participants to defer up to 100% of their compensation on a pre-tax basis and receive a tax-deferred return on such deferrals. The balance of the plan, which was fully funded, totaled $5.9 million as of December 31, 2014 and $7.5 million as of December 31, 2013, and is included in the accompanying COPT consolidated balance sheets.
Executive Transition Costs
In connection with the departure on February 3, 2015 of Stephen E. Riffee, our Executive Vice President and Chief Financial Officer, and the retirement on March 31, 2012 of Randall M. Griffin, our former Chief Executive Officer, we recognized executive transition costs of $1.1 million in 2014 and $2.2 million in 2012. These costs, which are included in general administrative expense, represent incremental compensation costs associated with the executives’ employment separation, including cash and share-based compensation and post-employment benefits.
17. Operating Leases
We lease our properties to tenants under operating leases with various expiration dates extending to the year 2030. Gross minimum future rentals on noncancelable leases in our properties as of December 31, 2014 were as follows (in thousands): |
| | | | |
Year Ending December 31, | | |
2015 | | $ | 349,099 |
|
2016 | | 301,184 |
|
2017 | | 263,428 |
|
2018 | | 202,661 |
|
2019 | | 154,044 |
|
Thereafter | | 312,304 |
|
| | $ | 1,582,720 |
|
Corporate Office Properties Trust and Subsidiaries and Corporate Office Properties, L.P. and Subsidiaries
Notes to Consolidated Financial Statements (Continued)
18. Information by Business Segment
We have ten reportable operating office property segments (comprised of: the Baltimore/Washington Corridor; Northern Virginia; San Antonio; Huntsville; Washington, DC — Capitol Riverfront; St. Mary’s and King George Counties; Greater Baltimore; Greater Philadelphia; Colorado Springs; and Other). We also have an operating wholesale data center segment. The table below reports segment financial information for our reportable segments (in thousands). We measure the performance of our segments through the measure we define as NOI from real estate operations, which is derived by subtracting property operating expenses from revenues from real estate operations.
|
| | | | | | | | | | | | | | | | | | | | | | | | | | | | | | | | | | | | | | | | | | | | | | | |
| Operating Office Property Segments | | | | |
| Baltimore/ Washington Corridor | | Northern Virginia | | San Antonio | | Huntsville | | Washington, DC - Capitol Riverfront | | St. Mary’s & King George Counties | | Greater Baltimore | | Greater Philadelphia | | Colorado
Springs | | Other | | Operating Wholesale Data Center | | Total |
Year Ended December 31, 2014 | |
| | |
| | |
| | | | |
| | |
| | |
| | |
| | |
| | |
| | |
| | |
|
Revenues from real estate operations | $ | 236,191 |
| | $ | 89,263 |
| | $ | 36,377 |
| | $ | 10,446 |
| | $ | 14,599 |
| | $ | 16,736 |
| | $ | 43,591 |
| | $ | 11,929 |
| | $ | (1 | ) | | $ | 10,150 |
| | $ | 10,430 |
| | $ | 479,711 |
|
Property operating expenses | 81,132 |
| | 31,532 |
| | 20,562 |
| | 3,066 |
| | 7,308 |
| | 5,268 |
| | 17,778 |
| | 4,386 |
| | 12 |
| | 1,469 |
| | 7,286 |
| | 179,799 |
|
NOI from real estate operations | $ | 155,059 |
| | $ | 57,731 |
| | $ | 15,815 |
| | $ | 7,380 |
| | $ | 7,291 |
| | $ | 11,468 |
| | $ | 25,813 |
| | $ | 7,543 |
| | $ | (13 | ) | | $ | 8,681 |
| | $ | 3,144 |
| | $ | 299,912 |
|
Additions to long-lived assets | $ | 24,174 |
| | $ | 17,447 |
| | $ | (6 | ) | | $ | 4,077 |
| | $ | 1,185 |
| | $ | 8,825 |
| | $ | 7,925 |
| | $ | 952 |
| | $ | — |
| | $ | — |
| | $ | 22 |
| | $ | 64,601 |
|
Transfers from non-operating properties | $ | 56,699 |
| | $ | 43,154 |
| | $ | — |
| | $ | 21,014 |
| | $ | — |
| | $ | — |
| | $ | 3,550 |
| | $ | 16,344 |
| | $ | 30 |
| | $ | — |
| | $ | 1,108 |
| | $ | 141,899 |
|
Segment assets at December 31, 2014 | $ | 1,277,600 |
| | $ | 642,429 |
| | $ | 116,252 |
| | $ | 97,209 |
| | $ | 95,195 |
| | $ | 100,777 |
| | $ | 274,091 |
| | $ | 106,931 |
| | $ | — |
| | $ | 77,834 |
| | $ | 163,177 |
| | $ | 2,951,495 |
|
| | | | | | | | | | | | | | | | | | | | | | | |
Year Ended December 31, 2013 | |
| | |
| | |
| | |
| | |
| | |
| | |
| | |
| | |
| | |
| | |
| | |
|
Revenues from real estate operations | $ | 237,869 |
| | $ | 92,010 |
| | $ | 33,060 |
| | $ | 5,050 |
| | $ | 16,863 |
| | $ | 16,568 |
| | $ | 42,653 |
| | $ | 11,924 |
| | $ | 25,290 |
| | $ | 10,075 |
| | $ | 7,271 |
| | $ | 498,633 |
|
Property operating expenses | 80,554 |
| | 31,973 |
| | 17,631 |
| | 1,282 |
| | 7,844 |
| | 5,028 |
| | 16,583 |
| | 3,431 |
| | 9,002 |
| | 1,016 |
| | 6,360 |
| | 180,704 |
|
NOI from real estate operations | $ | 157,315 |
| | $ | 60,037 |
| | $ | 15,429 |
| | $ | 3,768 |
| | $ | 9,019 |
| | $ | 11,540 |
| | $ | 26,070 |
| | $ | 8,493 |
| | $ | 16,288 |
| | $ | 9,059 |
| | $ | 911 |
| | $ | 317,929 |
|
Additions to long-lived assets | $ | 28,087 |
| | $ | 13,090 |
| | $ | 335 |
| | $ | 3,563 |
| | $ | 2,604 |
| | $ | 2,341 |
| | $ | 2,913 |
| | $ | 406 |
| | $ | 2,940 |
| | $ | — |
| | $ | 598 |
| | $ | 56,877 |
|
Transfers from non-operating properties | $ | 50,105 |
| | $ | 61,434 |
| | $ | — |
| | $ | 48,799 |
| | $ | — |
| | $ | 14 |
| | $ | 360 |
| | $ | 28,034 |
| | $ | 5,438 |
| | $ | — |
| | $ | 70,106 |
| | $ | 264,290 |
|
Segment assets at December 31, 2013 | $ | 1,243,099 |
| | $ | 616,082 |
| | $ | 118,299 |
| | $ | 77,773 |
| | $ | 98,962 |
| | $ | 96,143 |
| | $ | 303,823 |
| | $ | 104,657 |
| | $ | — |
| | $ | 80,002 |
| | $ | 166,790 |
| | $ | 2,905,630 |
|
| | | | | | | | | | | | | | | | | | | | | | | |
Year Ended December 31, 2012 | |
| | |
| | |
| | |
| | |
| | |
| | |
| | |
| | |
| | |
| | |
| | |
|
Revenues from real estate operations | $ | 238,488 |
| | $ | 79,574 |
| | $ | 32,018 |
| | $ | 3,867 |
| | $ | 16,697 |
| | $ | 16,392 |
| | $ | 52,616 |
| | $ | 9,698 |
| | $ | 24,987 |
| | $ | 12,116 |
| | $ | 6,647 |
| | $ | 493,100 |
|
Property operating expenses | 83,050 |
| | 29,103 |
| | 16,499 |
| | 689 |
| | 7,555 |
| | 4,745 |
| | 19,917 |
| | 2,562 |
| | 9,231 |
| | 2,569 |
| | 4,815 |
| | 180,735 |
|
NOI from real estate operations | $ | 155,438 |
| | $ | 50,471 |
| | $ | 15,519 |
| | $ | 3,178 |
| | $ | 9,142 |
| | $ | 11,647 |
| | $ | 32,699 |
| | $ | 7,136 |
| | $ | 15,756 |
| | $ | 9,547 |
| | $ | 1,832 |
| | $ | 312,365 |
|
Additions to long-lived assets | $ | 25,921 |
| | $ | 65,157 |
| | $ | 280 |
| | $ | 26 |
| | $ | 317 |
| | $ | 1,844 |
| | $ | 9,690 |
| | $ | 286 |
| | $ | 2,929 |
| | $ | 152 |
| | $ | 199 |
| | $ | 106,801 |
|
Transfers from non-operating properties | $ | 65,108 |
| | $ | 44,250 |
| | $ | 468 |
| | $ | — |
| | $ | — |
| | $ | 289 |
| | $ | 37,558 |
| | $ | 10,626 |
| | $ | 4,295 |
| | $ | 394 |
| | $ | 58,009 |
| | $ | 220,997 |
|
Segment assets at December 31, 2012 | $ | 1,267,357 |
| | $ | 569,860 |
| | $ | 119,369 |
| | $ | 28,730 |
| | $ | 104,544 |
| | $ | 98,027 |
| | $ | 320,548 |
| | $ | 78,798 |
| | $ | 175,830 |
| | $ | 82,090 |
| | $ | 100,777 |
| | $ | 2,945,930 |
|
Corporate Office Properties Trust and Subsidiaries and Corporate Office Properties, L.P. and Subsidiaries
Notes to Consolidated Financial Statements (Continued)
The following table reconciles our segment revenues to total revenues as reported on our consolidated statements of operations (in thousands):
|
| | | | | | | | | | | | |
| | For the Years Ended December 31, |
| | 2014 | | 2013 | | 2012 |
Segment revenues from real estate operations | | $ | 479,711 |
| | $ | 498,633 |
| | $ | 493,100 |
|
Construction contract and other service revenues | | 106,748 |
| | 62,363 |
| | 73,836 |
|
Less: Revenues from discontinued operations (Note 20) | | 14 |
| | (37,636 | ) | | (58,801 | ) |
Total revenues | | $ | 586,473 |
| | $ | 523,360 |
| | $ | 508,135 |
|
The following table reconciles our segment property operating expenses to property operating expenses as reported on our consolidated statements of operations (in thousands):
|
| | | | | | | | | | | | |
| | For the Years Ended December 31, |
| | 2014 | | 2013 | | 2012 |
Segment property operating expenses | | $ | 179,799 |
| | $ | 180,704 |
| | $ | 180,735 |
|
Less: Property operating expenses from discontinued operations (Note 20) | | 135 |
| | (13,505 | ) | | (21,529 | ) |
Total property operating expenses | | $ | 179,934 |
| | $ | 167,199 |
| | $ | 159,206 |
|
As previously discussed, we provide real estate services such as property management and construction and development services primarily for our properties but also for third parties. The primary manner in which we evaluate the operating performance of our service activities is through a measure we define as net operating income from service operations (“NOI from service operations”), which is based on the net of revenues and expenses from these activities. Construction contract and other service revenues and expenses consist primarily of subcontracted costs that are reimbursed to us by the customer along with a management fee. The operating margins from these activities are small relative to the revenue. We believe NOI from service operations is a useful measure in assessing both our level of activity and our profitability in conducting such operations. The table below sets forth the computation of our NOI from service operations (in thousands):
|
| | | | | | | | | | | | |
| | For the Years Ended December 31, |
| | 2014 | | 2013 | | 2012 |
Construction contract and other service revenues | | $ | 106,748 |
| | $ | 62,363 |
| | $ | 73,836 |
|
Construction contract and other service expenses | | (100,058 | ) | | (58,875 | ) | | (70,576 | ) |
NOI from service operations | | $ | 6,690 |
| | $ | 3,488 |
| | $ | 3,260 |
|
Corporate Office Properties Trust and Subsidiaries and Corporate Office Properties, L.P. and Subsidiaries
Notes to Consolidated Financial Statements (Continued)
The following table reconciles our NOI from real estate operations for reportable segments and NOI from service operations to income from continuing operations as reported on our consolidated statements of operations (in thousands):
|
| | | | | | | | | | | | |
| | For the Years Ended December 31, |
| | 2014 | | 2013 | | 2012 |
NOI from real estate operations | | $ | 299,912 |
| | $ | 317,929 |
| | $ | 312,365 |
|
NOI from service operations | | 6,690 |
| | 3,488 |
| | 3,260 |
|
Interest and other income | | 4,923 |
| | 3,834 |
| | 7,172 |
|
Equity in income (loss) of unconsolidated entities | | 229 |
| | 2,110 |
| | (546 | ) |
Income tax expense | | (310 | ) | | (1,978 | ) | | (381 | ) |
Other adjustments: | | — |
| | |
| | |
Depreciation and other amortization associated with real estate operations | | (136,086 | ) | | (113,214 | ) | | (107,998 | ) |
Impairment losses | | (1,416 | ) | | (5,857 | ) | | (43,678 | ) |
General, administrative and leasing expenses | | (31,794 | ) | | (30,869 | ) | | (31,900 | ) |
Business development expenses and land carry costs | | (5,573 | ) | | (5,436 | ) | | (5,711 | ) |
Interest expense on continuing operations | | (92,393 | ) | | (82,010 | ) | | (86,401 | ) |
NOI from discontinued operations | | (121 | ) | | (24,131 | ) | | (37,272 | ) |
Loss on early extinguishment of debt | | (9,552 | ) | | (27,030 | ) | | (943 | ) |
COPT consolidated income from continuing operations | | $ | 34,509 |
| | $ | 36,836 |
| | $ | 7,967 |
|
The following table reconciles our segment assets to the consolidated total assets of COPT and subsidiaries (in thousands):
|
| | | | | | | |
| As of December 31, |
| 2014 | | 2013 |
Segment assets | $ | 2,951,495 |
| | $ | 2,905,630 |
|
Non-operating property assets | 567,586 |
| | 517,564 |
|
Other assets | 151,176 |
| | 206,758 |
|
Total COPT consolidated assets | $ | 3,670,257 |
| | $ | 3,629,952 |
|
The accounting policies of the segments are the same as those used to prepare our consolidated financial statements, except that discontinued operations are not presented separately for segment purposes. In the segment reporting presented above, we did not allocate interest expense, depreciation and amortization, impairment losses, loss on early extinguishment of debt and gain on sales of real estate to our real estate segments since they are not included in the measure of segment profit reviewed by management. We also did not allocate general and administrative expenses, business development expenses and land carry costs, interest and other income, equity in income (loss) of unconsolidated entities, income taxes and noncontrolling interests because these items represent general corporate or non-operating property items not attributable to segments.
19. Income Taxes
COPT elected to be treated as a REIT under Sections 856 through 860 of the Internal Revenue Code. To qualify as a REIT, COPT must meet a number of organizational and operational requirements, including a requirement that it distribute at least 90% of the Company’s adjusted taxable income to its shareholders. As a REIT, COPT generally will not be subject to Federal income tax on taxable income that it distributes to its shareholders. If COPT fails to qualify as a REIT in any tax year, it will be subject to Federal income tax on its taxable income at regular corporate rates and may not be able to qualify as a REIT for four subsequent tax years.
COPLP is a limited partnership and is not subject to federal income tax. Its partners are required to report their respective share of the Operating Partnership’s taxable income on their respective tax returns. COPT’s share of the Operating Partnership’s taxable income is reported on COPT’s income tax return.
Corporate Office Properties Trust and Subsidiaries and Corporate Office Properties, L.P. and Subsidiaries
Notes to Consolidated Financial Statements (Continued)
The differences between taxable income reported on our income tax returns (estimated 2014 and actual 2013 and 2012) and net income as reported on our consolidated statements of operations are set forth below (in thousands):
|
| | | | | | | | | | | | |
| | For the Years Ended December 31, |
| | 2014 | | 2013 | | 2012 |
| | (Estimated) | | | | |
COPLP consolidated net income | | $ | 45,206 |
| | $ | 101,544 |
| | $ | 20,341 |
|
Adjustments: | | | | | | |
Rental revenue recognition | | (3,932 | ) | | 1,303 |
| | (10,794 | ) |
Compensation expense recognition | | 1,912 |
| | 8,987 |
| | (2,669 | ) |
Operating expense recognition | | (2,260 | ) | | (1,663 | ) | | 1,158 |
|
Gain on sales of properties | | (1,404 | ) | | (50,860 | ) | | (74,858 | ) |
Impairment losses | | 1,367 |
| | 32,047 |
| | 66,910 |
|
Loss on interest rate derivatives | | — |
| | — |
| | (29,805 | ) |
Gains from non-real estate investments | | 405 |
| | — |
| | 7,854 |
|
Income from service operations | | (391 | ) | | 1,650 |
| | 1,500 |
|
Income tax expense | | 310 |
| | 1,978 |
| | 381 |
|
Depreciation and amortization | | 41,500 |
| | 20,834 |
| | 24,804 |
|
Interest expense | | 920 |
| | 2,057 |
| | 3,978 |
|
Income from unconsolidated entities | | (187 | ) | | 3,148 |
| | (725 | ) |
COPLP consolidated noncontrolling interests | | (3,285 | ) | | (7,837 | ) | | (636 | ) |
Other | | 2,346 |
| | 1,529 |
| | (70 | ) |
COPLP consolidated taxable income | | $ | 82,507 |
| | $ | 114,717 |
| | $ | 7,369 |
|
Noncontrolling interests, other | | (3,247 | ) | | (4,061 | ) | | (622 | ) |
Other | | — |
| | — |
| | 741 |
|
COPT consolidated taxable income | | $ | 79,260 |
| | $ | 110,656 |
| | $ | 7,488 |
|
For Federal income tax purposes, dividends to shareholders may be characterized as ordinary income, capital gains or return of capital. The characterization of dividends declared on COPT’s common and preferred shares during each of the last three years was as follows:
|
| | | | | | | | | | | | | | | | | | |
| | Common Shares | | Preferred Shares |
| | For the Years Ended December 31, | | For the Years Ended December 31, |
| | 2014 | | 2013 | | 2012 | | 2014 | | 2013 | | 2012 |
Ordinary income | | 64.5 | % | | 71.8 | % | | 33.2 | % | | 90.9 | % | | 76.2 | % | | 100.0 | % |
Long-term capital gain | | 6.5 | % | | 22.4 | % | | 0.0 | % | | 9.1 | % | | 23.8 | % | | 0.0 | % |
Return of capital | | 29.0 | % | | 5.8 | % | | 66.8 | % | | 0.0 | % | | 0.0 | % | | 0.0 | % |
We distributed all of COPT’s REIT taxable income in 2014, 2013 and 2012 and, as a result, did not incur Federal income tax in those years on such income.
The net basis of our consolidated assets and liabilities for tax reporting purposes is approximately $233 million lower than the amount reported on our consolidated balance sheet at December 31, 2014, which is primarily related to differences in basis for net properties, intangible assets on property acquisitions and deferred rent receivable.
Corporate Office Properties Trust and Subsidiaries and Corporate Office Properties, L.P. and Subsidiaries
Notes to Consolidated Financial Statements (Continued)
We own a TRS that is subject to Federal and state income taxes. Our TRS had income before income taxes under GAAP of $822,000 in 2014, $330,000 in 2013 and $11.3 million in 2012. Our TRS’ provision for income tax consisted of the following expenses (in thousands):
|
| | | | | | | | | | | | |
| | For the Years Ended December 31, |
| | 2014 | | 2013 | | 2012 |
Deferred | | | | | | |
Federal | | $ | 258 |
| | $ | 1,742 |
| | $ | 312 |
|
State | | 52 |
| | 236 |
| | 69 |
|
Total income tax expense | | $ | 310 |
| | $ | 1,978 |
| | $ | 381 |
|
A reconciliation of our TRS’ Federal statutory rate to the effective tax rate for income tax reported on our statements of operations is set forth below:
|
| | | | | | | | | |
| | For the Years Ended December 31, |
| | 2014 | | 2013 | | 2012 |
Income taxes at U.S. statutory rate | | 34.0 | % | | 34.0 | % | | 34.0 | % |
State and local, net of U.S. Federal tax benefit | | 4.2 | % | | 4.5 | % | | 4.6 | % |
Increase in deferred tax asset valuation allowance | | 0.0 | % | | 562.9 | % | | 0.0 | % |
Other | | (0.4 | )% | | (1.1 | )% | | 0.0 | % |
Effective tax rate | | 37.8 | % | | 600.3 | % | | 38.6 | % |
Items in our TRS contributing to temporary differences that lead to deferred taxes include depreciation and amortization, share-based compensation, certain accrued compensation, compensation paid in the form of contributions to a deferred nonqualified compensation plan, impairment losses and net operating losses that are not deductible until future periods. As of December 31, 2014, our TRS had a net operating loss carryforward for federal income tax purposes of approximately $13 million expiring in 2033. We believe that our TRS is no longer subject to income tax examinations for years prior to 2011.
The table below sets forth the tax effects of temporary differences and carry forwards included in the net deferred tax asset of our TRS (in thousands): |
| | | | | | | | |
| | December 31, |
| | 2014 | | 2013 |
Operating loss forward | | $ | 5,012 |
| | $ | 5,382 |
|
Share-based compensation | | 976 |
| | 869 |
|
Accrued payroll | | 195 |
| | 221 |
|
Property | | (119 | ) | | (105 | ) |
Valuation allowance | | (2,062 | ) | | (2,062 | ) |
Deferred tax asset, net | | $ | 4,002 |
| | $ | 4,305 |
|
We recognize a valuation allowance on our deferred tax asset if we believe all or some portion of the deferred tax asset may not be realized. An increase or decrease in the valuation allowance resulting from a change in circumstances that causes a change in our judgment about the realizability of our deferred tax asset is included in income. In 2013, we recognized a $1.9 million increase in our deferred tax asset valuation allowance due to a decrease in future projected operating income in our TRS resulting primarily from our dispositions of certain properties to which the TRS provided amenity services and our planned reduction in amenity services provided by the TRS at certain other properties. We believe it is more likely than not that the results of future operations in our TRS will generate sufficient taxable income to realize our December 31, 2014 net deferred tax asset.
We are subject to certain state and local income and franchise taxes. The expense associated with these state and local taxes is included in general and administrative expense and property operating expenses on our consolidated statements of operations. We did not separately state these amounts on our consolidated statements of operations because they are insignificant.
Corporate Office Properties Trust and Subsidiaries and Corporate Office Properties, L.P. and Subsidiaries
Notes to Consolidated Financial Statements (Continued)
20. Discontinued Operations and Assets Held for Sale
Income from discontinued operations primarily includes revenues and expenses associated with the following:
| |
• | five properties in White Marsh, Maryland (in the Greater Baltimore region) that were sold on January 30, 2012; |
| |
• | 1101 Sentry Gateway in San Antonio that was sold on January 31, 2012; |
| |
• | 222 and 224 Schilling Circle in Greater Baltimore that were sold on February 10, 2012; |
| |
• | 15 and 45 West Gude Drive in the Baltimore/Washington Corridor that were sold on May 2, 2012; |
| |
• | 11800 Tech Road in the Baltimore/Washington Corridor that was sold on June 14, 2012; |
| |
• | 400 Professional Drive in the Baltimore/Washington Corridor for which the title to the property was transferred to the mortgage lender on July 2, 2012; |
| |
• | 23 operating properties primarily in the Baltimore/Washington Corridor and Greater Baltimore regions that were sold on July 24, 2012; |
| |
• | 920 Elkridge Landing Road in the Baltimore/Washington Corridor that was sold on June 25, 2013 (added to discontinued operations in 2013); |
| |
• | 4230 Forbes Boulevard in the Baltimore/Washington Corridor that was sold on December 11, 2013; |
| |
• | 15 operating properties in Colorado Springs that were sold on December 12, 2013; and |
| |
• | nine operating properties in the Baltimore/Washington Corridor and five operating properties in Colorado Springs for which the title to the properties was transferred to the mortgage lender on December 23, 2013. |
The table below sets forth the components of discontinued operations reported on our consolidated statements of operations (in thousands):
|
| | | | | | | | | | | | |
| | For the Years Ended December 31, |
| | 2014 | | 2013 | | 2012 |
Revenue from real estate operations | | $ | (14 | ) | | $ | 37,636 |
| | $ | 58,801 |
|
Property operating expenses | | 135 |
| | (13,505 | ) | | (21,529 | ) |
Depreciation and amortization | | — |
| | (4,505 | ) | | (13,939 | ) |
Impairment losses | | (3 | ) | | (26,190 | ) | | (23,232 | ) |
General, administrative and leasing expenses | | — |
| | (4 | ) | | (3 | ) |
Business development and land carry costs | | — |
| | — |
| | (24 | ) |
Interest expense | | — |
| | (8,221 | ) | | (10,397 | ) |
Gain on sales of real estate | | 24 |
| | 2,671 |
| | 20,940 |
|
Gain on early extinguishment of debt | | (116 | ) | | 67,810 |
| | 1,736 |
|
Discontinued operations | | $ | 26 |
| | $ | 55,692 |
| | $ | 12,353 |
|
As of December 31, 2014, we had two land parcels in the Greater Baltimore region classified as held for sale with a cost basis of $14.3 million.
21. Earnings Per Share (“EPS”) and Earnings Per Unit (“EPU”)
COPT and Subsidiaries EPS
We present both basic and diluted EPS. We compute basic EPS by dividing net income available to common shareholders allocable to unrestricted common shares under the two-class method by the weighted average number of unrestricted common shares outstanding during the period. Our computation of diluted EPS is similar except that:
| |
• | the denominator is increased to include: (1) the weighted average number of potential additional common shares that would have been outstanding if securities that are convertible into COPT common shares were converted; and (2) the effect of dilutive potential common shares outstanding during the period attributable to share-based compensation using the treasury stock or if-converted methods; and |
| |
• | the numerator is adjusted to add back any changes in income or loss that would result from the assumed conversion into common shares that we added to the denominator. |
Corporate Office Properties Trust and Subsidiaries and Corporate Office Properties, L.P. and Subsidiaries
Notes to Consolidated Financial Statements (Continued)
Summaries of the numerator and denominator for purposes of basic and diluted EPS calculations are set forth below (in thousands, except per share data):
|
| | | | | | | | | | | | |
| | For the Years Ended December 31, |
| | 2014 | | 2013 | | 2012 |
Numerator: | | | | | | |
Income from continuing operations | | $ | 34,509 |
| | $ | 36,836 |
| | $ | 7,967 |
|
Gain on sales of real estate, net | | 10,671 |
| | 9,016 |
| | 21 |
|
Preferred share dividends | | (15,939 | ) | | (19,971 | ) | | (20,844 | ) |
Issuance costs associated with redeemed preferred shares | | (1,769 | ) | | (2,904 | ) | | (1,827 | ) |
(Income) loss from continuing operations attributable to noncontrolling interests | | (4,955 | ) | | (4,486 | ) | | 1,309 |
|
Income from continuing operations attributable to restricted shares | | (432 | ) | | (414 | ) | | (469 | ) |
Numerator for basic and diluted EPS from continuing operations attributable to COPT common shareholders | | $ | 22,085 |
| | $ | 18,077 |
| | $ | (13,843 | ) |
Discontinued operations | | 26 |
| | 55,692 |
| | 12,353 |
|
Discontinued operations attributable to noncontrolling interests | | 4 |
| | (3,351 | ) | | (673 | ) |
Numerator for basic and diluted EPS on net income (loss)attributable to COPT common shareholders | | $ | 22,115 |
| | $ | 70,418 |
| | $ | (2,163 | ) |
Denominator (all weighted averages): | | | | | | |
Denominator for basic EPS (common shares) | | 88,092 |
| | 85,167 |
| | 73,454 |
|
Dilutive effect of share-based compensation awards | | 171 |
| | 57 |
| | — |
|
Denominator for basic and diluted EPS (common shares) | | 88,263 |
| | 85,224 |
| | 73,454 |
|
Basic EPS: | | | | | | |
Income (loss) from continuing operations attributable to COPT common shareholders | | $ | 0.25 |
| | $ | 0.21 |
| | $ | (0.19 | ) |
Discontinued operations attributable to COPT common shareholders | | — |
| | 0.62 |
| | 0.16 |
|
Net income (loss) attributable to COPT common shareholders | | $ | 0.25 |
| | $ | 0.83 |
| | $ | (0.03 | ) |
Diluted EPS: | | | | | | |
Income (loss) from continuing operations attributable to COPT common shareholders | | $ | 0.25 |
| | $ | 0.21 |
| | $ | (0.19 | ) |
Discontinued operations attributable to COPT common shareholders | | — |
| | 0.62 |
| | 0.16 |
|
Net income (loss) attributable to COPT common shareholders | | $ | 0.25 |
| | $ | 0.83 |
| | $ | (0.03 | ) |
Our diluted EPS computations do not include the effects of the following securities since the conversions of such securities would increase diluted EPS for the respective periods (in thousands): |
| | | | | | | | | |
| | Weighted Average Shares Excluded from Denominator for the Years Ended December 31, |
| | 2014 | | 2013 | | 2012 |
Conversion of common units | | 3,897 |
| | 3,869 |
| | 4,235 |
|
Conversion of Series I preferred units | | 176 |
| | 176 |
| | 176 |
|
Conversion of Series K preferred shares | | 434 |
| | 434 |
| | 434 |
|
The following share-based compensation securities were excluded from the computation of diluted EPS because their effect was antidilutive:
| |
• | weighted average restricted shares of 401,000 for 2014, 385,000 for 2013 and 461,000 for 2012; and |
| |
• | weighted average options of 492,000 for 2014, 636,000 for 2013 and 772,000 for 2012, respectively. |
As discussed in Note 11, we have outstanding senior notes that have an exchange settlement feature, but such notes did not affect our diluted EPS reported above since the weighted average closing price of COPT’s common shares during each of the periods was less than the exchange prices per common share applicable for such periods.
Corporate Office Properties Trust and Subsidiaries and Corporate Office Properties, L.P. and Subsidiaries
Notes to Consolidated Financial Statements (Continued)
COPLP and Subsidiaries EPU
We present both basic and diluted EPU. We compute basic EPU by dividing net income available to common unitholders allocable to unrestricted common units under the two-class method by the weighted average number of unrestricted common units outstanding during the period. Our computation of diluted EPU is similar except that:
| |
• | the denominator is increased to include: (1) the weighted average number of potential additional common units that would have been outstanding if securities that are convertible into our common units were converted; and (2) the effect of dilutive potential common units outstanding during the period attributable to share-based compensation using the treasury stock or if-converted methods; and |
| |
• | the numerator is adjusted to add back any changes in income or loss that would result from the assumed conversion into common units that we added to the denominator. |
Summaries of the numerator and denominator for purposes of basic and diluted EPU calculations are set forth below (in thousands, except per unit data): |
| | | | | | | | | | | | |
| | For the Years Ended December 31, |
| | 2014 | | 2013 | | 2012 |
Numerator: | | | | | | |
Income from continuing operations | | $ | 34,509 |
| | $ | 36,836 |
| | $ | 7,967 |
|
Gain on sales of real estate, net | | 10,671 |
| | 9,016 |
| | 21 |
|
Preferred unit distributions | | (16,599 | ) | | (20,631 | ) | | (21,504 | ) |
Issuance costs associated with redeemed preferred units | | (1,769 | ) | | (2,904 | ) | | (1,827 | ) |
(Income) loss from continuing operations attributable to noncontrolling interests | | (3,281 | ) | | (2,977 | ) | | 1,206 |
|
Income from continuing operations attributable to restricted units | | (432 | ) | | (414 | ) | | (469 | ) |
Numerator for basic and diluted EPU from continuing operations attributable to COPLP common unitholders | | $ | 23,099 |
| | $ | 18,926 |
| | $ | (14,606 | ) |
Discontinued operations | | 26 |
| | 55,692 |
| | 12,353 |
|
Discontinued operations attributable to noncontrolling interests | | 5 |
| | (930 | ) | | (699 | ) |
Numerator for basic and diluted EPU on net income (loss) attributable to COPLP common unitholders | | $ | 23,130 |
| | $ | 73,688 |
| | $ | (2,952 | ) |
Denominator (all weighted averages): | | | | | | |
Denominator for basic EPU (common units) | | 91,989 |
| | 89,036 |
| | 77,689 |
|
Dilutive effect of share-based compensation awards | | 171 |
| | 57 |
| | — |
|
Denominator for basic and diluted EPU (common units) | | 92,160 |
| | 89,093 |
| | 77,689 |
|
Basic EPU: | | | | | | |
Income (loss) from continuing operations attributable to COPLP common unitholders | | $ | 0.25 |
| | $ | 0.21 |
| | $ | (0.19 | ) |
Discontinued operations attributable to COPLP common unitholders | | — |
| | 0.62 |
| | 0.15 |
|
Net income (loss) attributable to COPLP common unitholders | | $ | 0.25 |
| | $ | 0.83 |
| | $ | (0.04 | ) |
Diluted EPU: | | | | | | |
Income (loss) from continuing operations attributable to COPLP common unitholders | | $ | 0.25 |
| | $ | 0.21 |
| | $ | (0.19 | ) |
Discontinued operations attributable to COPLP common unitholders | | — |
| | 0.62 |
| | 0.15 |
|
Net income (loss) attributable to COPLP common unitholders | | $ | 0.25 |
| | $ | 0.83 |
| | $ | (0.04 | ) |
Corporate Office Properties Trust and Subsidiaries and Corporate Office Properties, L.P. and Subsidiaries
Notes to Consolidated Financial Statements (Continued)
Our diluted EPU computations do not include the effects of the following securities since the conversions of such securities would increase diluted EPU for the respective periods (in thousands): |
| | | | | | | | | |
| | Weighted Average Units Excluded from Denominator for the Years Ended December 31, |
| | 2014 | | 2013 | | 2012 |
Conversion of Series I preferred units | | 176 |
| | 176 |
| | 176 |
|
Conversion of Series K preferred units | | 434 |
| | 434 |
| | 434 |
|
The following share-based compensation securities were excluded from the computation of diluted EPU because their effect was antidilutive:
| |
• | weighted average restricted units of 401,000 for 2014, 385,000 for 2013 and 461,000 for 2012; and |
| |
• | weighted average options of 492,000 for 2014, 636,000 for 2013 and 772,000 for 2012. |
As discussed in Note 11, we have outstanding senior notes that have an exchange settlement feature, but such notes did not affect our diluted EPU reported above since the weighted average closing price of COPT’s common shares during each of the periods was less than the exchange prices per common share applicable for such periods.
22. Quarterly Data (Unaudited)
COPT and Subsidiaries
The tables below set forth selected quarterly information for the years ended December 31, 2014 and 2013 (in thousands, except per share data). Certain of the amounts below have been reclassified to conform to the current period presentation of our consolidated financial statements. |
| | | | | | | | | | | | | | | |
| For the Year Ended December 31, 2014 |
| First Quarter | | Second Quarter | | Third Quarter | | Fourth Quarter |
Revenues | $ | 146,667 |
| | $ | 139,820 |
| | $ | 153,015 |
| | $ | 146,971 |
|
Operating income | $ | 25,206 |
| | $ | 31,836 |
| | $ | 37,422 |
| | $ | 37,148 |
|
Income from continuing operations | $ | 5,660 |
| | $ | 9,248 |
| | $ | 13,727 |
| | $ | 5,874 |
|
Discontinued operations | $ | 11 |
| | $ | (198 | ) | | $ | 191 |
| | $ | 22 |
|
Net income | $ | 5,671 |
| | $ | 9,050 |
| | $ | 24,548 |
| | $ | 5,937 |
|
Net income attributable to noncontrolling interests | (930 | ) | | (1,160 | ) | | (1,828 | ) | | (1,033 | ) |
Net income attributable to COPT | 4,741 |
| | 7,890 |
| | 22,720 |
| | 4,904 |
|
Preferred share dividends | (4,490 | ) | | (4,344 | ) | | (3,553 | ) | | (3,552 | ) |
Issuance costs associated with redeemed preferred shares | — |
| | (1,769 | ) | | — |
| | — |
|
Net income attributable to COPT common shareholders | $ | 251 |
| | $ | 1,777 |
| | $ | 19,167 |
| | $ | 1,352 |
|
Basic earnings per common share | $ | 0.00 |
| | $ | 0.02 |
| | $ | 0.22 |
| | $ | 0.01 |
|
Diluted earnings per common share | $ | 0.00 |
| | $ | 0.02 |
| | $ | 0.22 |
| | $ | 0.01 |
|
Corporate Office Properties Trust and Subsidiaries and Corporate Office Properties, L.P. and Subsidiaries
Notes to Consolidated Financial Statements (Continued)
|
| | | | | | | | | | | | | | | |
| For the Year Ended December 31, 2013 |
| First Quarter | | Second Quarter | | Third Quarter | | Fourth Quarter |
Revenues | $ | 126,219 |
| | $ | 136,527 |
| | $ | 131,812 |
| | $ | 128,802 |
|
Operating income | $ | 36,165 |
| | $ | 40,229 |
| | $ | 30,673 |
| | $ | 34,843 |
|
Income (loss) from continuing operations | $ | 11,662 |
| | $ | (232 | ) | | $ | 10,974 |
| | $ | 14,432 |
|
Discontinued operations | $ | 1,261 |
| | $ | (4,502 | ) | | $ | (12,974 | ) | | $ | 71,907 |
|
Net income (loss) | $ | 15,277 |
| | $ | (4,405 | ) | | $ | (2,000 | ) | | $ | 92,672 |
|
Net income attributable to noncontrolling interests | (257 | ) | | (960 | ) | | (964 | ) | | (5,656 | ) |
Net income (loss) attributable to COPT | 15,020 |
| | (5,365 | ) | | (2,964 | ) | | 87,016 |
|
Preferred share dividends | (6,106 | ) | | (4,885 | ) | | (4,490 | ) | | (4,490 | ) |
Issuance costs associated with redeemed preferred shares | — |
| | (2,904 | ) | | — |
| | — |
|
Net income (loss) attributable to COPT common shareholders | $ | 8,914 |
| | $ | (13,154 | ) | | $ | (7,454 | ) | | $ | 82,526 |
|
Basic earnings per common share | $ | 0.11 |
| | $ | (0.16 | ) | | $ | (0.09 | ) | | $ | 0.94 |
|
Diluted earnings per common share | $ | 0.11 |
| | $ | (0.16 | ) | | $ | (0.09 | ) | | $ | 0.94 |
|
COPLP and Subsidiaries
The tables below set forth selected quarterly information for the years ended December 31, 2014 and 2013 (in thousands, except per share data). |
| | | | | | | | | | | | | | | |
| For the Year Ended December 31, 2014 |
| First Quarter | | Second Quarter | | Third Quarter | | Fourth Quarter |
Revenues | $ | 146,667 |
| | $ | 139,820 |
| | $ | 153,015 |
| | $ | 146,971 |
|
Operating income | $ | 25,206 |
| | $ | 31,836 |
| | $ | 37,422 |
| | $ | 37,148 |
|
Income from continuing operations | $ | 5,660 |
| | $ | 9,248 |
| | $ | 13,727 |
| | $ | 5,874 |
|
Discontinued operations | $ | 11 |
| | $ | (198 | ) | | $ | 191 |
| | $ | 22 |
|
Net income | $ | 5,671 |
| | $ | 9,050 |
| | $ | 24,548 |
| | $ | 5,937 |
|
Net income attributable to noncontrolling interests | (737 | ) | | (837 | ) | | (897 | ) | | (805 | ) |
Net income attributable to COPLP | 4,934 |
| | 8,213 |
| | 23,651 |
| | 5,132 |
|
Preferred unit distributions | (4,655 | ) | | (4,509 | ) | | (3,718 | ) | | (3,717 | ) |
Issuance costs associated with redeemed preferred units | — |
| | (1,769 | ) | | — |
| | — |
|
Net income attributable to COPLP common unitholders | $ | 279 |
| | $ | 1,935 |
| | $ | 19,933 |
| | $ | 1,415 |
|
Basic earnings per common unit | $ | 0.00 |
| | $ | 0.02 |
| | $ | 0.22 |
| | $ | 0.01 |
|
Diluted earnings per common unit | $ | 0.00 |
| | $ | 0.02 |
| | $ | 0.22 |
| | $ | 0.01 |
|
|
| | | | | | | | | | | | | | | |
| For the Year Ended December 31, 2013 |
| First Quarter | | Second Quarter | | Third Quarter | | Fourth Quarter |
Revenues | $ | 126,219 |
| | $ | 136,527 |
| | $ | 131,812 |
| | $ | 128,802 |
|
Operating income | $ | 36,165 |
| | $ | 40,229 |
| | $ | 30,673 |
| | $ | 34,843 |
|
Income (loss) from continuing operations | $ | 11,662 |
| | $ | (232 | ) | | $ | 10,974 |
| | $ | 14,432 |
|
Discontinued operations | $ | 1,261 |
| | $ | (4,502 | ) | | $ | (12,974 | ) | | $ | 71,907 |
|
Net income (loss) | $ | 15,277 |
| | $ | (4,405 | ) | | $ | (2,000 | ) | | $ | 92,672 |
|
Net loss (income) attributable to noncontrolling interests | 336 |
| | (1,473 | ) | | (1,035 | ) | | (1,735 | ) |
Net income (loss) attributable to COPLP | 15,613 |
| | (5,878 | ) | | (3,035 | ) | | 90,937 |
|
Preferred unit distributions | (6,271 | ) | | (5,050 | ) | | (4,655 | ) | | (4,655 | ) |
Issuance costs associated with redeemed preferred units | — |
| | (2,904 | ) | | — |
| | — |
|
Net income (loss) attributable to COPLP common unitholders | $ | 9,342 |
| | $ | (13,832 | ) | | $ | (7,690 | ) | | $ | 86,282 |
|
Basic earnings per common unit | $ | 0.11 |
| | $ | (0.16 | ) | | $ | (0.09 | ) | | $ | 0.94 |
|
Diluted earnings per common unit | $ | 0.11 |
| | $ | (0.16 | ) | | $ | (0.09 | ) | | $ | 0.94 |
|
Corporate Office Properties Trust and Subsidiaries and Corporate Office Properties, L.P. and Subsidiaries
Notes to Consolidated Financial Statements (Continued)
23. Commitments and Contingencies
Litigation
In the normal course of business, we are involved in legal actions arising from our ownership and administration of properties. We establish reserves for specific legal proceedings when we determine that the likelihood of an unfavorable outcome is probable and the amount of loss can be reasonably estimated. Management does not anticipate that any liabilities that may result from such proceedings will have a materially adverse effect on our financial position, operations or liquidity. Our assessment of the potential outcomes of these matters involves significant judgment and is subject to change based on future developments.
Environmental
We are subject to various Federal, state and local environmental regulations related to our property ownership and operation. We have performed environmental assessments of our properties, the results of which have not revealed any environmental liability that we believe would have a materially adverse effect on our financial position, operations or liquidity.
Joint Ventures
In connection with our 2005 contribution of properties to an unconsolidated partnership in which we hold a joint venture interest, we entered into standard nonrecourse loan guarantees (environmental indemnifications and guarantees against fraud and misrepresentation, and springing guarantees of partnership debt in the event of a voluntary bankruptcy of the partnership). On December 6, 2013, the holder of mortgage debt encumbering all of the joint venture’s properties foreclosed on the properties. As a result, title to the properties was transferred to the mortgage lender and the joint venture was relieved of the debt obligation plus accrued interest and penalties. The joint venture still had $5.6 million in nonrecourse mezzanine debt as of December 31, 2014; however, the joint venture no longer holds any property and has ceased all business operations. Management estimates there to be no fair value to the guarantees as of December 31, 2014 because the actions that would trigger performance are all within our control.
Tax Incremental Financing Obligation
In August 2010, Anne Arundel County, Maryland issued $30 million in tax incremental financing bonds to third-party investors in order to finance public improvements needed in connection with our project known as National Business Park North. The real estate taxes on increases in assessed value of a development district encompassing National Business Park North are to be transferred to a special fund pledged to the repayment of the bonds. We recognized a $1.3 million liability through December 31, 2014 representing our estimated obligation to fund through a special tax any future shortfalls between debt service on the bonds and real estate taxes available to repay the bonds.
Operating Leases
We are obligated as lessee under operating leases (mostly ground leases) with various expiration dates extending to the year 2100. Future minimum rental payments due under the terms of these operating leases as of December 31, 2014 follow (in thousands):
|
| | | | |
Year Ending December 31, | | |
2015 | | $ | 905 |
|
2016 | | 839 |
|
2017 | | 768 |
|
2018 | | 735 |
|
2019 | | 728 |
|
Thereafter | | 76,678 |
|
| | $ | 80,653 |
|
Corporate Office Properties Trust and Subsidiaries and Corporate Office Properties, L.P. and Subsidiaries
Notes to Consolidated Financial Statements (Continued)
Environmental Indemnity Agreement
We agreed to provide certain environmental indemnifications in connection with a lease and subsequent sale of three New Jersey properties. The prior owner of the properties, a Fortune 100 company that is responsible for groundwater contamination at such properties, previously agreed to indemnify us for (1) direct losses incurred in connection with the contamination and (2) its failure to perform remediation activities required by the State of New Jersey, up to the point that the state declares the remediation to be complete. Under the environmental indemnification agreement, we agreed to the following:
| |
• | to indemnify the tenant against losses covered under the prior owner’s indemnity agreement if the prior owner fails to indemnify the tenant for such losses. This indemnification is capped at $5.0 million in perpetuity after the State of New Jersey declares the remediation to be complete; |
| |
• | to indemnify the tenant for consequential damages (e.g., business interruption) at one of the buildings in perpetuity and another of the buildings through 2025. This indemnification is limited to $12.5 million; and |
| |
• | to pay 50% of additional costs related to construction and environmental regulatory activities incurred by the tenant as a result of the indemnified environmental condition of the properties. This indemnification is limited to $300,000 annually and $1.5 million in the aggregate. |
Corporate Office Properties Trust and Subsidiaries and Corporate Office Properties, L.P. and Subsidiaries
Schedule II—Valuation and Qualifying Accounts
Years Ended December 31, 2014, 2013 and 2012
(Dollars in thousands) |
| | | | | | | | | | | | | | | | | | | | |
| | Balance at
Beginning
of Year | | Charged to
Costs and
Expenses (1) | | Charged to Other Accounts (2) | | Deductions (3) | | Balance at End of Year |
Accounts Receivables-Allowance for doubtful accounts | | | | | | | | | | |
Year ended December 31, 2014 | | $ | 2,976 |
| | $ | 278 |
| | $ | — |
| | $ | (2,537 | ) | | $ | 717 |
|
Year ended December 31, 2013 | | $ | 4,694 |
| | $ | (65 | ) | | $ | — |
| | $ | (1,653 | ) | | $ | 2,976 |
|
Year ended December 31, 2012 | | $ | 3,546 |
| | $ | 1,532 |
| | $ | 232 |
| | $ | (616 | ) | | $ | 4,694 |
|
Allowance for Deferred Rent Receivable | | | | | |
|
| | | | |
Year ended December 31, 2014 | | $ | 2,126 |
| | $ | — |
| | $ | (708 | ) | | $ | — |
| | $ | 1,418 |
|
Year ended December 31, 2013 | | $ | 913 |
| | $ | — |
| | $ | 1,213 |
| | $ | — |
| | $ | 2,126 |
|
Year ended December 31, 2012 | | $ | 703 |
| | $ | — |
| | $ | 416 |
| | $ | (206 | ) | | $ | 913 |
|
Allowance for Deferred Tax Asset | | | | | |
|
| | | | |
Year ended December 31, 2014 | | $ | 2,062 |
| | $ | — |
| | $ | — |
| | $ | — |
| | $ | 2,062 |
|
Year ended December 31, 2013 | | $ | 207 |
| | $ | 1,855 |
| | $ | — |
| | $ | — |
| | $ | 2,062 |
|
Year ended December 31, 2012 | | $ | 207 |
| | $ | — |
| | $ | — |
| | $ | — |
| | $ | 207 |
|
(1) Amounts charged to costs and expenses are net of recoveries.
(2) Allowances for certain accounts receivables were charged to service company revenue. Deferred rent receivable allowances were charged to rental revenue.
(3) Deductions reflect adjustments to reserves due to actual write-offs of accounts.
Corporate Office Properties Trust and Subsidiaries and Corporate Office Properties, L.P. and Subsidiaries
Schedule III—Real Estate and Accumulated Depreciation
December 31, 2014
(Dollars in thousands)
|
| | | | | | | | | | | | | | | | | | | | | | | | | | | |
| | | Initial Cost | | Gross Amounts Carried At Close of Period | | | |
Property (Type) (1) | Location | Encumbrances (2) | Land | Building and Land Improvements | Costs Capitalized Subsequent to Acquisition | Land | Building and Land Improvements | Total (3)(4) | Accumulated Depreciation (5) | Year Built or Renovated | Date Acquired (6) |
1000 Redstone Gateway (O) | Huntsville, AL | $ | 11,671 |
| $ | — |
| $ | 20,527 |
| $ | — |
| $ | — |
| $ | 20,527 |
| $ | 20,527 |
| $ | (924 | ) | 2013 | 3/23/2010 |
1100 Redstone Gateway (O) | Huntsville, AL | 12,057 |
| — |
| 19,501 |
| — |
| — |
| 19,501 |
| 19,501 |
| (476 | ) | 2014 | 3/23/2010 |
114 National Business Parkway (O) | Annapolis Junction, MD | — |
| 364 |
| 3,109 |
| 46 |
| 364 |
| 3,155 |
| 3,519 |
| (1,042 | ) | 2002 | 6/30/2000 |
11751 Meadowville Lane (O) | Richmond, VA | — |
| 1,305 |
| 52,098 |
| 112 |
| 1,305 |
| 52,210 |
| 53,515 |
| (9,889 | ) | 2007 | 9/15/2006 |
1200 Redstone Gateway (O) | Huntsville, AL | 13,950 |
| — |
| 22,409 |
| — |
| — |
| 22,409 |
| 22,409 |
| (586 | ) | 2013 | 3/23/2010 |
1201 M Street (O) | Washington, DC | — |
| — |
| 49,785 |
| 2,455 |
| — |
| 52,240 |
| 52,240 |
| (7,255 | ) | 2001 | 9/28/2010 |
1201 Winterson Road (O) | Linthicum, MD | — |
| 1,288 |
| 5,452 |
| 460 |
| 1,288 |
| 5,912 |
| 7,200 |
| (2,388 | ) | 1985 (7) | 4/30/1998 |
1220 12th Street, SE (O) | Washington, DC | — |
| — |
| 42,464 |
| 2,014 |
| — |
| 44,478 |
| 44,478 |
| (7,143 | ) | 2003 | 9/28/2010 |
1243 Winterson Road (L) | Linthicum, MD | — |
| 630 |
| — |
| — |
| 630 |
| — |
| 630 |
| — |
| (8) | 12/19/2001 |
1302 Concourse Drive (O) | Linthicum, MD | — |
| 2,078 |
| 8,313 |
| 5,008 |
| 2,078 |
| 13,321 |
| 15,399 |
| (5,610 | ) | 1996 | 11/18/1999 |
1304 Concourse Drive (O) | Linthicum, MD | — |
| 1,999 |
| 12,934 |
| 2,594 |
| 1,999 |
| 15,528 |
| 17,527 |
| (5,680 | ) | 2002 | 11/18/1999 |
1306 Concourse Drive (O) | Linthicum, MD | — |
| 2,796 |
| 11,186 |
| 5,745 |
| 2,796 |
| 16,931 |
| 19,727 |
| (6,097 | ) | 1990 | 11/18/1999 |
131 National Business Parkway (O) | Annapolis Junction, MD | — |
| 1,906 |
| 7,623 |
| 3,288 |
| 1,906 |
| 10,911 |
| 12,817 |
| (4,807 | ) | 1990 | 9/28/1998 |
132 National Business Parkway (O) | Annapolis Junction, MD | — |
| 2,917 |
| 12,259 |
| 2,977 |
| 2,917 |
| 15,236 |
| 18,153 |
| (7,314 | ) | 2000 | 5/28/1999 |
13200 Woodland Park Road (O) | Herndon, VA | — |
| 10,428 |
| 41,711 |
| 13,985 |
| 10,428 |
| 55,696 |
| 66,124 |
| (24,106 | ) | 2002 | 6/2/2003 |
133 National Business Parkway (O) | Annapolis Junction, MD | — |
| 2,517 |
| 10,068 |
| 4,920 |
| 2,517 |
| 14,988 |
| 17,505 |
| (7,560 | ) | 1997 | 9/28/1998 |
1331 Ashton Road (O) | Hanover, MD | — |
| 587 |
| 2,347 |
| 1,474 |
| 587 |
| 3,821 |
| 4,408 |
| (1,154 | ) | 1989 | 4/28/1999 |
1334 Ashton Road (O) | Hanover, MD | — |
| 736 |
| 1,488 |
| 2,634 |
| 736 |
| 4,122 |
| 4,858 |
| (2,055 | ) | 1989 | 4/28/1999 |
134 National Business Parkway (O) | Annapolis Junction, MD | — |
| 3,684 |
| 7,517 |
| 1,282 |
| 3,684 |
| 8,799 |
| 12,483 |
| (3,765 | ) | 1999 | 11/13/1998 |
1340 Ashton Road (O) | Hanover, MD | — |
| 905 |
| 3,620 |
| 1,466 |
| 905 |
| 5,086 |
| 5,991 |
| (2,431 | ) | 1989 | 4/28/1999 |
1341 Ashton Road (O) | Hanover, MD | — |
| 306 |
| 1,223 |
| 601 |
| 306 |
| 1,824 |
| 2,130 |
| (860 | ) | 1989 | 4/28/1999 |
1343 Ashton Road (O) | Hanover, MD | — |
| 193 |
| 774 |
| 405 |
| 193 |
| 1,179 |
| 1,372 |
| (596 | ) | 1989 | 4/28/1999 |
13450 Sunrise Valley Road (O) | Herndon, VA | — |
| 1,386 |
| 5,576 |
| 3,335 |
| 1,386 |
| 8,911 |
| 10,297 |
| (3,580 | ) | 1998 | 7/25/2003 |
13454 Sunrise Valley Road (O) | Herndon, VA | — |
| 2,899 |
| 11,986 |
| 5,447 |
| 2,899 |
| 17,433 |
| 20,332 |
| (6,255 | ) | 1998 | 7/25/2003 |
135 National Business Parkway (O) | Annapolis Junction, MD | 11,418 |
| 2,484 |
| 9,750 |
| 4,742 |
| 2,484 |
| 14,492 |
| 16,976 |
| (5,845 | ) | 1998 | 12/30/1998 |
1362 Mellon Road (O) | Hanover, MD | — |
| 1,706 |
| 8,670 |
| 119 |
| 1,706 |
| 8,789 |
| 10,495 |
| (1,278 | ) | 2006 | 2/10/2006 |
13857 McLearen Road (O) | Herndon, VA | — |
| 3,507 |
| 30,177 |
| 1,557 |
| 3,507 |
| 31,734 |
| 35,241 |
| (4,945 | ) | 2007 | 7/11/2012 |
140 National Business Parkway (O) | Annapolis Junction, MD | — |
| 3,407 |
| 24,167 |
| 643 |
| 3,407 |
| 24,810 |
| 28,217 |
| (7,039 | ) | 2003 | 12/31/2003 |
141 National Business Parkway (O) | Annapolis Junction, MD | 11,871 |
| 2,398 |
| 9,590 |
| 2,995 |
| 2,398 |
| 12,585 |
| 14,983 |
| (5,575 | ) | 1990 | 9/28/1998 |
14280 Park Meadow Drive (O) | Chantilly, VA | — |
| 3,731 |
| 15,953 |
| 1,754 |
| 3,731 |
| 17,707 |
| 21,438 |
| (5,626 | ) | 1999 | 9/29/2004 |
1460 Dorsey Road (L) | Hanover, MD | — |
| 1,800 |
| — |
| — |
| 1,800 |
| — |
| 1,800 |
| — |
| (8) | 2/28/2006 |
14840 Conference Center Drive (O) | Chantilly, VA | — |
| 1,572 |
| 8,175 |
| 1,488 |
| 1,572 |
| 9,663 |
| 11,235 |
| (3,885 | ) | 2000 | 7/25/2003 |
14850 Conference Center Drive (O) | Chantilly, VA | — |
| 1,615 |
| 8,358 |
| 2,896 |
| 1,615 |
| 11,254 |
| 12,869 |
| (4,074 | ) | 2000 | 7/25/2003 |
14900 Conference Center Drive (O) | Chantilly, VA | — |
| 3,436 |
| 14,402 |
| 4,569 |
| 3,436 |
| 18,971 |
| 22,407 |
| (7,396 | ) | 1999 | 7/25/2003 |
|
| | | | | | | | | | | | | | | | | | | | | | | | | | | |
| | | Initial Cost | | Gross Amounts Carried At Close of Period | | | |
Property (Type) (1) | Location | Encumbrances (2) | Land | Building and Land Improvements | Costs Capitalized Subsequent to Acquisition | Land | Building and Land Improvements | Total (3)(4) | Accumulated Depreciation (5) | Year Built or Renovated | Date Acquired (6) |
15000 Conference Center Drive (O) | Chantilly, VA | 54,000 |
| 5,193 |
| 47,045 |
| 18,692 |
| 5,193 |
| 65,737 |
| 70,930 |
| (25,365 | ) | 1989 | 11/30/2001 |
1501 South Clinton Street (O) | Baltimore, MD | — |
| 27,964 |
| 52,146 |
| 7,553 |
| 27,964 |
| 59,699 |
| 87,663 |
| (11,059 | ) | 2006 | 10/27/2009 |
15010 Conference Center Drive (O) | Chantilly, VA | 96,000 |
| 3,500 |
| 41,921 |
| 498 |
| 3,500 |
| 42,419 |
| 45,919 |
| (8,644 | ) | 2006 | 11/30/2001 |
15049 Conference Center Drive (O) | Chantilly, VA | — |
| 4,415 |
| 20,365 |
| 726 |
| 4,415 |
| 21,091 |
| 25,506 |
| (8,781 | ) | 1997 | 8/14/2002 |
15059 Conference Center Drive (O) | Chantilly, VA | — |
| 5,753 |
| 13,615 |
| 1,780 |
| 5,753 |
| 15,395 |
| 21,148 |
| (6,071 | ) | 2000 | 8/14/2002 |
15395 John Marshall Highway (O) | Haymarket, VA | — |
| 2,465 |
| 24,720 |
| — |
| 2,465 |
| 24,720 |
| 27,185 |
| (576 | ) | 2014 | 5/7/2013 |
1550 West Nursery Road (O) | Linthicum, MD | — |
| 14,071 |
| 16,930 |
| — |
| 14,071 |
| 16,930 |
| 31,001 |
| (3,038 | ) | 2009 | 10/28/2009 |
1550 Westbranch Drive (O) | McLean, VA | — |
| 5,595 |
| 26,212 |
| 116 |
| 5,595 |
| 26,328 |
| 31,923 |
| (3,647 | ) | 2002 | 6/28/2010 |
1560 West Nursery Road (O) | Linthicum, MD | — |
| 1,441 |
| 96 |
| — |
| 1,441 |
| 96 |
| 1,537 |
| (2 | ) | 2014 | 10/28/2009 |
1560A Cable Ranch Road (O) | San Antonio, TX | — |
| 1,097 |
| 3,770 |
| 352 |
| 1,097 |
| 4,122 |
| 5,219 |
| (950 | ) | 1985/2007 | 6/19/2008 |
1560B Cable Ranch Road (O) | San Antonio, TX | — |
| 2,299 |
| 6,545 |
| 11 |
| 2,299 |
| 6,556 |
| 8,855 |
| (1,532 | ) | 1985/2006 | 6/19/2008 |
16442 Commerce Drive (O) | Dahlgren, VA | — |
| 613 |
| 2,582 |
| 593 |
| 613 |
| 3,175 |
| 3,788 |
| (1,153 | ) | 2002 | 12/21/2004 |
16480 Commerce Drive (O) | Dahlgren, VA | — |
| 1,856 |
| 7,425 |
| 167 |
| 1,856 |
| 7,592 |
| 9,448 |
| (2,020 | ) | 2000 | 12/28/2004 |
16501 Commerce Drive (O) | Dahlgren, VA | — |
| 522 |
| 2,090 |
| 465 |
| 522 |
| 2,555 |
| 3,077 |
| (714 | ) | 2002 | 12/21/2004 |
16539 Commerce Drive (O) | Dahlgren, VA | — |
| 688 |
| 2,860 |
| 1,469 |
| 688 |
| 4,329 |
| 5,017 |
| (1,696 | ) | 1990 | 12/21/2004 |
16541 Commerce Drive (O) | Dahlgren, VA | — |
| 773 |
| 3,094 |
| 1,367 |
| 773 |
| 4,461 |
| 5,234 |
| (1,529 | ) | 1996 | 12/21/2004 |
16543 Commerce Drive (O) | Dahlgren, VA | — |
| 436 |
| 1,742 |
| 172 |
| 436 |
| 1,914 |
| 2,350 |
| (486 | ) | 2002 | 12/21/2004 |
1751 Pinnacle Drive (O) | McLean, VA | — |
| 10,486 |
| 42,339 |
| 22,325 |
| 10,486 |
| 64,664 |
| 75,150 |
| (20,705 | ) | 1989/1995 | 9/23/2004 |
1753 Pinnacle Drive (O) | McLean, VA | — |
| 8,275 |
| 34,353 |
| 10,528 |
| 8,275 |
| 44,881 |
| 53,156 |
| (14,406 | ) | 1976/2004 | 9/23/2004 |
201 Technology Drive (O) | Lebanon, VA | — |
| 726 |
| 31,091 |
| 60 |
| 726 |
| 31,151 |
| 31,877 |
| (5,579 | ) | 2007 | 10/5/2007 |
206 Research Boulevard (O) | Aberdeen, MD | — |
| 1,813 |
| 17,485 |
| — |
| 1,813 |
| 17,485 |
| 19,298 |
| (979 | ) | 2012 | 9/14/2007 |
209 Research Boulevard (O) | Aberdeen, MD | — |
| 1,045 |
| 16,087 |
| 32 |
| 1,045 |
| 16,119 |
| 17,164 |
| (1,665 | ) | 2010 | 9/14/2007 |
210 Research Boulevard (O) | Aberdeen, MD | — |
| 1,065 |
| 14,687 |
| 75 |
| 1,065 |
| 14,762 |
| 15,827 |
| (1,191 | ) | 2010 | 9/14/2007 |
21267 Smith Switch Road (O) | Ashburn, VA | — |
| 4,040 |
| 10,369 |
| — |
| 4,040 |
| 10,369 |
| 14,409 |
| (106 | ) | 2014 | 12/27/2012 |
21271 Smith Switch Road (O) | Ashburn, VA | — |
| 7,346 |
| 16,864 |
| — |
| 7,346 |
| 16,864 |
| 24,210 |
| (447 | ) | 2013 | 12/27/2012 |
22289 Exploration Drive (O) | Lexington Park, MD | — |
| 1,422 |
| 5,719 |
| 1,511 |
| 1,422 |
| 7,230 |
| 8,652 |
| (2,512 | ) | 2000 | 3/24/2004 |
22299 Exploration Drive (O) | Lexington Park, MD | — |
| 1,362 |
| 5,791 |
| 1,119 |
| 1,362 |
| 6,910 |
| 8,272 |
| (2,433 | ) | 1998 | 3/24/2004 |
22300 Exploration Drive (O) | Lexington Park, MD | — |
| 1,094 |
| 5,038 |
| 539 |
| 1,094 |
| 5,577 |
| 6,671 |
| (1,878 | ) | 1997 | 11/9/2004 |
22309 Exploration Drive (O) | Lexington Park, MD | — |
| 2,243 |
| 10,419 |
| 7,491 |
| 2,243 |
| 17,910 |
| 20,153 |
| (3,999 | ) | 1984/1997 | 3/24/2004 |
23535 Cottonwood Parkway (O) | California, MD | — |
| 692 |
| 3,051 |
| 223 |
| 692 |
| 3,274 |
| 3,966 |
| (1,066 | ) | 1984 | 3/24/2004 |
2500 Riva Road (O) | Annapolis, MD | — |
| 2,791 |
| 12,145 |
| 1 |
| 2,791 |
| 12,146 |
| 14,937 |
| (4,073 | ) | 2000 | 3/4/2003 |
2691 Technology Drive (O) | Annapolis Junction, MD | — |
| 2,098 |
| 17,334 |
| 5,115 |
| 2,098 |
| 22,449 |
| 24,547 |
| (6,938 | ) | 2005 | 5/26/2000 |
2701 Technology Drive (O) | Annapolis Junction, MD | 22,636 |
| 1,737 |
| 15,266 |
| 2,554 |
| 1,737 |
| 17,820 |
| 19,557 |
| (6,641 | ) | 2001 | 5/26/2000 |
2711 Technology Drive (O) | Annapolis Junction, MD | 17,606 |
| 2,251 |
| 21,611 |
| 1,451 |
| 2,251 |
| 23,062 |
| 25,313 |
| (9,531 | ) | 2002 | 11/13/2000 |
2720 Technology Drive (O) | Annapolis Junction, MD | — |
| 3,863 |
| 29,272 |
| 113 |
| 3,863 |
| 29,385 |
| 33,248 |
| (7,577 | ) | 2004 | 1/31/2002 |
2721 Technology Drive (O) | Annapolis Junction, MD | — |
| 4,611 |
| 14,597 |
| 1,226 |
| 4,611 |
| 15,823 |
| 20,434 |
| (5,840 | ) | 2000 | 10/21/1999 |
2730 Hercules Road (O) | Annapolis Junction, MD | 35,161 |
| 8,737 |
| 31,612 |
| 7,093 |
| 8,737 |
| 38,705 |
| 47,442 |
| (14,268 | ) | 1990 | 9/28/1998 |
2900 Towerview Road (O) | Herndon, VA | — |
| 3,207 |
| 16,379 |
| 6,419 |
| 3,207 |
| 22,798 |
| 26,005 |
| (5,969 | ) | 1982/2008 | 12/20/2005 |
300 Sentinel Drive (O) | Annapolis Junction, MD | — |
| 1,517 |
| 58,827 |
| 166 |
| 1,517 |
| 58,993 |
| 60,510 |
| (6,977 | ) | 2009 | 11/14/2003 |
|
| | | | | | | | | | | | | | | | | | | | | | | | | | | |
| | | Initial Cost | | Gross Amounts Carried At Close of Period | | | |
Property (Type) (1) | Location | Encumbrances (2) | Land | Building and Land Improvements | Costs Capitalized Subsequent to Acquisition | Land | Building and Land Improvements | Total (3)(4) | Accumulated Depreciation (5) | Year Built or Renovated | Date Acquired (6) |
302 Sentinel Drive (O) | Annapolis Junction, MD | — |
| 2,648 |
| 29,687 |
| 423 |
| 2,648 |
| 30,110 |
| 32,758 |
| (5,210 | ) | 2007 | 11/14/2003 |
304 Sentinel Drive (O) | Annapolis Junction, MD | — |
| 3,411 |
| 24,917 |
| 138 |
| 3,411 |
| 25,055 |
| 28,466 |
| (5,655 | ) | 2005 | 11/14/2003 |
306 Sentinel Drive (O) | Annapolis Junction, MD | 16,298 |
| 3,260 |
| 22,592 |
| 415 |
| 3,260 |
| 23,007 |
| 26,267 |
| (4,687 | ) | 2006 | 11/14/2003 |
308 Sentinel Drive (O) | Annapolis Junction, MD | — |
| 1,422 |
| 26,197 |
| — |
| 1,422 |
| 26,197 |
| 27,619 |
| (2,395 | ) | 2010 | 11/14/2003 |
310 Sentinel Way (O) | Annapolis Junction, MD | — |
| 2,372 |
| 33,953 |
| — |
| 2,372 |
| 33,953 |
| 36,325 |
| — |
| (7) | 11/14/2003 |
310 The Bridge Street (O) | Huntsville, AL | — |
| 261 |
| 26,531 |
| 1,051 |
| 261 |
| 27,582 |
| 27,843 |
| (4,310 | ) | 2009 | 8/9/2011 |
312 Sentinel Way (O) | Annapolis Junction, MD | — |
| 3,138 |
| 23,793 |
| — |
| 3,138 |
| 23,793 |
| 26,931 |
| (240 | ) | 2014 | 11/14/2003 |
3120 Fairview Park Drive (O) | Falls Church, VA | — |
| 6,863 |
| 35,606 |
| 7,303 |
| 6,863 |
| 42,909 |
| 49,772 |
| (5,456 | ) | 2008 | 11/23/2010 |
314 Sentinel Way (O) | Annapolis Junction, MD | — |
| 1,254 |
| 1,325 |
| — |
| 1,254 |
| 1,325 |
| 2,579 |
| (216 | ) | 2008 | 11/14/2003 |
316 Sentinel Way (O) | Annapolis Junction, MD | — |
| 2,748 |
| 38,156 |
| 139 |
| 2,748 |
| 38,295 |
| 41,043 |
| (2,602 | ) | 2011 | 11/14/2003 |
318 Sentinel Way (O) | Annapolis Junction, MD | — |
| 2,185 |
| 28,426 |
| — |
| 2,185 |
| 28,426 |
| 30,611 |
| (6,270 | ) | 2005 | 11/14/2003 |
320 Sentinel Way (O) | Annapolis Junction, MD | — |
| 2,067 |
| 21,623 |
| — |
| 2,067 |
| 21,623 |
| 23,690 |
| (3,770 | ) | 2007 | 11/14/2003 |
322 Sentinel Way (O) | Annapolis Junction, MD | 21,680 |
| 2,605 |
| 22,827 |
| — |
| 2,605 |
| 22,827 |
| 25,432 |
| (4,572 | ) | 2006 | 11/14/2003 |
324 Sentinel Way (O) | Annapolis Junction, MD | — |
| 1,656 |
| 23,018 |
| — |
| 1,656 |
| 23,018 |
| 24,674 |
| (2,503 | ) | 2010 | 6/29/2006 |
375 West Padonia Road (O) | Timonium, MD | — |
| 2,483 |
| 10,415 |
| 4,857 |
| 2,483 |
| 15,272 |
| 17,755 |
| (6,904 | ) | 1986 | 12/21/1999 |
410 National Business Parkway (O) | Annapolis Junction, MD | — |
| 1,831 |
| 23,257 |
| 112 |
| 1,831 |
| 23,369 |
| 25,200 |
| (1,127 | ) | 2012 | 6/29/2006 |
420 National Business Parkway (O) | Annapolis Junction, MD | — |
| 2,370 |
| 27,161 |
| 101 |
| 2,370 |
| 27,262 |
| 29,632 |
| (541 | ) | 2013 | 6/29/2006 |
430 National Business Parkway (O) | Annapolis Junction, MD | — |
| 1,852 |
| 21,138 |
| 120 |
| 1,852 |
| 21,258 |
| 23,110 |
| (1,494 | ) | 2011 | 6/29/2006 |
44408 Pecan Court (O) | California, MD | — |
| 817 |
| 1,583 |
| 582 |
| 817 |
| 2,165 |
| 2,982 |
| (405 | ) | 1986 | 3/24/2004 |
44414 Pecan Court (O) | California, MD | — |
| 405 |
| 1,619 |
| 336 |
| 405 |
| 1,955 |
| 2,360 |
| (641 | ) | 1986 | 3/24/2004 |
44417 Pecan Court (O) | California, MD | — |
| 434 |
| 3,204 |
| 88 |
| 434 |
| 3,292 |
| 3,726 |
| (1,037 | ) | 1989 (7) | 3/24/2004 |
44420 Pecan Court (O) | California, MD | — |
| 344 |
| 890 |
| 148 |
| 344 |
| 1,038 |
| 1,382 |
| (199 | ) | 1989 | 11/9/2004 |
44425 Pecan Court (O) | California, MD | — |
| 1,309 |
| 3,506 |
| 1,307 |
| 1,309 |
| 4,813 |
| 6,122 |
| (1,492 | ) | 1997 | 5/5/2004 |
45310 Abell House Lane (O) | California, MD | — |
| 2,272 |
| 13,808 |
| — |
| 2,272 |
| 13,808 |
| 16,080 |
| (1,057 | ) | 2011 | 8/30/2010 |
46579 Expedition Drive (O) | Lexington Park, MD | — |
| 1,406 |
| 5,796 |
| 1,335 |
| 1,406 |
| 7,131 |
| 8,537 |
| (2,780 | ) | 2002 | 3/24/2004 |
46591 Expedition Drive (O) | Lexington Park, MD | — |
| 1,200 |
| 7,199 |
| 803 |
| 1,200 |
| 8,002 |
| 9,202 |
| (1,618 | ) | 2005 | 3/24/2004 |
4851 Stonecroft Boulevard (O) | Chantilly, VA | — |
| 1,878 |
| 11,558 |
| 21 |
| 1,878 |
| 11,579 |
| 13,457 |
| (2,959 | ) | 2004 | 8/14/2002 |
4940 Campbell Drive (O) | White Marsh, MD | — |
| 1,379 |
| 3,858 |
| 1,373 |
| 1,379 |
| 5,231 |
| 6,610 |
| (1,278 | ) | 1990 | 1/9/2007 |
525 Babcock Road (O) | Colorado Springs, CO | — |
| 355 |
| 397 |
| 79 |
| 355 |
| 476 |
| 831 |
| (153 | ) | 1967 | 7/12/2007 |
5325 Nottingham Drive (O) | White Marsh, MD | — |
| 816 |
| 3,976 |
| 485 |
| 816 |
| 4,461 |
| 5,277 |
| (1,076 | ) | 2002 | 1/9/2007 |
5355 Nottingham Drive (O) | White Marsh, MD | — |
| 761 |
| 3,562 |
| 1,758 |
| 761 |
| 5,320 |
| 6,081 |
| (1,874 | ) | 2005 | 1/9/2007 |
5520 Research Park Drive (O) | Catonsville, MD | — |
| — |
| 20,072 |
| 38 |
| — |
| 20,110 |
| 20,110 |
| (2,687 | ) | 2009 | 4/4/2006 |
5522 Research Park Drive (O) | Catonsville, MD | — |
| — |
| 4,550 |
| — |
| — |
| 4,550 |
| 4,550 |
| (842 | ) | 2007 | 3/8/2006 |
5825 University Research Court (O) | College Park, MD | 15,615 |
| — |
| 22,522 |
| 60 |
| — |
| 22,582 |
| 22,582 |
| (3,246 | ) | 2008 | 1/29/2008 |
5850 University Research Court (O) | College Park, MD | 21,261 |
| — |
| 31,689 |
| 57 |
| — |
| 31,746 |
| 31,746 |
| (3,763 | ) | 2008 | 1/29/2008 |
6700 Alexander Bell Drive (O) | Columbia, MD | — |
| 1,755 |
| 7,019 |
| 5,550 |
| 1,755 |
| 12,569 |
| 14,324 |
| (5,435 | ) | 1988 | 5/14/2001 |
6708 Alexander Bell Drive (O) | Columbia, MD | — |
| 897 |
| 7,544 |
| 1,591 |
| 897 |
| 9,135 |
| 10,032 |
| (3,319 | ) | 1988 (7) | 5/14/2001 |
6711 Columbia Gateway Drive (O) | Columbia, MD | — |
| 2,683 |
| 23,239 |
| 435 |
| 2,683 |
| 23,674 |
| 26,357 |
| (4,765 | ) | 2006-2007 | 9/28/2000 |
6716 Alexander Bell Drive (O) | Columbia, MD | — |
| 1,242 |
| 4,969 |
| 3,352 |
| 1,242 |
| 8,321 |
| 9,563 |
| (3,992 | ) | 1990 | 12/31/1998 |
|
| | | | | | | | | | | | | | | | | | | | | | | | | | | |
| | | Initial Cost | | Gross Amounts Carried At Close of Period | | | |
Property (Type) (1) | Location | Encumbrances (2) | Land | Building and Land Improvements | Costs Capitalized Subsequent to Acquisition | Land | Building and Land Improvements | Total (3)(4) | Accumulated Depreciation (5) | Year Built or Renovated | Date Acquired (6) |
6721 Columbia Gateway Drive (O) | Columbia, MD | 17,102 |
| 1,753 |
| 34,090 |
| 65 |
| 1,753 |
| 34,155 |
| 35,908 |
| (4,941 | ) | 2009 | 9/28/2000 |
6724 Alexander Bell Drive (O) | Columbia, MD | — |
| 449 |
| 5,039 |
| 368 |
| 449 |
| 5,407 |
| 5,856 |
| (2,106 | ) | 2001 | 5/14/2001 |
6731 Columbia Gateway Drive (O) | Columbia, MD | — |
| 2,807 |
| 19,098 |
| 2,046 |
| 2,807 |
| 21,144 |
| 23,951 |
| (7,841 | ) | 2002 | 3/29/2000 |
6740 Alexander Bell Drive (O) | Columbia, MD | — |
| 1,424 |
| 5,696 |
| 3,346 |
| 1,424 |
| 9,042 |
| 10,466 |
| (4,644 | ) | 1992 | 12/31/1998 |
6741 Columbia Gateway Drive (O) | Columbia, MD | — |
| 675 |
| 1,711 |
| 114 |
| 675 |
| 1,825 |
| 2,500 |
| (303 | ) | 2008 | 9/28/2000 |
6750 Alexander Bell Drive (O) | Columbia, MD | — |
| 1,263 |
| 12,461 |
| 3,419 |
| 1,263 |
| 15,880 |
| 17,143 |
| (7,008 | ) | 2001 | 12/31/1998 |
6760 Alexander Bell Drive (O) | Columbia, MD | — |
| 890 |
| 3,561 |
| 2,763 |
| 890 |
| 6,324 |
| 7,214 |
| (2,989 | ) | 1991 | 12/31/1998 |
6940 Columbia Gateway Drive (O) | Columbia, MD | — |
| 3,545 |
| 9,916 |
| 4,717 |
| 3,545 |
| 14,633 |
| 18,178 |
| (6,463 | ) | 1999 | 11/13/1998 |
6950 Columbia Gateway Drive (O) | Columbia, MD | — |
| 3,596 |
| 14,269 |
| 2,164 |
| 3,596 |
| 16,433 |
| 20,029 |
| (6,965 | ) | 1998 | 10/22/1998 |
7000 Columbia Gateway Drive (O) | Columbia, MD | — |
| 3,131 |
| 12,103 |
| 989 |
| 3,131 |
| 13,092 |
| 16,223 |
| (4,056 | ) | 1999 | 5/31/2002 |
7005 Columbia Gateway Drive (O) | Columbia, MD | — |
| 3,036 |
| 14 |
| — |
| 3,036 |
| 14 |
| 3,050 |
| — |
| (8) | 6/26/2014 |
7015 Albert Einstein Drive (O) | Columbia, MD | 1,900 |
| 2,058 |
| 6,093 |
| 855 |
| 2,058 |
| 6,948 |
| 9,006 |
| (2,669 | ) | 1999 | 12/1/2005 |
7061 Columbia Gateway Drive (O) | Columbia, MD | — |
| 729 |
| 3,094 |
| 1,407 |
| 729 |
| 4,501 |
| 5,230 |
| (1,657 | ) | 2000 | 8/30/2001 |
7063 Columbia Gateway Drive (O) | Columbia, MD | — |
| 902 |
| 3,684 |
| 1,074 |
| 902 |
| 4,758 |
| 5,660 |
| (2,272 | ) | 2000 | 8/30/2001 |
7065 Columbia Gateway Drive (O) | Columbia, MD | — |
| 919 |
| 3,763 |
| 2,902 |
| 919 |
| 6,665 |
| 7,584 |
| (2,343 | ) | 2000 | 8/30/2001 |
7067 Columbia Gateway Drive (O) | Columbia, MD | — |
| 1,829 |
| 11,823 |
| 2,773 |
| 1,829 |
| 14,596 |
| 16,425 |
| (5,461 | ) | 2001 | 8/30/2001 |
7125 Columbia Gateway Drive (L) | Columbia, MD | — |
| 3,361 |
| 555 |
| 279 |
| 3,361 |
| 834 |
| 4,195 |
| — |
| 1973/1999 (8) | 6/29/2006 |
7125 Columbia Gateway Drive (O) | Columbia, MD | — |
| 17,126 |
| 46,994 |
| 8,848 |
| 17,126 |
| 55,842 |
| 72,968 |
| (14,434 | ) | 1973/1999 | 6/29/2006 |
7130 Columbia Gateway Drive (O) | Columbia, MD | — |
| 1,350 |
| 4,359 |
| 1,802 |
| 1,350 |
| 6,161 |
| 7,511 |
| (2,321 | ) | 1989 | 9/19/2005 |
7134 Columbia Gateway Drive (O) | Columbia, MD | — |
| 704 |
| 1,971 |
| 310 |
| 704 |
| 2,281 |
| 2,985 |
| (638 | ) | 1990 | 9/19/2005 |
7138 Columbia Gateway Drive (O) | Columbia, MD | — |
| 1,104 |
| 3,518 |
| 1,975 |
| 1,104 |
| 5,493 |
| 6,597 |
| (2,817 | ) | 1990 | 9/19/2005 |
7142 Columbia Gateway Drive (O) | Columbia, MD | — |
| 1,342 |
| 3,978 |
| 2,494 |
| 1,342 |
| 6,472 |
| 7,814 |
| (2,091 | ) | 1994 | 9/19/2005 |
7150 Columbia Gateway Drive (O) | Columbia, MD | — |
| 1,032 |
| 3,429 |
| 579 |
| 1,032 |
| 4,008 |
| 5,040 |
| (1,056 | ) | 1991 | 9/19/2005 |
7150 Riverwood Drive (O) | Columbia, MD | — |
| 1,821 |
| 4,388 |
| 1,332 |
| 1,821 |
| 5,720 |
| 7,541 |
| (1,742 | ) | 2000 | 1/10/2007 |
7160 Riverwood Drive (O) | Columbia, MD | — |
| 2,732 |
| 7,006 |
| 1,605 |
| 2,732 |
| 8,611 |
| 11,343 |
| (3,040 | ) | 2000 | 1/10/2007 |
7170 Riverwood Drive (O) | Columbia, MD | — |
| 1,283 |
| 3,096 |
| 658 |
| 1,283 |
| 3,754 |
| 5,037 |
| (1,218 | ) | 2000 | 1/10/2007 |
7175 Riverwood Drive (O) | Columbia, MD | — |
| 1,788 |
| 7,270 |
| — |
| 1,788 |
| 7,270 |
| 9,058 |
| (207 | ) | 1996/2013 | 7/27/2005 |
7200 Redstone Gateway (O) | Huntsville, AL | — |
| — |
| 4,926 |
| — |
| — |
| 4,926 |
| 4,926 |
| (133 | ) | 2013 | 3/23/2010 |
7200 Riverwood Road (O) | Columbia, MD | — |
| 4,089 |
| 16,356 |
| 3,538 |
| 4,089 |
| 19,894 |
| 23,983 |
| (7,933 | ) | 1986 | 10/13/1998 |
7205 Riverwood Drive (O) | Columbia, MD | — |
| 1,367 |
| 24,114 |
| — |
| 1,367 |
| 24,114 |
| 25,481 |
| (774 | ) | 2013 | 7/27/2005 |
7272 Park Circle Drive (O) | Hanover, MD | 4,919 |
| 1,479 |
| 6,300 |
| 3,884 |
| 1,479 |
| 10,184 |
| 11,663 |
| (2,461 | ) | 1991/1996 | 1/10/2007 |
7318 Parkway Drive (O) | Hanover, MD | — |
| 972 |
| 3,888 |
| 926 |
| 972 |
| 4,814 |
| 5,786 |
| (1,879 | ) | 1984 | 4/16/1999 |
7320 Parkway Drive (O) | Hanover, MD | — |
| 905 |
| 3,570 |
| 4,018 |
| 905 |
| 7,588 |
| 8,493 |
| (2,310 | ) | 1983 | 4/4/2002 |
7400 Redstone Gateway (O) | Huntsville, AL | — |
| — |
| 4,163 |
| — |
| — |
| 4,163 |
| 4,163 |
| — |
| (7) | 3/23/2010 |
7467 Ridge Road (O) | Hanover, MD | — |
| 1,629 |
| 6,517 |
| 2,402 |
| 1,629 |
| 8,919 |
| 10,548 |
| (4,138 | ) | 1990 | 4/28/1999 |
7740 Milestone Parkway (O) | Hanover, MD | 19,357 |
| 3,825 |
| 34,365 |
| 366 |
| 3,825 |
| 34,731 |
| 38,556 |
| (4,003 | ) | 2009 | 7/2/2007 |
7770 Backlick Road (O) | Springfield, VA | — |
| 6,387 |
| 74,325 |
| 140 |
| 6,387 |
| 74,465 |
| 80,852 |
| (3,414 | ) | 2012 | 3/10/2010 |
7880 Milestone Parkway (O) | Hanover, MD | — |
| 4,857 |
| 12,221 |
| — |
| 4,857 |
| 12,221 |
| 17,078 |
| — |
| (7) | 9/17/2013 |
8003 Corporate Drive (O) | White Marsh, MD | — |
| 611 |
| 1,611 |
| 655 |
| 611 |
| 2,266 |
| 2,877 |
| (396 | ) | 1999 | 1/9/2007 |
|
| | | | | | | | | | | | | | | | | | | | | | | | | | | |
| | | Initial Cost | | Gross Amounts Carried At Close of Period | | | |
Property (Type) (1) | Location | Encumbrances (2) | Land | Building and Land Improvements | Costs Capitalized Subsequent to Acquisition | Land | Building and Land Improvements | Total (3)(4) | Accumulated Depreciation (5) | Year Built or Renovated | Date Acquired (6) |
8007 Corporate Drive (O) | White Marsh, MD | — |
| 1,434 |
| 3,336 |
| 1,034 |
| 1,434 |
| 4,370 |
| 5,804 |
| (938 | ) | 1995 | 1/9/2007 |
8010 Corporate Drive (O) | White Marsh, MD | — |
| 1,349 |
| 3,262 |
| 1,744 |
| 1,349 |
| 5,006 |
| 6,355 |
| (1,282 | ) | 1998 | 1/9/2007 |
8013 Corporate Drive (O) | White Marsh, MD | — |
| 642 |
| 1,536 |
| 1,809 |
| 642 |
| 3,345 |
| 3,987 |
| (770 | ) | 1990 | 1/9/2007 |
8015 Corporate Drive (O) | White Marsh, MD | — |
| 446 |
| 1,116 |
| 361 |
| 446 |
| 1,477 |
| 1,923 |
| (428 | ) | 1990 | 1/9/2007 |
8019 Corporate Drive (O) | White Marsh, MD | — |
| 680 |
| 1,898 |
| 739 |
| 680 |
| 2,637 |
| 3,317 |
| (751 | ) | 1990 | 1/9/2007 |
8020 Corporate Drive (O) | White Marsh, MD | — |
| 2,184 |
| 3,767 |
| 2,205 |
| 2,184 |
| 5,972 |
| 8,156 |
| (1,499 | ) | 1997 | 1/9/2007 |
8023 Corporate Drive (O) | White Marsh, MD | — |
| 651 |
| 1,603 |
| 5 |
| 651 |
| 1,608 |
| 2,259 |
| (357 | ) | 1990 | 1/9/2007 |
8094 Sandpiper Circle (O) | White Marsh, MD | — |
| 1,960 |
| 3,716 |
| 941 |
| 1,960 |
| 4,657 |
| 6,617 |
| (1,125 | ) | 1998 | 1/9/2007 |
8098 Sandpiper Circle (O) | White Marsh, MD | — |
| 1,797 |
| 3,651 |
| 639 |
| 1,797 |
| 4,290 |
| 6,087 |
| (827 | ) | 1998 | 1/9/2007 |
8110 Corporate Drive (O) | White Marsh, MD | — |
| 2,285 |
| 10,117 |
| 989 |
| 2,285 |
| 11,106 |
| 13,391 |
| (2,870 | ) | 2001 | 1/9/2007 |
8140 Corporate Drive (O) | White Marsh, MD | — |
| 2,158 |
| 8,457 |
| 3,008 |
| 2,158 |
| 11,465 |
| 13,623 |
| (3,767 | ) | 2003 | 1/9/2007 |
8621 Robert Fulton Drive (O) | Columbia, MD | — |
| 2,317 |
| 12,642 |
| 336 |
| 2,317 |
| 12,978 |
| 15,295 |
| (3,015 | ) | 2005-2006 | 6/10/2005 |
8661 Robert Fulton Drive (O) | Columbia, MD | — |
| 1,510 |
| 3,764 |
| 2,423 |
| 1,510 |
| 6,187 |
| 7,697 |
| (1,848 | ) | 2002 | 12/30/2003 |
8671 Robert Fulton Drive (O) | Columbia, MD | — |
| 1,718 |
| 4,280 |
| 1,981 |
| 1,718 |
| 6,261 |
| 7,979 |
| (2,754 | ) | 2002 | 12/30/2003 |
870 Elkridge Landing Road (O) | Linthicum, MD | — |
| 2,003 |
| 9,442 |
| 6,941 |
| 2,003 |
| 16,383 |
| 18,386 |
| (7,965 | ) | 1981 | 8/3/2001 |
891 Elkridge Landing Road (O) | Linthicum, MD | — |
| 1,165 |
| 4,772 |
| 2,295 |
| 1,165 |
| 7,067 |
| 8,232 |
| (3,229 | ) | 1984 | 7/2/2001 |
900 Elkridge Landing Road (O) | Linthicum, MD | — |
| 1,993 |
| 7,972 |
| 3,486 |
| 1,993 |
| 11,458 |
| 13,451 |
| (5,655 | ) | 1982 | 4/30/1998 |
901 Elkridge Landing Road (O) | Linthicum, MD | — |
| 1,156 |
| 4,437 |
| 2,419 |
| 1,156 |
| 6,856 |
| 8,012 |
| (2,672 | ) | 1984 | 7/2/2001 |
911 Elkridge Landing Road (O) | Linthicum, MD | — |
| 1,215 |
| 4,861 |
| 2,024 |
| 1,215 |
| 6,885 |
| 8,100 |
| (3,239 | ) | 1985 | 4/30/1998 |
921 Elkridge Landing Road (O) | Linthicum, MD | — |
| 1,044 |
| 4,239 |
| 748 |
| 1,044 |
| 4,987 |
| 6,031 |
| (2,244 | ) | 1983 (7) | 4/30/1998 |
938 Elkridge Landing Road (O) | Linthicum, MD | — |
| 1,163 |
| 4,748 |
| 1,155 |
| 1,163 |
| 5,903 |
| 7,066 |
| (1,928 | ) | 1984 | 7/2/2001 |
939 Elkridge Landing Road (O) | Linthicum, MD | — |
| 939 |
| 3,756 |
| 3,074 |
| 939 |
| 6,830 |
| 7,769 |
| (2,927 | ) | 1983 | 4/30/1998 |
940 Elkridge Landing Road (L) | Linthicum, MD | — |
| 1,104 |
| 4,730 |
| 170 |
| 1,104 |
| 4,900 |
| 6,004 |
| (4,884 | ) | (8) | 7/2/2001 |
9651 Hornbaker Road (D) | Manassas, VA | — |
| 6,050 |
| 204,176 |
| 853 |
| 6,050 |
| 205,029 |
| 211,079 |
| (10,881 | ) | 2010 | 9/14/2010 |
9690 Deereco Road (O) | Timonium, MD | — |
| 3,415 |
| 13,723 |
| 7,289 |
| 3,415 |
| 21,012 |
| 24,427 |
| (9,585 | ) | 1988 | 12/21/1999 |
9900 Franklin Square Drive (O) | White Marsh, MD | — |
| 979 |
| 3,466 |
| 325 |
| 979 |
| 3,791 |
| 4,770 |
| (989 | ) | 1999 | 1/9/2007 |
9910 Franklin Square Drive (O) | White Marsh, MD | 4,691 |
| 1,219 |
| 6,590 |
| 74 |
| 1,219 |
| 6,664 |
| 7,883 |
| (1,952 | ) | 2005 | 1/9/2007 |
9920 Franklin Square Drive (O) | White Marsh, MD | — |
| 1,058 |
| 5,293 |
| 1,436 |
| 1,058 |
| 6,729 |
| 7,787 |
| (2,077 | ) | 2006 | 1/9/2007 |
Aerotech Commerce (L) | Colorado Springs, CO | — |
| 900 |
| — |
| — |
| 900 |
| — |
| 900 |
| — |
| (8) | 5/19/2006 |
Arborcrest (O) | Blue Bell, PA | — |
| 21,968 |
| 109,468 |
| 1,209 |
| 21,968 |
| 110,677 |
| 132,645 |
| (22,043 | ) | 1991-1996 (7) | 10/14/1997 |
Arundel Preserve (L) | Hanover, MD | — |
| 13,401 |
| 7,238 |
| — |
| 13,401 |
| 7,238 |
| 20,639 |
| — |
| (8) | 7/2/2007 |
Ashburn Crossing - DC 10 (O) | Ashburn, VA | — |
| 4,408 |
| 8,399 |
| — |
| 4,408 |
| 8,399 |
| 12,807 |
| — |
| (7) | 12/27/2012 |
Canton Crossing Land (L) | Baltimore, MD | — |
| 16,085 |
| 905 |
| — |
| 16,085 |
| 905 |
| 16,990 |
| — |
| (8) | 10/27/2009 |
Canton Crossing Util Distr Ctr (O) | Baltimore, MD | — |
| 7,300 |
| 15,556 |
| 878 |
| 7,300 |
| 16,434 |
| 23,734 |
| (2,755 | ) | 2006 | 10/27/2009 |
Columbia Gateway - Southridge (L) | Columbia, MD | — |
| 6,387 |
| 2,940 |
| — |
| 6,387 |
| 2,940 |
| 9,327 |
| — |
| (8) | 9/20/2004 |
Dahlgren Technology Center (L) | Dahlgren, VA | — |
| 978 |
| 178 |
| — |
| 978 |
| 178 |
| 1,156 |
| — |
| (8) | 3/16/2005 |
Expedition VII (L) | Lexington Park, MD | — |
| 705 |
| 727 |
| — |
| 705 |
| 727 |
| 1,432 |
| — |
| (8) | 3/24/2004 |
InterQuest (L) | Colorado Springs, CO | — |
| 14,382 |
| 9 |
| — |
| 14,382 |
| 9 |
| 14,391 |
| — |
| (8) | 9/28/2005 |
M Square Research Park (L) | College Park, MD | — |
| — |
| 3,129 |
| — |
| — |
| 3,129 |
| 3,129 |
| — |
| (8) | 1/29/2008 |
|
| | | | | | | | | | | | | | | | | | | | | | | | | | | |
| | | Initial Cost | | Gross Amounts Carried At Close of Period | | | |
Property (Type) (1) | Location | Encumbrances (2) | Land | Building and Land Improvements | Costs Capitalized Subsequent to Acquisition | Land | Building and Land Improvements | Total (3)(4) | Accumulated Depreciation (5) | Year Built or Renovated | Date Acquired (6) |
National Business Park North (L) | Annapolis Junction, MD | — |
| 27,785 |
| 47,411 |
| — |
| 27,785 |
| 47,411 |
| 75,196 |
| — |
| (8) | 6/29/2006 |
North Gate Business Park (L) | Aberdeen, MD | — |
| 6,486 |
| 10,922 |
| — |
| 6,486 |
| 10,922 |
| 17,408 |
| — |
| (8) | 9/14/2007 |
Northwest Crossroads (L) | San Antonio, TX | — |
| 7,430 |
| 836 |
| — |
| 7,430 |
| 836 |
| 8,266 |
| — |
| (8) | 1/20/2006 |
NOVA Office A (O) (9) | Chantilly, VA | — |
| 2,096 |
| 38,142 |
| — |
| 2,096 |
| 38,142 |
| 40,238 |
| — |
| (7) | 7/31/2002 |
NOVA Office B (O) (9) | Chantilly, VA | — |
| 739 |
| 18,858 |
| — |
| 739 |
| 18,858 |
| 19,597 |
| — |
| (7) | 7/31/2002 |
NOVA Office D (O) | Chantilly, VA | — |
| 6,587 |
| 2 |
| — |
| 6,587 |
| 2 |
| 6,589 |
| — |
| (7) | 7/31/2002 |
Old Annapolis Road (O) | Columbia, MD | — |
| 1,637 |
| 5,500 |
| 2,421 |
| 1,637 |
| 7,921 |
| 9,558 |
| (2,756 | ) | 1974/1985 | 12/14/2000 |
Patriot Park (L) | Colorado Springs, CO | — |
| 8,723 |
| 248 |
| — |
| 8,723 |
| 248 |
| 8,971 |
| — |
| (8) | 7/8/2005 |
Patriot Ridge (L) | Springfield, VA | — |
| 18,517 |
| 14,440 |
| — |
| 18,517 |
| 14,440 |
| 32,957 |
| — |
| (8) | 3/10/2010 |
Redstone Gateway (L) | Huntsville, AL | — |
| — |
| 14,087 |
| — |
| — |
| 14,087 |
| 14,087 |
| — |
| (8) | 3/23/2010 |
Route 15/Biggs Ford Road (L) | Frederick, MD | — |
| 8,703 |
| 541 |
| — |
| 8,703 |
| 541 |
| 9,244 |
| — |
| (8) | 8/28/2008 |
Sentry Gateway (L) | San Antonio, TX | — |
| 8,275 |
| 3,645 |
| — |
| 8,275 |
| 3,645 |
| 11,920 |
| — |
| (8) | 3/30/2005 |
Sentry Gateway - T (O) | San Antonio, TX | — |
| 14,020 |
| 38,804 |
| 13 |
| 14,020 |
| 38,817 |
| 52,837 |
| (7,646 | ) | 1982/1985 | 3/30/2005 |
Sentry Gateway - V (O) | San Antonio, TX | — |
| — |
| 1,066 |
| — |
| — |
| 1,066 |
| 1,066 |
| (161 | ) | 2007 | 3/30/2005 |
Sentry Gateway - W (O) | San Antonio, TX | — |
| — |
| 1,884 |
| — |
| — |
| 1,884 |
| 1,884 |
| (249 | ) | 2009 | 3/30/2005 |
Sentry Gateway - X (O) | San Antonio, TX | — |
| 1,964 |
| 21,178 |
| — |
| 1,964 |
| 21,178 |
| 23,142 |
| (2,204 | ) | 2010 | 1/20/2006 |
Sentry Gateway - Y (O) | San Antonio, TX | — |
| 1,964 |
| 21,298 |
| — |
| 1,964 |
| 21,298 |
| 23,262 |
| (2,213 | ) | 2010 | 1/20/2006 |
Sentry Gateway - Z (O) | San Antonio, TX | — |
| 1,964 |
| 23,185 |
| — |
| 1,964 |
| 23,185 |
| 25,149 |
| — |
| (7) | 6/14/2005 |
Westfields - Park Center (L) | Chantilly, VA | — |
| 16,418 |
| 8,584 |
| — |
| 16,418 |
| 8,584 |
| 25,002 |
| — |
| (8) | 7/18/2002 |
Westfields Corporate Center (L) | Chantilly, VA | — |
| 7,141 |
| 1,415 |
| — |
| 7,141 |
| 1,415 |
| 8,556 |
| — |
| (8) | 7/31/2002 |
White Marsh (L) | White Marsh, MD | — |
| 17,610 |
| 6,983 |
| — |
| 17,610 |
| 6,983 |
| 24,593 |
| — |
| (8) | 1/9/2007 |
Woodland Park (L) | Herndon, VA | — |
| 9,614 |
| 81 |
| — |
| 9,614 |
| 81 |
| 9,695 |
| — |
| (8) | 4/29/2004 |
Other Developments, including intercompany eliminations (V) | Various | — |
| 8 |
| 276 |
| 261 |
| 8 |
| 537 |
| 545 |
| (26 | ) | Various | Various |
| | $ | 409,193 |
| $ | 668,660 |
| $ | 3,008,508 |
| $ | 337,168 |
| $ | 668,660 |
| $ | 3,345,676 |
| $ | 4,014,336 |
| $ | (703,083 | ) | | |
| | | | | | | | | | | |
| |
(1) | A legend for the Property Type follows: (O) = Office Property; (L) = Land held or pre-construction; (D) = Data Center; and (V) = Various. |
| |
(2) | Excludes our Revolving Credit Facility of $83.0 million, term loan facilities of $520.0 million, unsecured senior notes of $890.9 million, exchangeable senior notes of $572,000, unsecured notes payable of $1.6 million, a letter of credit on a mortgage loan of $14.8 million, and net premiums on the remaining loans of $42,000. |
| |
(3) | The aggregate cost of these assets for Federal income tax purposes was approximately $3.4 billion at December 31, 2014. |
| |
(4) | As discussed in Note 3 to our Consolidated Financial Statements, we recognized impairment losses of $1.4 million primarily in connection with certain of our operating properties in the Greater Baltimore region that were disposed in the current period. |
| |
(5) | The estimated lives over which depreciation is recognized follow: Building and land improvements: 10-40 years; and tenant improvements: related lease terms. |
| |
(6) | The acquisition date of multi-parcel properties reflects the date of the earliest parcel acquisition. |
| |
(7) | Under construction or redevelopment at December 31, 2014. |
| |
(8) | Held or under pre-construction at December 31, 2014. |
| |
(9) | The carrying amounts of these properties under construction exclude allocated costs of the garage being constructed to support the properties. |
|
| | | | | | | | | | | | | | | | |
The following table summarizes our changes in cost of properties for the years ended December 31, 2014, 2013 and 2012 (in thousands): |
| | | | | | 2014 | | 2013 | | 2012 |
| Beginning balance | | | $ | 3,811,950 |
| | $ | 3,859,960 |
| | $ | 4,038,932 |
|
| Acquisitions of operating properties | | | — |
| | — |
| | 33,684 |
|
| Improvements and other additions | | | 254,868 |
| | 249,639 |
| | 214,418 |
|
| Sales | | | (48,466 | ) | | (141,045 | ) | | (291,491 | ) |
| Impairments | | | (3,042 | ) | | (45,931 | ) | | (121,557 | ) |
| Other dispositions | | | (974 | ) | | (110,673 | ) | | (13,891 | ) |
| Other | | | — |
| | — |
| | (135 | ) |
| Ending balance | | | $ | 4,014,336 |
| | $ | 3,811,950 |
| | $ | 3,859,960 |
|
| | | | | | | | | | |
The following table summarizes our changes in accumulated depreciation for the same time periods (in thousands): |
| | | | | | 2014 | | 2013 | | 2012 |
| Beginning balance | | | $ | 597,649 |
| | $ | 568,176 |
| | $ | 577,601 |
|
| Depreciation expense | | | 111,326 |
| | 92,677 |
| | 93,158 |
|
| Sales | | | (3,129 | ) | | (9,542 | ) | | (40,346 | ) |
| Impairments | | | (1,671 | ) | | (14,863 | ) | | (58,855 | ) |
| Other dispositions | | | (1,092 | ) | | (38,799 | ) | | (3,247 | ) |
| Other | | | — |
| | — |
| | (135 | ) |
| Ending balance | | | $ | 703,083 |
| | $ | 597,649 |
| | $ | 568,176 |
|
| | | | | | | | | | |