
Management: | Investor Relations: |
Stephen E. Budorick, President & CEO | Stephanie M. Krewson-Kelly, VP of IR |
Paul R. Adkins, EVP & COO | 443-285-5453, stephanie.kelly@copt.com |
Anthony Mifsud, EVP & CFO | Michelle Layne, Manager of IR |
443-285-5452, michelle.layne@copt.com | |
Firm | Senior Analyst | Phone | Email | |||
Bank of America Merrill Lynch | Jamie Feldman | 646-855-5808 | james.feldman@baml.com | |||
BTIG | Tom Catherwood | 212-738-6410 | tcatherwood@btig.com | |||
Capital One Securities | Chris Lucas | 571-633-8151 | christopher.lucas@capitalone.com | |||
Citigroup Global Markets | Manny Korchman | 212-816-1382 | emmanuel.korchman@citi.com | |||
Evercore ISI | Steve Sakwa | 212-446-9462 | steve.sakwa@evercoreisi.com | |||
Green Street Advisors | Jed Reagan | 949-640-8780 | jreagan@greenstreetadvisors.com | |||
Jefferies & Co. | Jonathan Petersen | 212-284-1705 | jpetersen@jefferies.com | |||
JP Morgan | Tony Paolone | 212-622-6682 | anthony.paolone@jpmorgan.com | |||
KeyBanc Capital Markets | Craig Mailman | 917-368-2316 | cmailman@key.com | |||
Mizuho Securities USA Inc. | Richard Anderson | 212-205-8445 | richard.anderson@us.mizuho-sc.com | |||
Raymond James | Bill Crow | 727-567-2594 | bill.crow@raymondjames.com | |||
Robert W. Baird & Co., Inc. | Dave Rodgers | 216-737-7341 | drodgers@rwbaird.com | |||
Stifel Financial Corp. | John Guinee | 443-224-1307 | jwguinee@stifel.com | |||
SunTrust Robinson Humphrey, Inc. | Michael Lewis | 212-319-5659 | michael.lewis@suntrust.com | |||
Page | Three Months Ended | Year Ended | ||||||||||||||||||||||||||||
SUMMARY OF RESULTS | Refer. | 12/31/17 | 9/30/17 | 6/30/17 | 3/31/17 | 12/31/16 | 12/31/17 | 12/31/16 | ||||||||||||||||||||||
Net income | 6 | $ | 11,356 | $ | 22,682 | $ | 19,207 | $ | 23,088 | $ | 26,603 | $ | 76,333 | $ | 15,655 | |||||||||||||||
NOI from real estate operations | 13 | $ | 81,535 | $ | 82,160 | $ | 80,963 | $ | 79,546 | $ | 81,734 | $ | 324,204 | $ | 330,739 | |||||||||||||||
Same Property NOI | 16 | $ | 68,643 | $ | 68,363 | $ | 68,723 | $ | 68,482 | $ | 69,102 | $ | 274,211 | $ | 268,331 | |||||||||||||||
Same Property Cash NOI | 17 | $ | 69,607 | $ | 69,725 | $ | 68,994 | $ | 68,114 | $ | 68,973 | $ | 276,440 | $ | 267,306 | |||||||||||||||
Adjusted EBITDA | 10 | $ | 76,958 | $ | 77,336 | $ | 75,595 | $ | 73,885 | $ | 76,781 | $ | 303,774 | $ | 308,146 | |||||||||||||||
Diluted AFFO avail. to common share and unit holders | 9 | $ | 31,920 | $ | 41,359 | $ | 43,687 | $ | 38,347 | $ | 40,717 | $ | 155,313 | $ | 158,487 | |||||||||||||||
Dividend per common share | N/A | $ | 0.275 | $ | 0.275 | $ | 0.275 | $ | 0.275 | $ | 0.275 | $ | 1.100 | $ | 1.100 | |||||||||||||||
Per share - diluted: | ||||||||||||||||||||||||||||||
EPS | 8 | $ | 0.10 | $ | 0.21 | $ | 0.08 | $ | 0.18 | $ | 0.22 | $ | 0.57 | $ | (0.03 | ) | ||||||||||||||
FFO - NAREIT | 8 | $ | 0.48 | $ | 0.55 | $ | 0.42 | $ | 0.51 | $ | 0.57 | $ | 1.95 | $ | 1.82 | |||||||||||||||
FFO - as adjusted for comparability | 8 | $ | 0.53 | $ | 0.53 | $ | 0.49 | $ | 0.47 | $ | 0.51 | $ | 2.03 | $ | 2.01 | |||||||||||||||
Numerators for diluted per share amounts: | ||||||||||||||||||||||||||||||
Diluted EPS | 6 | $ | 9,846 | $ | 20,821 | $ | 7,859 | $ | 18,050 | $ | 20,976 | $ | 56,576 | $ | (3,294 | ) | ||||||||||||||
Diluted FFO available to common share and unit holders | 7 | $ | 48,920 | $ | 55,966 | $ | 42,767 | $ | 51,900 | $ | 56,558 | $ | 199,553 | $ | 178,761 | |||||||||||||||
Diluted FFO available to common share and unit holders, as adjusted for comparability | 7 | $ | 54,161 | $ | 54,757 | $ | 50,658 | $ | 48,163 | $ | 50,219 | $ | 207,739 | $ | 197,317 | |||||||||||||||
Payout ratios: | ||||||||||||||||||||||||||||||
Diluted FFO | N/A | 58.5 | % | 50.3 | % | 65.9 | % | 54.2 | % | 49.5 | % | 56.7 | % | 60.9 | % | |||||||||||||||
Diluted FFO - as adjusted for comparability | N/A | 52.9 | % | 51.5 | % | 55.6 | % | 58.5 | % | 55.7 | % | 54.5 | % | 55.1 | % | |||||||||||||||
Diluted AFFO | N/A | 89.7 | % | 68.1 | % | 64.5 | % | 73.4 | % | 68.7 | % | 72.9 | % | 68.6 | % | |||||||||||||||
CAPITALIZATION | ||||||||||||||||||||||||||||||
Total Market Capitalization | 29 | $ | 4,903,623 | $ | 5,272,960 | $ | 5,524,727 | $ | 5,503,036 | $ | 5,315,331 | |||||||||||||||||||
Total Equity Market Capitalization | 29 | $ | 3,061,456 | $ | 3,385,759 | $ | 3,612,511 | $ | 3,583,815 | $ | 3,395,102 | |||||||||||||||||||
Gross debt | 30 | $ | 1,872,167 | $ | 1,917,201 | $ | 1,942,216 | $ | 1,949,221 | $ | 1,950,229 | |||||||||||||||||||
Net debt to adjusted book | 32 | 41.0 | % | 41.8 | % | 42.4 | % | 38.2 | % | 38.3 | % | N/A | N/A | |||||||||||||||||
Net debt plus preferred equity to adjusted book | 32 | 41.2 | % | 42.0 | % | 42.6 | % | 42.2 | % | 42.9 | % | N/A | N/A | |||||||||||||||||
Adjusted EBITDA fixed charge coverage ratio | 32 | 3.7 | x | 3.7 | x | 3.2 | x | 3.1 | x | 3.1 | x | 3.4 | x | 3.0 | x | |||||||||||||||
Net debt to in-place adjusted EBITDA ratio | 32 | 6.1 | x | 6.2 | x | 6.4 | x | 5.9 | x | 5.7 | x | N/A | N/A | |||||||||||||||||
Net debt plus pref. equity to in-place adj. EBITDA ratio | 32 | 6.1 | x | 6.2 | x | 6.4 | x | 6.5 | x | 6.3 | x | N/A | N/A | |||||||||||||||||
OTHER | ||||||||||||||||||||||||||||||
Revenue from early termination of leases | N/A | $ | 634 | $ | 749 | $ | 467 | $ | 612 | $ | 794 | $ | 2,462 | $ | 2,281 | |||||||||||||||
Capitalized interest costs | N/A | $ | 1,032 | $ | 1,055 | $ | 1,611 | $ | 1,531 | $ | 1,419 | $ | 5,229 | $ | 5,723 | |||||||||||||||
12/31/17 | 9/30/17 | 6/30/17 | 3/31/17 | 12/31/16 | ||||||||||
Operating Office and Data Center Shell Properties | ||||||||||||||
# of Properties | ||||||||||||||
Total Portfolio | 159 | 159 | 165 | 164 | 164 | |||||||||
Consolidated Portfolio | 153 | 153 | 159 | 158 | 158 | |||||||||
Core Portfolio | 156 | 153 | 153 | 152 | 152 | |||||||||
Same Properties | 135 | 135 | 135 | 135 | 135 | |||||||||
% Occupied | ||||||||||||||
Total Portfolio | 93.6 | % | 93.4 | % | 93.0 | % | 92.4 | % | 92.1 | % | ||||
Consolidated Portfolio | 93.2 | % | 93.0 | % | 92.6 | % | 92.0 | % | 91.6 | % | ||||
Core Portfolio | 94.5 | % | 94.3 | % | 93.8 | % | 93.3 | % | 92.9 | % | ||||
Same Properties | 92.8 | % | 92.6 | % | 92.6 | % | 92.3 | % | 91.8 | % | ||||
% Leased | ||||||||||||||
Total Portfolio | 94.2 | % | 94.2 | % | 94.0 | % | 93.3 | % | 93.5 | % | ||||
Consolidated Portfolio | 93.9 | % | 93.8 | % | 93.7 | % | 92.9 | % | 93.1 | % | ||||
Core Portfolio | 95.1 | % | 95.1 | % | 94.8 | % | 94.2 | % | 94.4 | % | ||||
Same Properties | 93.4 | % | 93.4 | % | 93.5 | % | 93.1 | % | 93.2 | % | ||||
Square Feet (in thousands) | ||||||||||||||
Total Portfolio | 17,345 | 17,376 | 17,323 | 17,082 | 17,190 | |||||||||
Consolidated Portfolio | 16,383 | 16,413 | 16,361 | 16,121 | 16,228 | |||||||||
Core Portfolio | 17,059 | 16,737 | 16,568 | 16,347 | 16,301 | |||||||||
Same Properties | 14,409 | 14,409 | 14,409 | 14,409 | 14,409 | |||||||||
Wholesale Data Center (in megawatts (“MWs”)) | ||||||||||||||
MWs Operational | 19.25 | 19.25 | 19.25 | 19.25 | 19.25 | |||||||||
MWs Leased (2) | 16.86 | 16.86 | 16.86 | 14.86 | 14.86 | |||||||||
(1) | Our total portfolio and core portfolio included six properties owned through an unconsolidated joint venture totaling 962,000 square feet that were 100% occupied and leased. |
(2) | Leased to tenants with further expansion rights of up to a combined 17.92 megawatts as of 12/31/2017. |
12/31/17 | 9/30/17 | 6/30/17 | 3/31/17 | 12/31/16 | |||||||||||||||
Assets | |||||||||||||||||||
Properties, net | |||||||||||||||||||
Operating properties, net | $ | 2,737,611 | $ | 2,690,712 | $ | 2,688,174 | $ | 2,670,157 | $ | 2,671,831 | |||||||||
Construction and redevelopment in progress, including land (1) | 50,316 | 70,202 | 107,910 | 108,925 | 86,323 | ||||||||||||||
Land held (1) | 353,178 | 336,117 | 338,475 | 313,932 | 315,208 | ||||||||||||||
Total properties, net | 3,141,105 | 3,097,031 | 3,134,559 | 3,093,014 | 3,073,362 | ||||||||||||||
Assets held for sale (2) | 42,226 | 74,415 | 51,291 | 41,391 | 94,654 | ||||||||||||||
Cash and cash equivalents | 12,261 | 10,858 | 10,606 | 226,470 | 209,863 | ||||||||||||||
Restricted cash and marketable securities | 7,186 | 6,173 | 6,866 | 6,439 | 8,193 | ||||||||||||||
Investment in unconsolidated real estate joint venture | 25,066 | 25,194 | 25,335 | 25,417 | 25,548 | ||||||||||||||
Accounts receivable, net | 31,802 | 27,624 | 42,742 | 29,431 | 34,438 | ||||||||||||||
Deferred rent receivable, net | 86,710 | 84,743 | 89,832 | 89,410 | 90,219 | ||||||||||||||
Intangible assets on real estate acquisitions, net | 59,092 | 64,055 | 69,205 | 73,748 | 78,351 | ||||||||||||||
Deferred leasing costs, net | 48,322 | 47,033 | 40,506 | 40,753 | 41,214 | ||||||||||||||
Investing receivables | 57,493 | 56,108 | 54,598 | 53,570 | 52,279 | ||||||||||||||
Prepaid expenses and other assets, net | 67,221 | 66,538 | 49,347 | 59,723 | 72,764 | ||||||||||||||
Total assets | $ | 3,578,484 | $ | 3,559,772 | $ | 3,574,887 | $ | 3,739,366 | $ | 3,780,885 | |||||||||
Liabilities and equity | |||||||||||||||||||
Liabilities: | |||||||||||||||||||
Debt | $ | 1,828,333 | $ | 1,873,291 | $ | 1,897,734 | $ | 1,903,657 | $ | 1,904,001 | |||||||||
Accounts payable and accrued expenses | 108,137 | 121,483 | 95,267 | 83,107 | 108,682 | ||||||||||||||
Rents received in advance and security deposits | 25,648 | 26,223 | 25,444 | 28,393 | 29,798 | ||||||||||||||
Dividends and distributions payable | 28,921 | 28,462 | 28,462 | 31,131 | 31,335 | ||||||||||||||
Deferred revenue associated with operating leases | 11,682 | 12,047 | 13,172 | 11,750 | 12,666 | ||||||||||||||
Deferred property sale (2) | 43,377 | — | — | — | — | ||||||||||||||
Capital lease obligation | 15,853 | 16,347 | 16,177 | — | — | ||||||||||||||
Redeemable preferred shares at liquidation preference (3) | — | — | — | — | 26,583 | ||||||||||||||
Other liabilities | 41,822 | 43,866 | 56,076 | 55,784 | 50,177 | ||||||||||||||
Total liabilities | 2,103,773 | 2,121,719 | 2,132,332 | 2,113,822 | 2,163,242 | ||||||||||||||
Redeemable noncontrolling interests | 23,125 | 23,269 | 23,731 | 23,676 | 22,979 | ||||||||||||||
Equity: | |||||||||||||||||||
COPT’s shareholders’ equity: | |||||||||||||||||||
Preferred shares at liquidation preference | — | — | — | 172,500 | 172,500 | ||||||||||||||
Common shares | 1,013 | 996 | 995 | 994 | 985 | ||||||||||||||
Additional paid-in capital | 2,201,047 | 2,150,067 | 2,146,119 | 2,136,369 | 2,116,581 | ||||||||||||||
Cumulative distributions in excess of net income | (818,190 | ) | (800,290 | ) | (793,828 | ) | (774,445 | ) | (765,276 | ) | |||||||||
Accumulated other comprehensive income (loss) | 2,167 | (859 | ) | (1,163 | ) | (370 | ) | (1,731 | ) | ||||||||||
Total COPT’s shareholders’ equity | 1,386,037 | 1,349,914 | 1,352,123 | 1,535,048 | 1,523,059 | ||||||||||||||
Noncontrolling interests in subsidiaries | |||||||||||||||||||
Common units in the Operating Partnership | 44,481 | 44,089 | 46,233 | 46,683 | 49,228 | ||||||||||||||
Preferred units in the Operating Partnership | 8,800 | 8,800 | 8,800 | 8,800 | 8,800 | ||||||||||||||
Other consolidated entities | 12,268 | 11,981 | 11,668 | 11,337 | 13,577 | ||||||||||||||
Total noncontrolling interests in subsidiaries | 65,549 | 64,870 | 66,701 | 66,820 | 71,605 | ||||||||||||||
Total equity | 1,451,586 | 1,414,784 | 1,418,824 | 1,601,868 | 1,594,664 | ||||||||||||||
Total liabilities, redeemable noncontrolling interests and equity | $ | 3,578,484 | $ | 3,559,772 | $ | 3,574,887 | $ | 3,739,366 | $ | 3,780,885 | |||||||||
(1) | Please refer to pages 25, 26 and 28 for detail. |
(2) | As of 12/31/17, these lines include the carrying amount and sale proceeds pertaining to a property sale not recognized for accounting purposes. Please refer to page 24. |
(3) | We redeemed all of our Series K Preferred Shares effective 1/21/17. Since we notified holders of such shares in December 2016 that we were redeeming the shares, we present the liquidation preference as a liability as of 12/31/16. |
Three Months Ended | Year Ended | ||||||||||||||||||||||||||
12/31/17 | 9/30/17 | 6/30/17 | 3/31/17 | 12/31/16 | 12/31/17 | 12/31/16 | |||||||||||||||||||||
Revenues | |||||||||||||||||||||||||||
Rental revenue | $ | 101,485 | $ | 102,275 | $ | 101,347 | $ | 100,615 | $ | 100,849 | $ | 405,722 | $ | 417,711 | |||||||||||||
Tenant recoveries and other real estate operations revenue | 26,200 | 24,956 | 26,950 | 26,152 | 27,150 | 104,258 | 108,253 | ||||||||||||||||||||
Construction contract and other service revenues | 36,882 | 29,786 | 23,138 | 13,034 | 13,992 | 102,840 | 48,364 | ||||||||||||||||||||
Total revenues | 164,567 | 157,017 | 151,435 | 139,801 | 141,991 | 612,820 | 574,328 | ||||||||||||||||||||
Expenses | |||||||||||||||||||||||||||
Property operating expenses | 47,449 | 46,368 | 48,628 | 48,519 | 47,562 | 190,964 | 197,530 | ||||||||||||||||||||
Depreciation and amortization associated with real estate operations | 33,938 | 34,438 | 32,793 | 33,059 | 32,929 | 134,228 | 132,719 | ||||||||||||||||||||
Construction contract and other service expenses | 36,029 | 28,788 | 22,315 | 12,486 | 12,968 | 99,618 | 45,481 | ||||||||||||||||||||
Impairment losses (recoveries) | 13,659 | (161 | ) | 1,625 | — | 1,554 | 15,123 | 101,391 | |||||||||||||||||||
General and administrative expenses | 5,552 | 5,692 | 6,017 | 6,747 | 6,211 | 24,008 | 30,095 | ||||||||||||||||||||
Leasing expenses | 1,447 | 1,676 | 1,842 | 1,864 | 1,578 | 6,829 | 6,458 | ||||||||||||||||||||
Business development expenses and land carry costs | 1,646 | 1,277 | 1,597 | 1,693 | 1,747 | 6,213 | 8,244 | ||||||||||||||||||||
Total operating expenses | 139,720 | 118,078 | 114,817 | 104,368 | 104,549 | 476,983 | 521,918 | ||||||||||||||||||||
Operating income | 24,847 | 38,939 | 36,618 | 35,433 | 37,442 | 135,837 | 52,410 | ||||||||||||||||||||
Interest expense | (19,211 | ) | (19,615 | ) | (19,163 | ) | (18,994 | ) | (18,664 | ) | (76,983 | ) | (83,163 | ) | |||||||||||||
Interest and other income | 1,501 | 1,508 | 1,583 | 1,726 | 1,567 | 6,318 | 5,444 | ||||||||||||||||||||
Loss on early extinguishment of debt | — | — | (513 | ) | — | (1,073 | ) | (513 | ) | (1,110 | ) | ||||||||||||||||
Income (loss) before equity in income of unconsolidated entities and income taxes | 7,137 | 20,832 | 18,525 | 18,165 | 19,272 | 64,659 | (26,419 | ) | |||||||||||||||||||
Equity in income of unconsolidated entities | 720 | 719 | 718 | 725 | 718 | 2,882 | 1,332 | ||||||||||||||||||||
Income tax expense | (953 | ) | (57 | ) | (48 | ) | (40 | ) | (272 | ) | (1,098 | ) | (244 | ) | |||||||||||||
Income (loss) before gain on sales of real estate | 6,904 | 21,494 | 19,195 | 18,850 | 19,718 | 66,443 | (25,331 | ) | |||||||||||||||||||
Gain on sales of real estate | 4,452 | 1,188 | 12 | 4,238 | 6,885 | 9,890 | 40,986 | ||||||||||||||||||||
Net income | 11,356 | 22,682 | 19,207 | 23,088 | 26,603 | 76,333 | 15,655 | ||||||||||||||||||||
Net (income) loss attributable to noncontrolling interests | |||||||||||||||||||||||||||
Common units in the Operating Partnership | (325 | ) | (704 | ) | (273 | ) | (634 | ) | (793 | ) | (1,936 | ) | 155 | ||||||||||||||
Preferred units in the Operating Partnership | (165 | ) | (165 | ) | (165 | ) | (165 | ) | (165 | ) | (660 | ) | (660 | ) | |||||||||||||
Other consolidated entities | (908 | ) | (897 | ) | (907 | ) | (934 | ) | (912 | ) | (3,646 | ) | (3,711 | ) | |||||||||||||
Net income attributable to COPT | 9,958 | 20,916 | 17,862 | 21,355 | 24,733 | 70,091 | 11,439 | ||||||||||||||||||||
Preferred share dividends | — | — | (3,039 | ) | (3,180 | ) | (3,640 | ) | (6,219 | ) | (14,297 | ) | |||||||||||||||
Issuance costs associated with redeemed preferred shares | — | — | (6,847 | ) | — | (17 | ) | (6,847 | ) | (17 | ) | ||||||||||||||||
Net income (loss) attributable to COPT common shareholders | $ | 9,958 | $ | 20,916 | $ | 7,976 | $ | 18,175 | $ | 21,076 | $ | 57,025 | $ | (2,875 | ) | ||||||||||||
Amount allocable to share-based compensation awards | (112 | ) | (95 | ) | (117 | ) | (125 | ) | (100 | ) | (449 | ) | (419 | ) | |||||||||||||
Numerator for diluted EPS | $ | 9,846 | $ | 20,821 | $ | 7,859 | $ | 18,050 | $ | 20,976 | $ | 56,576 | $ | (3,294 | ) | ||||||||||||
Three Months Ended | Year Ended | ||||||||||||||||||||||||||
12/31/17 | 9/30/17 | 6/30/17 | 3/31/17 | 12/31/16 | 12/31/17 | 12/31/16 | |||||||||||||||||||||
Net income | $ | 11,356 | $ | 22,682 | $ | 19,207 | $ | 23,088 | $ | 26,603 | $ | 76,333 | $ | 15,655 | |||||||||||||
Real estate-related depreciation and amortization | 33,938 | 34,438 | 32,793 | 33,059 | 32,929 | 134,228 | 132,719 | ||||||||||||||||||||
Impairment losses (recoveries) on previously depreciated operating properties | 9,004 | (159 | ) | 1,610 | — | 1,518 | 10,455 | 83,346 | |||||||||||||||||||
Gain on sales of previously depreciated operating properties | (4,452 | ) | (8 | ) | (12 | ) | (19 | ) | 312 | (4,491 | ) | (33,789 | ) | ||||||||||||||
Depreciation and amortization on unconsolidated real estate JV (1) | 311 | 310 | 311 | 311 | 311 | 1,243 | 518 | ||||||||||||||||||||
FFO - per NAREIT (2)(3) | 50,157 | 57,263 | 53,909 | 56,439 | 61,673 | 217,768 | 198,449 | ||||||||||||||||||||
Preferred share dividends | — | — | (3,039 | ) | (3,180 | ) | (3,640 | ) | (6,219 | ) | (14,297 | ) | |||||||||||||||
Issuance costs associated with redeemed preferred shares | — | — | (6,847 | ) | — | (17 | ) | (6,847 | ) | (17 | ) | ||||||||||||||||
Noncontrolling interests - preferred units in the Operating Partnership | (165 | ) | (165 | ) | (165 | ) | (165 | ) | (165 | ) | (660 | ) | (660 | ) | |||||||||||||
FFO allocable to other noncontrolling interests (4) | (874 | ) | (917 | ) | (906 | ) | (978 | ) | (1,085 | ) | (3,675 | ) | (4,020 | ) | |||||||||||||
Basic and diluted FFO allocable to share-based compensation awards | (198 | ) | (215 | ) | (185 | ) | (216 | ) | (208 | ) | (814 | ) | (694 | ) | |||||||||||||
Basic and Diluted FFO available to common share and common unit holders (3) | 48,920 | 55,966 | 42,767 | 51,900 | 56,558 | 199,553 | 178,761 | ||||||||||||||||||||
Gain on sales of non-operating properties | — | (1,180 | ) | — | (4,219 | ) | (7,197 | ) | (5,399 | ) | (7,197 | ) | |||||||||||||||
Impairment losses (recoveries) on non-operating properties | 4,655 | (2 | ) | 15 | — | 36 | 4,668 | 18,045 | |||||||||||||||||||
Income tax expense associated with FFO comparability adjustments | 800 | — | — | — | — | 800 | — | ||||||||||||||||||||
(Gain) loss on interest rate derivatives | (191 | ) | (34 | ) | 444 | (453 | ) | (725 | ) | (234 | ) | (378 | ) | ||||||||||||||
Loss on early extinguishment of debt | — | — | 513 | — | 1,073 | 513 | 1,110 | ||||||||||||||||||||
Issuance costs associated with redeemed preferred shares | — | — | 6,847 | — | 17 | 6,847 | 17 | ||||||||||||||||||||
Demolition costs on redevelopment properties | — | — | 72 | 222 | — | 294 | 578 | ||||||||||||||||||||
Executive transition costs | — | 2 | 31 | 699 | 431 | 732 | 6,454 | ||||||||||||||||||||
Diluted FFO comparability adjustments allocable to share-based compensation awards | (23 | ) | 5 | (31 | ) | 14 | 26 | (35 | ) | (73 | ) | ||||||||||||||||
Diluted FFO avail. to common share and common unit holders, as adj. for comparability (3) | $ | 54,161 | $ | 54,757 | $ | 50,658 | $ | 48,163 | $ | 50,219 | $ | 207,739 | $ | 197,317 | |||||||||||||
(1) FFO adjustment pertaining to COPT’s share of an unconsolidated real estate joint venture reported on page 34. | |||||||||||||||||||||||||||
(2) Please see reconciliation on page 35 for components of FFO per NAREIT. | |||||||||||||||||||||||||||
(3) Please refer to the section entitled “Definitions” for a definition of this measure. | |||||||||||||||||||||||||||
(4) Pertains to noncontrolling interests in consolidated real estate joint ventures reported on page 33. | |||||||||||||||||||||||||||
Three Months Ended | Year Ended | ||||||||||||||||||||||||||
12/31/17 | 9/30/17 | 6/30/17 | 3/31/17 | 12/31/16 | 12/31/17 | 12/31/16 | |||||||||||||||||||||
EPS Denominator: | |||||||||||||||||||||||||||
Weighted average common shares - basic | 99,304 | 99,112 | 99,036 | 98,411 | 95,066 | 98,969 | 94,502 | ||||||||||||||||||||
Dilutive effect of forward equity sale agreements and share-based compensation awards | 283 | 146 | 160 | 155 | 76 | 186 | — | ||||||||||||||||||||
Weighted average common shares - diluted | 99,587 | 99,258 | 99,196 | 98,566 | 95,142 | 99,155 | 94,502 | ||||||||||||||||||||
Diluted EPS | $ | 0.10 | $ | 0.21 | $ | 0.08 | $ | 0.18 | $ | 0.22 | $ | 0.57 | $ | (0.03 | ) | ||||||||||||
Weighted Average Shares for period ended: | |||||||||||||||||||||||||||
Common Shares Outstanding | 99,304 | 99,112 | 99,036 | 98,411 | 95,066 | 98,969 | 94,502 | ||||||||||||||||||||
Dilutive effect of forward equity sale agreements and share-based compensation awards | 283 | 146 | 160 | 155 | 76 | 186 | 92 | ||||||||||||||||||||
Common Units | 3,252 | 3,350 | 3,405 | 3,446 | 3,591 | 3,362 | 3,633 | ||||||||||||||||||||
Denominator for diluted FFO per share and as adjusted for comparability | 102,839 | 102,608 | 102,601 | 102,012 | 98,733 | 102,517 | 98,227 | ||||||||||||||||||||
Weighted average common units | (3,252 | ) | (3,350 | ) | (3,405 | ) | (3,446 | ) | (3,591 | ) | (3,362 | ) | (3,633 | ) | |||||||||||||
Anti-dilutive EPS effect of share-based compensation awards | — | — | — | — | — | — | (92 | ) | |||||||||||||||||||
Denominator for diluted EPS | 99,587 | 99,258 | 99,196 | 98,566 | 95,142 | 99,155 | 94,502 | ||||||||||||||||||||
Diluted FFO per share - NAREIT | $ | 0.48 | $ | 0.55 | $ | 0.42 | $ | 0.51 | $ | 0.57 | $ | 1.95 | $ | 1.82 | |||||||||||||
Diluted FFO per share - as adjusted for comparability | $ | 0.53 | $ | 0.53 | $ | 0.49 | $ | 0.47 | $ | 0.51 | $ | 2.03 | $ | 2.01 | |||||||||||||
Three Months Ended | Year Ended | ||||||||||||||||||||||||||
12/31/17 | 9/30/17 | 6/30/17 | 3/31/17 | 12/31/16 | 12/31/17 | 12/31/16 | |||||||||||||||||||||
Diluted FFO available to common share and common unit holders, as adjusted for comparability | $ | 54,161 | $ | 54,757 | $ | 50,658 | $ | 48,163 | $ | 50,219 | $ | 207,739 | $ | 197,317 | |||||||||||||
Straight line rent adjustments and lease incentive amortization | (1,343 | ) | (561 | ) | 1,517 | 433 | 1,294 | 46 | 1,500 | ||||||||||||||||||
Amortization of intangibles included in NOI | 342 | 318 | 325 | 359 | 463 | 1,344 | 1,488 | ||||||||||||||||||||
Share-based compensation, net of amounts capitalized | 1,523 | 1,272 | 1,309 | 1,249 | 1,174 | 5,353 | 5,549 | ||||||||||||||||||||
Amortization of deferred financing costs | 443 | 554 | 922 | 1,009 | 1,093 | 2,928 | 4,573 | ||||||||||||||||||||
Amortization of net debt discounts, net of amounts capitalized | 350 | 347 | 343 | 339 | 336 | 1,379 | 1,312 | ||||||||||||||||||||
Accum. other comprehensive loss on derivatives amortized to expense | 54 | 53 | 36 | — | — | 143 | — | ||||||||||||||||||||
Replacement capital expenditures (1) | (23,475 | ) | (15,233 | ) | (11,269 | ) | (13,049 | ) | (13,716 | ) | (63,026 | ) | (53,102 | ) | |||||||||||||
Other diluted AFFO adjustments associated with real estate JVs (2) | (135 | ) | (148 | ) | (154 | ) | (156 | ) | (146 | ) | (593 | ) | (150 | ) | |||||||||||||
Diluted AFFO available to common share and common unit holders (“diluted AFFO”) | $ | 31,920 | $ | 41,359 | $ | 43,687 | $ | 38,347 | $ | 40,717 | $ | 155,313 | $ | 158,487 | |||||||||||||
Replacement capital expenditures (1) | |||||||||||||||||||||||||||
Tenant improvements and incentives | $ | 14,804 | $ | 11,342 | $ | 6,148 | $ | 4,740 | $ | 8,000 | $ | 37,034 | $ | 45,020 | |||||||||||||
Building improvements | 9,241 | 3,865 | 5,972 | 3,230 | 7,064 | 22,308 | 22,026 | ||||||||||||||||||||
Leasing costs | 3,242 | 2,428 | 1,666 | 1,151 | 1,387 | 8,487 | 9,365 | ||||||||||||||||||||
Net (exclusions from) additions to tenant improvements and incentives | (2,929 | ) | (1,509 | ) | 626 | 6,796 | 871 | 2,984 | (14,073 | ) | |||||||||||||||||
Excluded building improvements | (853 | ) | (893 | ) | (3,143 | ) | (2,868 | ) | (3,606 | ) | (7,757 | ) | (8,817 | ) | |||||||||||||
Excluded leasing costs | (30 | ) | — | — | — | — | (30 | ) | (419 | ) | |||||||||||||||||
Replacement capital expenditures | $ | 23,475 | $ | 15,233 | $ | 11,269 | $ | 13,049 | $ | 13,716 | $ | 63,026 | $ | 53,102 | |||||||||||||
(1) Please refer to the section entitled “Definitions” for a definition of this measure. | |||||||||||||||||||||||||||
(2) AFFO adjustments pertaining to noncontrolling interests on consolidated joint ventures reported on page 33 and COPT’s share of an unconsolidated real estate joint venture reported on page 34. | |||||||||||||||||||||||||||
Three Months Ended | Year Ended | |||||||||||||||||||||||||||
12/31/17 | 9/30/17 | 6/30/17 | 3/31/17 | 12/31/16 | 12/31/17 | 12/31/16 | ||||||||||||||||||||||
Net income | $ | 11,356 | $ | 22,682 | $ | 19,207 | $ | 23,088 | $ | 26,603 | $ | 76,333 | $ | 15,655 | ||||||||||||||
Interest expense | 19,211 | 19,615 | 19,163 | 18,994 | 18,664 | 76,983 | 83,163 | |||||||||||||||||||||
Income tax expense | 953 | 57 | 48 | 40 | 272 | 1,098 | 244 | |||||||||||||||||||||
Depreciation of furniture, fixtures and equipment | 600 | 577 | 585 | 511 | 512 | 2,273 | 2,151 | |||||||||||||||||||||
Real estate-related depreciation and amortization | 33,938 | 34,438 | 32,793 | 33,059 | 32,929 | 134,228 | 132,719 | |||||||||||||||||||||
Impairment losses (recoveries) | 13,659 | (161 | ) | 1,625 | — | 1,554 | 15,123 | 101,391 | ||||||||||||||||||||
Loss on early extinguishment of debt | — | — | 513 | — | 1,073 | 513 | 1,110 | |||||||||||||||||||||
Gain on sales of operating properties | (4,452 | ) | (8 | ) | (12 | ) | (19 | ) | 312 | (4,491 | ) | (33,789 | ) | |||||||||||||||
Gain on sales of non-operational properties | — | (1,180 | ) | — | (4,219 | ) | (7,197 | ) | (5,399 | ) | (7,197 | ) | ||||||||||||||||
Net gain on investments in unconsolidated entities included in interest and other income | — | — | — | — | (117 | ) | — | (149 | ) | |||||||||||||||||||
Business development expenses | 1,116 | 737 | 995 | 938 | 1,167 | 3,786 | 4,823 | |||||||||||||||||||||
Demolition costs on redevelopment properties | — | — | 72 | 222 | — | 294 | 578 | |||||||||||||||||||||
Adjustments from unconsolidated real estate JV (1) | 577 | 577 | 575 | 572 | 578 | 2,301 | 993 | |||||||||||||||||||||
Executive transition costs | — | 2 | 31 | 699 | 431 | 732 | 6,454 | |||||||||||||||||||||
Adjusted EBITDA | $ | 76,958 | $ | 77,336 | $ | 75,595 | $ | 73,885 | $ | 76,781 | $ | 303,774 | $ | 308,146 | ||||||||||||||
Proforma NOI adjustment for property changes within period | (578 | ) | (410 | ) | 421 | (440 | ) | 39 | ||||||||||||||||||||
In-place adjusted EBITDA | $ | 76,380 | $ | 76,926 | $ | 76,016 | $ | 73,445 | $ | 76,820 | ||||||||||||||||||
# of Properties | Operational Square Feet | Occupancy % | Leased % | |||||||||
Core Portfolio: (2) | ||||||||||||
Defense/IT Locations: | ||||||||||||
Fort Meade/Baltimore Washington (“BW”) Corridor: | ||||||||||||
National Business Park | 31 | 3,577 | 95.2 | % | 95.8 | % | ||||||
Howard County | 35 | 2,759 | 96.5 | % | 96.7 | % | ||||||
Other | 21 | 1,563 | 94.8 | % | 96.2 | % | ||||||
Total Fort Meade/BW Corridor | 87 | 7,899 | 95.6 | % | 96.2 | % | ||||||
Northern Virginia (“NoVA”) Defense/IT | 12 | 1,840 | 89.1 | % | 89.5 | % | ||||||
Lackland AFB (San Antonio, Texas) | 7 | 953 | 100.0 | % | 100.0 | % | ||||||
Navy Support | 21 | 1,253 | 87.7 | % | 88.7 | % | ||||||
Redstone Arsenal (Huntsville, Alabama) | 7 | 651 | 98.2 | % | 98.2 | % | ||||||
Data Center Shells | ||||||||||||
Consolidated Properties | 9 | 1,478 | 100.0 | % | 100.0 | % | ||||||
Unconsolidated JV Properties (3) | 6 | 962 | 100.0 | % | 100.0 | % | ||||||
Total Defense/IT Locations | 149 | 15,036 | 95.2 | % | 95.7 | % | ||||||
Regional Office | 7 | 2,023 | 89.5 | % | 90.6 | % | ||||||
Core Portfolio | 156 | 17,059 | 94.5 | % | 95.1 | % | ||||||
Other Properties | 3 | 286 | 34.4 | % | 44.0 | % | ||||||
Total Portfolio | 159 | 17,345 | 93.6 | % | 94.2 | % | ||||||
Consolidated Properties | 153 | 16,383 | 93.2 | % | 93.9 | % | ||||||
(1) | This presentation sets forth Core Portfolio data by segment followed by data for the remainder of the portfolio. |
(2) | Represents Defense/IT Locations and Regional Office properties. |
(3) | See page 34 for additional disclosure regarding an unconsolidated real estate joint venture. |
12/31/17 | |||||||||||||||||||||||||
# of Office and Data Center Shell Properties | Operational Square Feet | Office and Data Center Shell Properties Annualized Rental Revenue (2) | Percentage of Total Office and Data Center Shell Properties Annualized Rental Revenue (2) | NOI from Real Estate Operations for Three Months Ended | NOI from Real Estate Operations for Year Ended | ||||||||||||||||||||
Property Grouping | % Occupied (1) | % Leased (1) | 12/31/17 | 12/31/17 | |||||||||||||||||||||
Core Portfolio: | |||||||||||||||||||||||||
Same Properties (3) | 132 | 14,123 | 93.9% | 94.4% | $ | 437,679 | 91.4 | % | $ | 68,368 | $ | 271,909 | |||||||||||||
Properties Placed in Service (4) | 17 | 1,949 | 96.2% | 97.3% | 32,684 | 6.8 | % | 6,597 | 17,511 | ||||||||||||||||
Unconsolidated real estate JV (5) | 6 | 962 | 100.0% | 100.0% | 5,333 | 1.1 | % | 1,299 | 5,188 | ||||||||||||||||
Wholesale Data Center and Other | 1 | 25 | 100.0% | 100.0% | 578 | N/A | 4,269 | 15,476 | |||||||||||||||||
Total Core Portfolio | 156 | 17,059 | 94.5% | 95.1% | 476,274 | 99.5 | % | 80,533 | 310,084 | ||||||||||||||||
Disposed Office Properties | N/A | N/A | N/A | N/A | N/A | N/A | 727 | 11,818 | |||||||||||||||||
Other Properties (Same Property) | 3 | 286 | 34.4% | 44.0% | 2,558 | 0.5 | % | 275 | 2,302 | ||||||||||||||||
Total Portfolio | 159 | 17,345 | 93.6% | 94.2% | $ | 478,832 | 100.0 | % | $ | 81,535 | $ | 324,204 | |||||||||||||
Consolidated Properties | 153 | 16,383 | 93.2% | 93.9% | $ | 473,499 | 98.9 | % | $ | 80,236 | $ | 319,016 | |||||||||||||
12/31/17 | |||||||||||||||||||||||||
# of Office and Data Center Shell Properties | Operational Square Feet | Office and Data Center Shell Properties Annualized Rental Revenue (2) | Percentage of Core Office and Data Center Shell Properties Annualized Rental Revenue (2) | NOI from Real Estate Operations for Three Months Ended | NOI from Real Estate Operations for Year Ended | ||||||||||||||||||||
Property Grouping | % Occupied (1) | % Leased (1) | 12/31/17 | 12/31/17 | |||||||||||||||||||||
Core Portfolio: | |||||||||||||||||||||||||
Defense/IT Locations | |||||||||||||||||||||||||
Consolidated properties | 143 | 14,074 | 94.9% | 95.4% | $ | 413,219 | 86.8 | % | $ | 66,201 | $ | 253,008 | |||||||||||||
Unconsolidated real estate JV (5) | 6 | 962 | 100.0% | 100.0% | 5,333 | 1.1 | % | 1,299 | 5,188 | ||||||||||||||||
Total Defense/IT Locations | 149 | 15,036 | 95.2% | 95.7% | 418,552 | 87.9 | % | 67,500 | 258,196 | ||||||||||||||||
Regional Office | 7 | 2,023 | 89.5% | 90.6% | 57,722 | 12.1 | % | 8,911 | 36,529 | ||||||||||||||||
Wholesale Data Center and Other | N/A | N/A | N/A | N/A | N/A | N/A | 4,122 | 15,359 | |||||||||||||||||
Total Core Portfolio | 156 | 17,059 | 94.5% | 95.1% | $ | 476,274 | 100.0 | % | $ | 80,533 | $ | 310,084 | |||||||||||||
(1) | Percentages calculated based on operational square feet. |
(2) | Excludes Annualized Rental Revenue from our wholesale data center, DC-6, of $22.4 million as of 12/31/17. With regard to properties owned through unconsolidated real estate joint ventures, we include the portion of Annualized Rental Revenue allocable to COPT’s ownership interest. |
(3) | Office and data center shell properties continually owned and 100% operational since at least 1/1/2016. |
(4) | Newly constructed or redeveloped properties placed in service that were not fully operational by 1/1/2016. |
(5) | Represents total information pertaining to properties owned through an unconsolidated real estate joint venture except for the amounts reported for Annualized Rental Revenue and NOI from real estate operations, which represent the portion allocable to COPT’s ownership interest. See page 34 for additional disclosure regarding this joint venture. |
Three Months Ended | Year Ended | ||||||||||||||||||||||||||
12/31/17 | 9/30/17 | 6/30/17 | 3/31/17 | 12/31/16 | 12/31/17 | 12/31/16 | |||||||||||||||||||||
Consolidated real estate revenues | |||||||||||||||||||||||||||
Defense/IT Locations: | |||||||||||||||||||||||||||
Fort Meade/BW Corridor | $ | 62,220 | $ | 61,254 | $ | 61,284 | $ | 60,855 | $ | 60,473 | $ | 245,613 | $ | 245,354 | |||||||||||||
NoVA Defense/IT | 12,126 | 12,190 | 11,095 | 11,707 | 12,560 | 47,118 | 48,964 | ||||||||||||||||||||
Lackland Air Force Base | 11,522 | 11,024 | 13,029 | 11,634 | 12,395 | 47,209 | 46,803 | ||||||||||||||||||||
Navy Support | 7,587 | 7,494 | 7,449 | 7,010 | 7,033 | 29,540 | 28,197 | ||||||||||||||||||||
Redstone Arsenal | 3,706 | 3,532 | 3,624 | 3,460 | 3,560 | 14,322 | 13,056 | ||||||||||||||||||||
Data Center Shells-Consolidated | 6,322 | 6,676 | 5,800 | 5,522 | 5,043 | 24,320 | 23,836 | ||||||||||||||||||||
Total Defense/IT Locations | 103,483 | 102,170 | 102,281 | 100,188 | 101,064 | 408,122 | 406,210 | ||||||||||||||||||||
Regional Office | 15,868 | 16,656 | 17,462 | 18,276 | 18,521 | 68,262 | 85,805 | ||||||||||||||||||||
Wholesale Data Center | 7,674 | 7,398 | 7,033 | 6,770 | 6,763 | 28,875 | 26,869 | ||||||||||||||||||||
Other | 660 | 1,007 | 1,521 | 1,533 | 1,651 | 4,721 | 7,080 | ||||||||||||||||||||
Consolidated real estate revenues | $ | 127,685 | $ | 127,231 | $ | 128,297 | $ | 126,767 | $ | 127,999 | $ | 509,980 | $ | 525,964 | |||||||||||||
NOI | |||||||||||||||||||||||||||
Defense/IT Locations: | |||||||||||||||||||||||||||
Fort Meade/BW Corridor | $ | 41,880 | $ | 41,546 | $ | 41,155 | $ | 40,335 | $ | 41,011 | $ | 164,916 | $ | 161,670 | |||||||||||||
NoVA Defense/IT | 8,202 | 7,847 | 6,876 | 7,255 | 8,046 | 30,180 | 31,140 | ||||||||||||||||||||
Lackland Air Force Base | 4,835 | 4,831 | 4,899 | 4,832 | 4,901 | 19,397 | 19,446 | ||||||||||||||||||||
Navy Support | 4,359 | 4,337 | 4,424 | 3,801 | 3,916 | 16,921 | 15,507 | ||||||||||||||||||||
Redstone Arsenal | 2,217 | 2,100 | 2,133 | 2,089 | 2,134 | 8,539 | 8,580 | ||||||||||||||||||||
Data Center Shells | |||||||||||||||||||||||||||
Consolidated properties | 5,486 | 6,039 | 5,223 | 4,863 | 4,533 | 21,611 | 21,162 | ||||||||||||||||||||
COPT’s share of unconsolidated real estate JV (1) | 1,299 | 1,297 | 1,294 | 1,298 | 1,297 | 5,188 | 2,305 | ||||||||||||||||||||
Total Defense/IT Locations | 68,278 | 67,997 | 66,004 | 64,473 | 65,838 | 266,752 | 259,810 | ||||||||||||||||||||
Regional Office | 8,860 | 9,250 | 10,380 | 10,790 | 11,133 | 39,280 | 51,710 | ||||||||||||||||||||
Wholesale Data Center | 4,164 | 4,223 | 3,532 | 3,405 | 3,880 | 15,324 | 15,357 | ||||||||||||||||||||
Other | 233 | 690 | 1,047 | 878 | 883 | 2,848 | 3,862 | ||||||||||||||||||||
NOI from real estate operations | $ | 81,535 | $ | 82,160 | $ | 80,963 | $ | 79,546 | $ | 81,734 | $ | 324,204 | $ | 330,739 | |||||||||||||
Three Months Ended | Year Ended | ||||||||||||||||||||||||||
12/31/17 | 9/30/17 | 6/30/17 | 3/31/17 | 12/31/16 | 12/31/17 | 12/31/16 | |||||||||||||||||||||
Cash NOI | |||||||||||||||||||||||||||
Defense/IT Locations: | |||||||||||||||||||||||||||
Fort Meade/BW Corridor | $ | 41,893 | $ | 41,837 | $ | 40,550 | $ | 40,481 | $ | 40,872 | $ | 164,761 | $ | 159,215 | |||||||||||||
NoVA Defense/IT | 7,530 | 8,310 | 7,195 | 7,046 | 7,766 | 30,081 | 30,536 | ||||||||||||||||||||
Lackland Air Force Base | 5,016 | 4,886 | 4,943 | 4,876 | 4,945 | 19,721 | 19,234 | ||||||||||||||||||||
Navy Support | 4,354 | 4,279 | 4,462 | 3,866 | 3,612 | 16,961 | 14,550 | ||||||||||||||||||||
Redstone Arsenal | 2,557 | 2,491 | 2,411 | 2,422 | 2,326 | 9,881 | 9,744 | ||||||||||||||||||||
Data Center Shells | |||||||||||||||||||||||||||
Consolidated properties | 4,646 | 5,412 | 5,172 | 4,823 | 4,519 | 20,053 | 20,253 | ||||||||||||||||||||
COPT’s share of unconsolidated real estate JV (1) | 1,130 | 1,120 | 1,109 | 1,110 | 1,103 | 4,469 | 1,965 | ||||||||||||||||||||
Total Defense/IT Locations | 67,126 | 68,335 | 65,842 | 64,624 | 65,143 | 265,927 | 255,497 | ||||||||||||||||||||
Regional Office | 8,560 | 9,075 | 10,179 | 9,916 | 10,967 | 37,730 | 50,599 | ||||||||||||||||||||
Wholesale Data Center | 3,470 | 3,352 | 3,211 | 3,382 | 3,833 | 13,415 | 15,052 | ||||||||||||||||||||
Other | 263 | 580 | 839 | 624 | 739 | 2,306 | 3,389 | ||||||||||||||||||||
Cash NOI from real estate operations | $ | 79,419 | $ | 81,342 | $ | 80,071 | $ | 78,546 | $ | 80,682 | $ | 319,378 | $ | 324,537 | |||||||||||||
Straight line rent adjustments and lease incentive amortization | 1,027 | 244 | (1,832 | ) | (775 | ) | (1,650 | ) | (1,336 | ) | (3,087 | ) | |||||||||||||||
Amortization of acquired above- and below-market rents | (287 | ) | (263 | ) | (270 | ) | (303 | ) | (315 | ) | (1,123 | ) | (895 | ) | |||||||||||||
Amortization of below-market cost arrangements | (149 | ) | (148 | ) | (149 | ) | (149 | ) | (244 | ) | (595 | ) | (966 | ) | |||||||||||||
Lease termination fees, gross | 828 | 860 | 517 | 706 | 938 | 2,911 | 2,806 | ||||||||||||||||||||
Tenant funded landlord assets | 528 | (52 | ) | 2,441 | 1,333 | 2,129 | 4,250 | 8,004 | |||||||||||||||||||
Cash NOI adjustments in unconsolidated real estate JV | 169 | 177 | 185 | 188 | 194 | 719 | 340 | ||||||||||||||||||||
NOI from real estate operations | $ | 81,535 | $ | 82,160 | $ | 80,963 | $ | 79,546 | $ | 81,734 | $ | 324,204 | $ | 330,739 | |||||||||||||
Number of Buildings | Rentable Square Feet | Three Months Ended | Year Ended | |||||||||||||||||||||||
12/31/17 | 9/30/17 | 6/30/17 | 3/31/17 | 12/31/16 | 12/31/17 | 12/31/16 | ||||||||||||||||||||
Core Portfolio: | ||||||||||||||||||||||||||
Defense/IT Locations: | ||||||||||||||||||||||||||
Fort Meade/BW Corridor | 79 | 7,506 | 96.3 | % | 96.1 | % | 96.0 | % | 95.9 | % | 95.5 | % | 96.1 | % | 95.2 | % | ||||||||||
NoVA Defense/IT | 11 | 1,600 | 87.5 | % | 86.9 | % | 86.3 | % | 85.9 | % | 84.0 | % | 86.6 | % | 81.9 | % | ||||||||||
Lackland Air Force Base | 7 | 953 | 100.0 | % | 100.0 | % | 100.0 | % | 100.0 | % | 100.0 | % | 100.0 | % | 100.0 | % | ||||||||||
Navy Support | 21 | 1,254 | 85.6 | % | 82.5 | % | 80.9 | % | 77.2 | % | 73.3 | % | 81.5 | % | 73.0 | % | ||||||||||
Redstone Arsenal | 6 | 632 | 99.2 | % | 99.7 | % | 100.0 | % | 97.6 | % | 98.8 | % | 99.1 | % | 98.7 | % | ||||||||||
Data Center Shells | 1 | 155 | 100.0 | % | 100.0 | % | 100.0 | % | 100.0 | % | 100.0 | % | 100.0 | % | 100.0 | % | ||||||||||
Total Defense/IT Locations | 125 | 12,100 | 94.5 | % | 94.0 | % | 93.7 | % | 93.1 | % | 92.3 | % | 93.8 | % | 91.8 | % | ||||||||||
Regional Office | 7 | 2,023 | 90.0 | % | 92.5 | % | 92.8 | % | 93.5 | % | 94.4 | % | 92.2 | % | 96.3 | % | ||||||||||
Core Portfolio Same Properties | 132 | 14,123 | 93.9 | % | 93.8 | % | 93.6 | % | 93.2 | % | 92.6 | % | 93.6 | % | 92.4 | % | ||||||||||
Other Same Properties | 3 | 286 | 32.5 | % | 34.3 | % | 44.0 | % | 44.0 | % | 44.0 | % | 38.7 | % | 43.8 | % | ||||||||||
Total Same Properties | 135 | 14,409 | 92.7 | % | 92.6 | % | 92.6 | % | 92.2 | % | 91.6 | % | 92.5 | % | 91.5 | % | ||||||||||
Corporate Office Properties Trust Same Properties (1) Period End Occupancy Rates by Segment (square feet in thousands) | ||||||||||||||||||||||||||
Number of Buildings | Rentable Square Feet | |||||||||||||||||||||||||
12/31/17 | 9/30/17 | 6/30/17 | 3/31/17 | 12/31/16 | ||||||||||||||||||||||
Core Portfolio: | ||||||||||||||||||||||||||
Defense/IT Locations: | ||||||||||||||||||||||||||
Fort Meade/BW Corridor | 79 | 7,506 | 96.2 | % | 96.4 | % | 95.8 | % | 96.0 | % | 95.8 | % | ||||||||||||||
NoVA Defense/IT | 11 | 1,600 | 87.5 | % | 87.0 | % | 86.5 | % | 85.9 | % | 84.8 | % | ||||||||||||||
Lackland Air Force Base | 7 | 953 | 100.0 | % | 100.0 | % | 100.0 | % | 100.0 | % | 100.0 | % | ||||||||||||||
Navy Support | 21 | 1,254 | 87.7 | % | 82.5 | % | 81.9 | % | 78.1 | % | 72.7 | % | ||||||||||||||
Redstone Arsenal | 6 | 632 | 99.2 | % | 99.2 | % | 100.0 | % | 100.0 | % | 96.3 | % | ||||||||||||||
Data Center Shells | 1 | 155 | 100.0 | % | 100.0 | % | 100.0 | % | 100.0 | % | 100.0 | % | ||||||||||||||
Total Defense/IT Locations | 125 | 12,100 | 94.7 | % | 94.2 | % | 93.7 | % | 93.4 | % | 92.3 | % | ||||||||||||||
Regional Office | 7 | 2,023 | 89.5 | % | 92.4 | % | 92.5 | % | 92.8 | % | 95.1 | % | ||||||||||||||
Core Portfolio Same Properties | 132 | 14,123 | 93.9 | % | 93.9 | % | 93.6 | % | 93.3 | % | 92.7 | % | ||||||||||||||
Other Same Properties | 3 | 286 | 34.4 | % | 29.4 | % | 44.0 | % | 44.0 | % | 44.0 | % | ||||||||||||||
Total Same Properties | 135 | 14,409 | 92.8 | % | 92.6 | % | 92.6 | % | 92.3 | % | 91.8 | % | ||||||||||||||
Three Months Ended | Year Ended | ||||||||||||||||||||||||||
12/31/17 | 9/30/17 | 6/30/17 | 3/31/17 | 12/31/16 | 12/31/17 | 12/31/16 | |||||||||||||||||||||
Same property real estate revenues | |||||||||||||||||||||||||||
Defense/IT Locations: | |||||||||||||||||||||||||||
Fort Meade/BW Corridor | $ | 59,514 | $ | 58,761 | $ | 58,895 | $ | 59,441 | $ | 58,910 | $ | 236,611 | $ | 234,348 | |||||||||||||
NoVA Defense/IT | 11,030 | 11,120 | 11,096 | 11,004 | 11,019 | 44,250 | 41,533 | ||||||||||||||||||||
Lackland Air Force Base | 11,523 | 11,024 | 13,029 | 11,634 | 12,395 | 47,210 | 46,803 | ||||||||||||||||||||
Navy Support | 7,586 | 7,494 | 7,449 | 7,010 | 7,033 | 29,539 | 28,197 | ||||||||||||||||||||
Redstone Arsenal | 3,256 | 3,205 | 3,246 | 3,158 | 3,297 | 12,865 | 12,651 | ||||||||||||||||||||
Data Center Shells | 615 | 615 | 612 | 612 | 613 | 2,454 | 2,442 | ||||||||||||||||||||
Total Defense/IT Locations | 93,524 | 92,219 | 94,327 | 92,859 | 93,267 | 372,929 | 365,974 | ||||||||||||||||||||
Regional Office | 15,871 | 16,201 | 15,777 | 16,563 | 16,375 | 64,412 | 65,874 | ||||||||||||||||||||
Other Properties | 658 | 924 | 1,146 | 1,203 | 1,022 | 3,931 | 3,917 | ||||||||||||||||||||
Same property real estate revenues | $ | 110,053 | $ | 109,344 | $ | 111,250 | $ | 110,625 | $ | 110,664 | $ | 441,272 | $ | 435,765 | |||||||||||||
Same property NOI | |||||||||||||||||||||||||||
Defense/IT Locations: | |||||||||||||||||||||||||||
Fort Meade/BW Corridor | $ | 40,171 | $ | 40,005 | $ | 39,537 | $ | 39,792 | $ | 39,950 | $ | 159,505 | $ | 155,167 | |||||||||||||
NoVA Defense/IT | 7,190 | 6,969 | 7,051 | 6,959 | 7,100 | 28,169 | 26,297 | ||||||||||||||||||||
Lackland Air Force Base | 4,835 | 4,831 | 4,899 | 4,832 | 4,902 | 19,397 | 19,447 | ||||||||||||||||||||
Navy Support | 4,360 | 4,337 | 4,424 | 3,801 | 3,916 | 16,922 | 15,506 | ||||||||||||||||||||
Redstone Arsenal | 2,356 | 2,258 | 2,332 | 2,262 | 2,390 | 9,208 | 8,886 | ||||||||||||||||||||
Data Center Shells | 548 | 547 | 547 | 546 | 549 | 2,188 | 2,185 | ||||||||||||||||||||
Total Defense/IT Locations | 59,460 | 58,947 | 58,790 | 58,192 | 58,807 | 235,389 | 227,488 | ||||||||||||||||||||
Regional Office | 8,909 | 8,898 | 9,167 | 9,547 | 9,645 | 36,521 | 38,522 | ||||||||||||||||||||
Other Properties | 274 | 518 | 766 | 743 | 650 | 2,301 | 2,321 | ||||||||||||||||||||
Same property NOI | $ | 68,643 | $ | 68,363 | $ | 68,723 | $ | 68,482 | $ | 69,102 | $ | 274,211 | $ | 268,331 | |||||||||||||
Three Months Ended | Year Ended | ||||||||||||||||||||||||||
12/31/17 | 9/30/17 | 6/30/17 | 3/31/17 | 12/31/16 | 12/31/17 | 12/31/16 | |||||||||||||||||||||
Same property cash NOI | |||||||||||||||||||||||||||
Defense/IT Locations: | |||||||||||||||||||||||||||
Fort Meade/BW Corridor | $ | 40,402 | $ | 40,653 | $ | 39,461 | $ | 39,965 | $ | 39,849 | $ | 160,481 | $ | 153,879 | |||||||||||||
NoVA Defense/IT | 7,575 | 7,476 | 7,369 | 6,989 | 7,044 | 29,409 | 26,226 | ||||||||||||||||||||
Lackland Air Force Base | 5,016 | 4,886 | 4,943 | 4,876 | 4,946 | 19,721 | 19,234 | ||||||||||||||||||||
Navy Support | 4,354 | 4,279 | 4,462 | 3,866 | 3,612 | 16,961 | 14,550 | ||||||||||||||||||||
Redstone Arsenal | 2,716 | 2,658 | 2,620 | 2,603 | 2,590 | 10,597 | 10,090 | ||||||||||||||||||||
Data Center Shells | 631 | 632 | 632 | 618 | 620 | 2,513 | 2,459 | ||||||||||||||||||||
Total Defense/IT Locations | 60,694 | 60,584 | 59,487 | 58,917 | 58,661 | 239,682 | 226,438 | ||||||||||||||||||||
Regional Office | 8,609 | 8,735 | 8,956 | 8,698 | 9,767 | 34,998 | 38,738 | ||||||||||||||||||||
Other Properties | 304 | 406 | 551 | 499 | 545 | 1,760 | 2,130 | ||||||||||||||||||||
Same property cash NOI | $ | 69,607 | $ | 69,725 | $ | 68,994 | $ | 68,114 | $ | 68,973 | $ | 276,440 | $ | 267,306 | |||||||||||||
Straight line rent adjustments and lease incentive amortization | (1,635 | ) | (1,760 | ) | (1,000 | ) | (156 | ) | (1,288 | ) | (4,551 | ) | (6,561 | ) | |||||||||||||
Amortization of acquired above- and below-market rents | (287 | ) | (263 | ) | (270 | ) | (303 | ) | (315 | ) | (1,123 | ) | (897 | ) | |||||||||||||
Amortization of below-market cost arrangements | (146 | ) | (147 | ) | (146 | ) | (146 | ) | (239 | ) | (585 | ) | (956 | ) | |||||||||||||
Lease termination fees, gross | 828 | 860 | 517 | 706 | 601 | 2,911 | 2,279 | ||||||||||||||||||||
Tenant funded landlord assets | 276 | (52 | ) | 628 | 267 | 1,370 | 1,119 | 7,160 | |||||||||||||||||||
Same property NOI | $ | 68,643 | $ | 68,363 | $ | 68,723 | $ | 68,482 | $ | 69,102 | $ | 274,211 | $ | 268,331 | |||||||||||||
Percentage change in total same property cash NOI (1) | 0.9 | % | 3.4 | % | |||||||||||||||||||||||
Percentage change in Defense/IT Locations same property cash NOI (1) | 3.5 | % | 5.8 | % | |||||||||||||||||||||||
Defense/IT Locations | |||||||||||||||||||||||||||||||||||
Ft Meade/BW Corridor | NoVA Defense/IT | Navy Support | Redstone Arsenal | Data Center Shells | Total Defense/IT Locations | Regional Office | Other | Total | |||||||||||||||||||||||||||
Renewed Space | |||||||||||||||||||||||||||||||||||
Leased Square Feet | 331 | 62 | 21 | — | — | 413 | 25 | — | 438 | ||||||||||||||||||||||||||
Expiring Square Feet | 393 | 62 | 25 | — | — | 480 | 89 | 1 | 570 | ||||||||||||||||||||||||||
Vacating Square Feet | 63 | — | 4 | — | — | 66 | 64 | 1 | 132 | ||||||||||||||||||||||||||
Retention Rate (% based upon square feet) | 84.1 | % | 100.0 | % | 84.4 | % | — | % | — | % | 86.1 | % | 28.2 | % | — | % | 76.9 | % | |||||||||||||||||
Statistics for Completed Leasing: | |||||||||||||||||||||||||||||||||||
Average Committed Cost per Square Foot (2) | $ | 15.51 | $ | 35.53 | $ | 1.61 | $ | — | $ | — | $ | 17.81 | $ | 2.20 | $ | — | $ | 16.91 | |||||||||||||||||
Weighted Average Lease Term in Years | 4.8 | 5.2 | 2.5 | — | — | 4.8 | 1.9 | — | 4.6 | ||||||||||||||||||||||||||
Average Rent Per Square Foot | |||||||||||||||||||||||||||||||||||
Renewal Average Rent | $ | 34.88 | $ | 36.38 | $ | 18.23 | $ | — | $ | — | $ | 34.27 | $ | 34.93 | $ | — | $ | 34.31 | |||||||||||||||||
Expiring Average Rent | $ | 32.32 | $ | 38.32 | $ | 20.12 | $ | — | $ | — | $ | 32.61 | $ | 31.55 | $ | — | $ | 32.55 | |||||||||||||||||
Change in Average Rent | 7.9 | % | (5.1 | )% | (9.4 | )% | — | % | — | % | 5.1 | % | 10.7 | % | — | % | 5.4 | % | |||||||||||||||||
Cash Rent Per Square Foot | |||||||||||||||||||||||||||||||||||
Renewal Cash Rent | $ | 33.47 | $ | 38.00 | $ | 20.24 | $ | — | $ | — | $ | 33.48 | $ | 34.72 | $ | — | $ | 33.56 | |||||||||||||||||
Expiring Cash Rent | $ | 33.95 | $ | 46.57 | $ | 21.08 | $ | — | $ | — | $ | 35.19 | $ | 35.12 | $ | — | $ | 35.19 | |||||||||||||||||
Change in Cash Rent | (1.4 | )% | (18.4 | )% | (4.0 | )% | — | % | — | % | (4.9 | )% | (1.1 | )% | — | % | (4.6 | )% | |||||||||||||||||
Average escalations per year | 2.6 | % | 2.8 | % | 1.9 | % | — | % | — | % | 2.6 | % | 1.3 | % | — | % | 2.6 | % | |||||||||||||||||
New Leases | |||||||||||||||||||||||||||||||||||
Development and Redevelopment Space | |||||||||||||||||||||||||||||||||||
Leased Square Feet | 26 | — | — | 21 | 446 | 493 | — | — | 493 | ||||||||||||||||||||||||||
Statistics for Completed Leasing: | |||||||||||||||||||||||||||||||||||
Average Committed Cost per Square Foot (2) | $ | 71.83 | $ | — | $ | — | $ | 75.78 | $ | — | $ | 7.07 | $ | — | $ | — | $ | 7.07 | |||||||||||||||||
Weighted Average Lease Term in Years | 8.0 | — | — | 14.0 | 10.0 | 10.1 | — | — | 10.1 | ||||||||||||||||||||||||||
Average Rent Per Square Foot | $ | 29.58 | $ | — | $ | — | $ | 23.90 | $ | 17.27 | $ | 18.21 | $ | — | $ | — | $ | 18.21 | |||||||||||||||||
Cash Rent Per Square Foot | $ | 28.08 | $ | — | $ | — | $ | 22.12 | $ | 15.78 | $ | 16.71 | $ | — | $ | — | $ | 16.71 | |||||||||||||||||
Other New Leases (3) | |||||||||||||||||||||||||||||||||||
Leased Square Feet | 99 | 3 | 24 | — | — | 126 | 46 | 28 | 199 | ||||||||||||||||||||||||||
Statistics for Completed Leasing: | |||||||||||||||||||||||||||||||||||
Average Committed Cost per Square Foot (2) | $ | 61.59 | $ | 37.94 | $ | 46.72 | $ | — | $ | — | $ | 58.23 | $ | 45.93 | $ | 6.61 | $ | 48.27 | |||||||||||||||||
Weighted Average Lease Term in Years | 6.8 | 5.0 | 4.4 | — | — | 6.3 | 5.0 | 2.0 | 5.4 | ||||||||||||||||||||||||||
Average Rent Per Square Foot | $ | 26.03 | $ | 29.60 | $ | 32.09 | $ | — | $ | — | $ | 27.26 | $ | 32.10 | $ | 19.80 | $ | 27.34 | |||||||||||||||||
Cash Rent Per Square Foot | $ | 25.70 | $ | 27.72 | $ | 32.95 | $ | — | $ | — | $ | 27.12 | $ | 31.18 | $ | 19.00 | $ | 26.93 | |||||||||||||||||
Total Square Feet Leased | 456 | 65 | 45 | 21 | 446 | 1,032 | 71 | 28 | 1,130 | ||||||||||||||||||||||||||
Average escalations per year | 2.5 | % | 2.8 | % | 2.3 | % | 2.5 | % | 2.3 | % | 2.4 | % | 2.5 | % | 3.0 | % | 2.4 | % | |||||||||||||||||
Average escalations excl. data center shells | 2.6 | % | |||||||||||||||||||||||||||||||||
(1) | Activity is exclusive of owner occupied space and leases with less than a one-year term. Weighted average lease term is based on the non-cancelable term of tenant leases determined in accordance with GAAP. Committed costs for leasing are reported above in the period of lease execution. Actual capital expenditures for leasing are reported on page 9 in the period such costs are incurred. |
Defense/IT Locations | As Adjusted (4) | ||||||||||||||||||||||||||||||||||||||||||
Ft Meade/BW Corridor | NoVA Defense/IT | Navy Support | Redstone Arsenal | Data Center Shells | Total Defense/IT Locations | Regional Office | Other | Total | Ft Meade/BW Corridor | Total | |||||||||||||||||||||||||||||||||
Renewed Space | |||||||||||||||||||||||||||||||||||||||||||
Leased Square Feet | 957 | 237 | 146 | 242 | 155 | 1,737 | 101 | 37 | 1,875 | 832 | 1,750 | ||||||||||||||||||||||||||||||||
Expiring Square Feet | 1,082 | 240 | 158 | 247 | 155 | 1,882 | 347 | 86 | 2,315 | 956 | 2,190 | ||||||||||||||||||||||||||||||||
Vacating Square Feet | 124 | 3 | 13 | 5 | — | 145 | 246 | 49 | 440 | 124 | 440 | ||||||||||||||||||||||||||||||||
Retention Rate (% based upon square feet) | 88.5 | % | 98.8 | % | 92.0 | % | 98.0 | % | 100.0 | % | 92.3 | % | 29.2 | % | 43.1 | % | 81.0 | % | 87.0 | % | 79.9 | % | |||||||||||||||||||||
Statistics for Completed Leasing: | |||||||||||||||||||||||||||||||||||||||||||
Average Committed Cost per Square Foot (2) | $ | 11.83 | $ | 18.06 | $ | 6.59 | $ | 0.41 | $ | — | $ | 9.59 | $ | 13.60 | $ | 0.34 | $ | 9.63 | $ | 10.60 | $ | 8.88 | |||||||||||||||||||||
Weighted Average Lease Term in Years | 5.1 | 3.1 | 2.4 | 1.0 | 1.0 | 3.7 | 4.5 | 1.2 | 3.7 | 4.4 | 3.2 | ||||||||||||||||||||||||||||||||
Average Rent Per Square Foot | |||||||||||||||||||||||||||||||||||||||||||
Renewal Average Rent | $ | 35.65 | $ | 37.76 | $ | 23.83 | $ | 20.74 | $ | 17.26 | $ | 31.22 | $ | 29.31 | $ | 18.86 | $ | 30.88 | $ | 33.96 | $ | 29.73 | |||||||||||||||||||||
Expiring Average Rent | $ | 32.16 | $ | 35.61 | $ | 23.08 | $ | 19.18 | $ | 14.27 | $ | 28.46 | $ | 27.25 | $ | 18.53 | $ | 28.20 | $ | 31.42 | $ | 27.56 | |||||||||||||||||||||
Change in Average Rent | 10.9 | % | 6.0 | % | 3.2 | % | 8.1 | % | 21.0 | % | 9.7 | % | 7.5 | % | 1.8 | % | 9.5 | % | 8.1 | % | 7.9 | % | |||||||||||||||||||||
Cash Rent Per Square Foot | |||||||||||||||||||||||||||||||||||||||||||
Renewal Cash Rent | $ | 34.22 | $ | 38.14 | $ | 23.85 | $ | 20.74 | $ | 17.26 | $ | 30.49 | $ | 29.87 | $ | 18.82 | $ | 30.22 | $ | 32.93 | $ | 29.33 | |||||||||||||||||||||
Expiring Cash Rent | $ | 33.94 | $ | 40.62 | $ | 24.30 | $ | 20.23 | $ | 16.44 | $ | 30.57 | $ | 32.06 | $ | 19.62 | $ | 30.43 | $ | 33.02 | $ | 29.74 | |||||||||||||||||||||
Change in Cash Rent | 0.8 | % | (6.1 | )% | (1.9 | )% | 2.5 | % | 5.0 | % | (0.3 | )% | (6.8 | )% | (4.1 | )% | (0.7 | )% | (0.3 | )% | (1.4 | )% | |||||||||||||||||||||
Average escalations per year | 2.5 | % | 2.2 | % | 1.4 | % | — | % | — | % | 2.2 | % | 1.2 | % | 0.5 | % | 2.1 | % | 2.3 | % | 2.0 | % | |||||||||||||||||||||
New Leases | |||||||||||||||||||||||||||||||||||||||||||
Development and Redevelopment Space | |||||||||||||||||||||||||||||||||||||||||||
Leased Square Feet | 112 | 15 | — | 23 | 743 | 893 | 81 | — | 975 | 112 | 975 | ||||||||||||||||||||||||||||||||
Statistics for Completed Leasing: | |||||||||||||||||||||||||||||||||||||||||||
Average Committed Cost per Square Foot (2) | $ | 64.15 | $ | 89.27 | $ | — | $ | 69.82 | $ | — | $ | 11.38 | $ | 215.63 | $ | — | $ | 28.41 | $ | 64.15 | $ | 28.41 | |||||||||||||||||||||
Weighted Average Lease Term in Years | 7.7 | 7.5 | — | 13.1 | 10.8 | 10.4 | 16.3 | — | 10.9 | 7.7 | 10.9 | ||||||||||||||||||||||||||||||||
Average Rent Per Square Foot | $ | 29.12 | $ | 38.31 | $ | — | $ | 24.33 | $ | 17.74 | $ | 19.69 | $ | 93.09 | $ | — | $ | 25.81 | $ | 29.12 | $ | 25.81 | |||||||||||||||||||||
Cash Rent Per Square Foot | $ | 28.05 | $ | 37.56 | $ | — | $ | 22.70 | $ | 16.06 | $ | 18.10 | $ | 86.70 | $ | — | $ | 23.82 | $ | 28.05 | $ | 23.82 | |||||||||||||||||||||
Other New Leases (3) | |||||||||||||||||||||||||||||||||||||||||||
Leased Square Feet | 184 | 30 | 102 | — | — | 317 | 81 | 34 | 431 | 184 | 431 | ||||||||||||||||||||||||||||||||
Statistics for Completed Leasing: | |||||||||||||||||||||||||||||||||||||||||||
Average Committed Cost per Square Foot (2) | $ | 59.16 | $ | 73.91 | $ | 32.33 | $ | — | $ | — | $ | 51.88 | $ | 53.36 | $ | 5.67 | $ | 48.55 | $ | 59.16 | $ | 48.55 | |||||||||||||||||||||
Weighted Average Lease Term in Years | 6.8 | 5.6 | 4.9 | — | — | 6.1 | 6.5 | 2.0 | 5.8 | 6.8 | 5.8 | ||||||||||||||||||||||||||||||||
Average Rent Per Square Foot | $ | 28.38 | $ | 29.09 | $ | 20.91 | $ | — | $ | — | $ | 26.03 | $ | 31.09 | $ | 19.71 | $ | 26.49 | $ | 28.38 | $ | 26.49 | |||||||||||||||||||||
Cash Rent Per Square Foot | $ | 27.66 | $ | 28.91 | $ | 21.04 | $ | — | $ | — | $ | 25.64 | $ | 30.29 | $ | 19.54 | $ | 26.04 | $ | 27.66 | $ | 26.04 | |||||||||||||||||||||
Total Square Feet Leased | 1,254 | 282 | 248 | 265 | 898 | 2,947 | 264 | 71 | 3,282 | 1,128 | 3,156 | ||||||||||||||||||||||||||||||||
Average escalations per year | 2.5 | % | 2.4 | % | 2.0 | % | 1.4 | % | 2.2 | % | 2.3 | % | 2.1 | % | 2.0 | % | 2.3 | % | 2.3 | % | 2.2 | % | |||||||||||||||||||||
Average escalations excl. data center shells | 2.3 | % | 2.2 | % | |||||||||||||||||||||||||||||||||||||||
(1) | Activity is exclusive of owner occupied space and leases with less than a one-year term. Weighted average lease term is based on the non-cancelable term of tenant leases determined in accordance with GAAP. Committed costs for leasing are reported above in the period of lease execution. Actual capital expenditures for leasing are reported on page 9 in the period such costs are incurred. |
Segment of Lease and Year of Expiration (2) | Square Footage of Leases Expiring | Annualized Rental Revenue of Expiring Leases (3) | Percentage of Core/Total Annualized Rental Revenue Expiring (3)(4) | Annualized Rental Revenue of Expiring Leases per Occupied Sq. Foot | ||||||||||
Core Portfolio | ||||||||||||||
Ft Meade/BW Corridor | 1,599 | $ | 52,771 | 11.1 | % | $32.99 | ||||||||
NoVA Defense/IT | 33 | 735 | 0.2 | % | 22.58 | |||||||||
Navy Support | 381 | 11,207 | 2.4 | % | 29.42 | |||||||||
Redstone Arsenal | 11 | 235 | — | % | 21.85 | |||||||||
Regional Office | 89 | 3,758 | 0.8 | % | 42.34 | |||||||||
2018 | 2,113 | 68,706 | 14.4 | % | 32.53 | |||||||||
Ft Meade/BW Corridor | 1,545 | 51,929 | 10.9 | % | 33.61 | |||||||||
NoVA Defense/IT | 346 | 13,086 | 2.7 | % | 37.82 | |||||||||
Navy Support | 121 | 3,617 | 0.8 | % | 29.90 | |||||||||
Redstone Arsenal | 285 | 7,397 | 1.6 | % | 25.95 | |||||||||
Data Center Shells-Consolidated properties | 155 | 2,547 | 0.5 | % | 16.44 | |||||||||
Regional Office | 209 | 5,747 | 1.2 | % | 27.52 | |||||||||
2019 | 2,661 | 84,323 | 17.7 | % | 31.69 | |||||||||
Ft Meade/BW Corridor | 1,015 | 33,786 | 7.1 | % | 33.27 | |||||||||
NoVA Defense/IT | 175 | 5,106 | 1.1 | % | 29.16 | |||||||||
Lackland Air Force Base | 250 | 11,044 | 2.3 | % | 44.12 | |||||||||
Navy Support | 112 | 3,698 | 0.8 | % | 33.04 | |||||||||
Redstone Arsenal | 11 | 236 | — | % | 21.14 | |||||||||
Regional Office | 81 | 2,537 | 0.5 | % | 31.36 | |||||||||
2020 | 1,644 | 56,407 | 11.8 | % | 34.29 | |||||||||
Ft Meade/BW Corridor | 778 | 26,066 | 5.5 | % | 33.50 | |||||||||
NoVA Defense/IT | 148 | 4,096 | 0.9 | % | 27.73 | |||||||||
Navy Support | 183 | 5,518 | 1.2 | % | 30.08 | |||||||||
Redstone Arsenal | 161 | 3,553 | 0.7 | % | 22.06 | |||||||||
Regional Office | 42 | 1,251 | 0.3 | % | 29.50 | |||||||||
2021 | 1,312 | 40,484 | 8.5 | % | 30.84 | |||||||||
Ft Meade/BW Corridor | 541 | 14,810 | 3.1 | % | 27.40 | |||||||||
NoVA Defense/IT | 67 | 2,032 | 0.4 | % | 30.38 | |||||||||
Navy Support | 119 | 2,587 | 0.5 | % | 21.83 | |||||||||
Redstone Arsenal | 2 | 55 | — | % | 29.31 | |||||||||
Regional Office | 489 | 15,387 | 3.2 | % | 31.45 | |||||||||
2022 | 1,218 | 34,871 | 7.3 | % | 28.65 | |||||||||
Thereafter | ||||||||||||||
Consolidated Properties | 6,219 | 186,150 | 39.1 | % | 29.93 | |||||||||
Unconsolidated JV Properties | 962 | 5,333 | 1.1 | % | 11.09 | |||||||||
Core Portfolio | 16,129 | $ | 476,274 | 99.5 | % | $29.86 | ||||||||
Segment of Lease and Year of Expiration (2) | Square Footage of Leases Expiring | Annualized Rental Revenue of Expiring Leases (3) | Percentage of Core/Total Annualized Rental Revenue Expiring (3)(4) | Annualized Rental Revenue of Expiring Leases per Occupied Sq. Foot | ||||||||||
Core Portfolio | 16,129 | $ | 476,274 | 99.5 | % | $29.86 | ||||||||
Other Properties | 98 | 2,558 | 0.5 | % | 26.03 | |||||||||
Total Portfolio | 16,227 | $ | 478,832 | 100.0 | % | $29.84 | ||||||||
Consolidated Portfolio | 15,265 | $ | 473,499 | |||||||||||
Unconsolidated JV Properties | 962 | $ | 5,333 | |||||||||||
Year of Lease Expiration | Critical Load(MW) | Total Annualized Rental Revenue of Expiring Leases (3)(000's) | |||
2018 | 0.11 | $ | 218 | ||
2019 | 2.00 | 4,097 | |||
2020 | 11.55 | 13,722 | |||
2021 | 0.05 | 570 | |||
2022 | 3.00 | 1,842 | |||
Thereafter | 0.15 | 1,931 | |||
16.86 | $ | 22,380 | |||
(1) | This expiration analysis reflects occupied space of our total portfolio (including consolidated and unconsolidated properties) and includes the effect of early renewals completed on existing leases but excludes the effect of new tenant leases on square feet yet to commence as of 12/31/17 of 120,000 for the total portfolio, 92,000 Core Portfolio and 28,000 for Other Properties. With regard to properties owned through unconsolidated real estate joint ventures, the amounts reported above reflect 100% of the properties’ square footage but only reflect the portion of Annualized Rental Revenue that was allocable to COPT’s ownership interest. |
(2) | A number of our leases are subject to certain early termination provisions. The year of lease expiration is based on the non-cancelable term of tenant leases determined in accordance with GAAP. |
(3) | Total Annualized Rental Revenue is the monthly contractual base rent as of 12/31/17 (ignoring free rent then in effect) multiplied by 12 plus the estimated annualized expense reimbursements under existing leases. The amounts reported above for Annualized Rental Revenue include the portion of properties owned through an unconsolidated real estate joint venture that was allocable to COPT’s ownership interest. |
(4) | Amounts reported represent the percentage of our Core Portfolio for components of such portfolio while other amounts represent the percentage of our total portfolio. |
Segment of Lease and Quarter of Expiration (2) | Square Footage of Leases Expiring | Annualized Rental Revenue of Expiring Leases (3) | Percentage of Core Annualized Rental Revenue Expiring (3)(4) | Annualized Rental Revenue of Expiring Leases per Occupied Sq. Foot | ||||||||||
Core Portfolio | ||||||||||||||
Ft Meade/BW Corridor | 636 | $ | 19,138 | 4.0 | % | $30.10 | ||||||||
NoVA Defense/IT | 4 | 118 | — | % | 28.81 | |||||||||
Navy Support | 43 | 573 | 0.1 | % | 13.26 | |||||||||
Regional Office | 75 | 3,319 | 0.7 | % | 44.25 | |||||||||
Q1 2018 | 758 | 23,148 | 4.8 | % | 30.53 | |||||||||
Ft Meade/BW Corridor | 243 | 6,213 | 1.3 | % | 25.59 | |||||||||
Navy Support | 52 | 1,143 | 0.2 | % | 22.02 | |||||||||
Q2 2018 | 295 | 7,356 | 1.5 | % | 24.96 | |||||||||
Ft Meade/BW Corridor | 163 | 5,370 | 1.1 | % | 33.01 | |||||||||
NoVA Defense/IT | 13 | 269 | 0.1 | % | 20.55 | |||||||||
Navy Support | 129 | 3,228 | 0.7 | % | 25.10 | |||||||||
Redstone Arsenal | 2 | 39 | — | % | 23.16 | |||||||||
Regional Office | 3 | 111 | — | % | 33.72 | |||||||||
Q3 2018 | 310 | 9,017 | 1.9 | % | 29.15 | |||||||||
Ft Meade/BW Corridor | 558 | 22,050 | 4.6 | % | 39.51 | |||||||||
NoVA Defense/IT | 15 | 348 | 0.1 | % | 22.64 | |||||||||
Navy Support | 157 | 6,264 | 1.3 | % | 39.84 | |||||||||
Redstone Arsenal | 9 | 196 | — | % | 21.60 | |||||||||
Regional Office | 10 | 329 | 0.1 | % | 31.38 | |||||||||
Q4 2018 | 749 | 29,187 | 6.1 | % | 38.90 | |||||||||
2,113 | $ | 68,706 | 14.4 | % | $32.53 | |||||||||
(1) | This expiration analysis reflects occupied space of our total portfolio and includes the effect of early renewals completed on existing leases but excludes the effect of new tenant leases on square feet yet to commence as of 12/31/17. |
(2) | A number of our leases are subject to certain early termination provisions. The period of lease expiration is based on the non-cancelable term of tenant leases determined in accordance with GAAP. |
(3) | Total Annualized Rental Revenue is the monthly contractual base rent as of 12/31/17 (ignoring free rent then in effect) multiplied by 12 plus the estimated annualized expense reimbursements under existing leases. |
(4) | Amounts reported represent the percentage of our Core Portfolio. |
Tenant | Total Annualized Rental Revenue (2) | Percentage of Total Annualized Rental Revenue (2) | Weighted Average Remaining Lease Term in Office and Data Center Shells (3) | |||||||
United States Government | (4) | $ | 158,774 | 31.7 | % | 5.0 | ||||
Vadata Inc. | 38,007 | 7.6 | % | 8.5 | ||||||
The Boeing Company | 21,080 | 4.2 | % | 2.4 | ||||||
General Dynamics Corporation | 17,593 | 3.5 | % | 3.1 | ||||||
CSRA Inc. | 11,513 | 2.3 | % | 3.3 | ||||||
Northrop Grumman Corporation | 11,140 | 2.2 | % | 2.2 | ||||||
CareFirst, Inc. | 10,492 | 2.1 | % | 5.1 | ||||||
Booz Allen Hamilton, Inc. | 10,219 | 2.0 | % | 3.6 | ||||||
Wells Fargo & Company | 8,494 | 1.7 | % | 8.2 | ||||||
CACI Technologies, Inc. | 7,486 | 1.5 | % | 2.9 | ||||||
AT&T Corporation | 6,229 | 1.2 | % | 1.8 | ||||||
KEYW Corporation | 6,105 | 1.2 | % | 6.0 | ||||||
Miles & Stockbridge, PC | 5,489 | 1.1 | % | 9.7 | ||||||
The Raytheon Company | 5,423 | 1.1 | % | 1.7 | ||||||
University of Maryland | 5,185 | 1.0 | % | 2.8 | ||||||
Kratos Defense and Security Solutions | 4,830 | 1.0 | % | 2.3 | ||||||
Science Applications International Corp. | 4,754 | 0.9 | % | 2.4 | ||||||
The MITRE Corporation | 4,418 | 0.9 | % | 4.5 | ||||||
Transamerica Life Insurance Company | 4,268 | 0.9 | % | 4.0 | ||||||
Accenture Federal Services LLC | 3,754 | 0.7 | % | 1.9 | ||||||
Subtotal Top 20 Tenants | 345,253 | 68.8 | % | 5.1 | ||||||
All remaining tenants | 155,959 | 31.2 | % | 3.9 | ||||||
Total/Weighted Average | $ | 501,212 | 100.0 | % | 4.7 | |||||
(1) | Includes Annualized Rental Revenue (“ARR”) in our portfolio of operating office and data center shells and our wholesale data center. For six properties owned through an unconsolidated JV, includes COPT’s share of those properties’ ARR of $5.3 million (see page 34 for additional information). |
(2) | Total ARR is the monthly contractual base rent as of 12/31/17, multiplied by 12, plus the estimated annualized expense reimbursements under existing leases. With regard to properties owned through unconsolidated real estate joint ventures, the amounts reported above reflect 100% of the properties’ square footage but only reflect the portion of ARR that was allocable to COPT’s ownership interest. |
(3) | Weighted average remaining lease term is based on the non-cancelable term of tenant leases determined in accordance with GAAP for our office and data center shell properties (i.e., excluding the effect of our wholesale data center leases). The weighting of the lease term was computed based on occupied square feet. |
(4) | Substantially all of our government leases are subject to early termination provisions which are customary in government leases. As of 12/31/17, $2.2 million in ARR (or 1.4% of our ARR from the United States Government and 0.5% of our total ARR) was through the General Services Administration (GSA). |
Property Segment/Subsegment | Business Park/Submarket | Number of Buildings | Square Feet | Transaction Date | Occupancy on Transaction Date | Transaction Price | |||||||||||||
Quarter Ended 3/31/17 | |||||||||||||||||||
Herndon, Virginia Land | N/A | N/A | N/A | N/A | 1/12/2017 | N/A | $ | 14,325 | |||||||||||
3120 Fairview Park Drive | NoVA Defense/IT | Merrifield | 1 | 190 | 2/15/2017 | 87.2% | 39,000 | ||||||||||||
Subtotal - Quarter Ended 3/31/17 | 1 | 190 | 53,325 | ||||||||||||||||
Quarter Ended 6/30/17 | |||||||||||||||||||
1334 Ashton Road | Fort Meade/BW Corridor | BWI South | 1 | 37 | 6/9/2017 | 40.7% | 2,300 | ||||||||||||
Quarter Ended 9/30/17 | |||||||||||||||||||
Remaining White Marsh properties and land | Regional Office and Other | White Marsh | 8 | 412 | 7/28/2017 | 94.8% | 47,500 | ||||||||||||
Quarter Ended 12/31/17 | |||||||||||||||||||
201 Technology Drive | Data Center Shells | Southwest Virginia | 1 | 103 | 10/27/2017 | 100.0% | 29,500 | ||||||||||||
11751 Meadowville Lane | Data Center Shells | Richmond Southwest | 1 | 193 | 10/27/2017 | 100.0% | 44,000 | (1) | |||||||||||
7320 Parkway Drive | Fort Meade/BW Corridor | BWI South | 1 | 57 | 12/15/2017 | 77.1% | 7,529 | ||||||||||||
Subtotal - Quarter Ended 12/31/17 | 3 | 353 | 81,029 | ||||||||||||||||
Total 2017 Dispositions | 13 | 992 | $ | 184,154 | |||||||||||||||
Property Segment | Total Rentable Square Feet | Percentage Leased as of 12/31/17 | as of 12/31/2017 (2) | Actual or Anticipated Shell Completion Date | Anticipated Operational Date (3) | ||||||||||||
Anticipated Total Cost | Cost to Date | Cost to Date Placed in Service | |||||||||||||||
Property and Location | |||||||||||||||||
Under Construction | |||||||||||||||||
540 National Business Parkway (4) Annapolis Junction, Maryland | Ft Meade/BW Corridor | 145 | 49% | $ | 43,712 | $ | 32,630 | $ | 19,023 | 1Q 17 | 1Q 18 | ||||||
DC 23 Northern Virginia | Data Center Shells | 149 | 100% | 21,347 | 498 | — | 3Q 18 | 3Q 18 | |||||||||
BLC 1 Northern Virginia | Data Center Shells | 149 | 100% | 33,000 | 12,277 | — | 3Q 18 | 3Q 18 | |||||||||
BLC 2 Northern Virginia | Data Center Shells | 149 | 100% | 33,110 | 12,201 | — | 4Q 18 | 4Q 18 | |||||||||
5801 University Research Court College Park, Maryland | Ft Meade/BW Corridor | 71 | 0% | 18,544 | 9,938 | — | 1Q 18 | 1Q 19 | |||||||||
4100 Market Street Huntsville, Alabama | Redstone Arsenal | 36 | 59% | 7,466 | 1,014 | — | 2Q 18 | 2Q 19 | |||||||||
4000 Market Street Huntsville, Alabama | Redstone Arsenal | 43 | 0% | 8,115 | 466 | — | 3Q 18 | 3Q 19 | |||||||||
Total Under Construction | 742 | 73% | 165,294 | 69,024 | 19,023 | ||||||||||||
Held for Lease to Government (1) | |||||||||||||||||
310 Sentinel Way Annapolis Junction, Maryland | Ft Meade/BW Corridor | 191 | 12% | 54,352 | 41,237 | 41,237 | (1) | (1) | |||||||||
NoVA Office B Northern Virginia | NoVA Defense/IT | 161 | 0% | 41,500 | 31,187 | 31,187 | (1) | (1) | |||||||||
Total Held for Lease to Government | 352 | 6% | 95,852 | 72,424 | 72,424 | ||||||||||||
Total Construction Projects | 1,094 | 51% | $ | 261,146 | $ | 141,448 | $ | 91,447 | |||||||||
(1) | Includes properties under, or contractually committed for, construction as of 12/31/17 and 310 Sentinel Way and NOVA Office B, two properties that were complete but reported as construction projects since they were held for future lease to the United States Government. 310 Sentinel Way had 22,000 square feet occupied as of 12/31/17; as a result, this building and its occupied square footage were included in our 12/31/17 operating property statistics. Effective in 2018, both properties will be fully included in our operating property statistics and Same Properties pool. |
(2) | Cost includes land, construction, leasing costs and allocated portion of structured parking and other shared infrastructure, if applicable. |
(3) | Anticipated operational date is the earlier of the estimated date when leases have commenced on 100% of a property’s space or one year from the cessation of major construction activities. |
(4) | Although classified as under construction, 71,000 square feet were operational as of 12/31/17. |
Property Segment | Total Rentable Square Feet | Percentage Leased as of 1/3/2018 | as of 12/31/17 (1) | Actual or Anticipated Completion Date | Anticipated Operational Date (2) | |||||||||||||||||
Historical Basis, Net | Incremental Redevelopment Cost | Anticipated Total Cost | Cost to Date | Cost to Date Placed in Service | ||||||||||||||||||
Property and Location | ||||||||||||||||||||||
7142 Columbia Gateway (3) Columbia, Maryland | Ft Meade/BW Corridor | 22 | 73% | $ | 622 | $ | 3,296 | $ | 3,918 | $ | 1,387 | $ | 622 | 1Q 18 | 1Q 19 | |||||||
Property Segment | Total Rentable Square Feet | Percentage Leased as of 12/31/17 | as of 12/31/17 (1) | Anticipated Construction Start Date | Anticipated Shell Completion Date | Anticipated Operational Date (2) | |||||||||
Anticipated Total Cost | Cost to Date | ||||||||||||||
Property and Location | |||||||||||||||
2100 L Street Washington, DC | Regional Office | 190 | 43% | $ | 170,000 | $ | 71,509 | 2Q 18 | 3Q 20 | 3Q 21 | |||||
(1) | Cost includes land, construction, leasing costs and allocated portion of shared infrastructure. |
(2) | Anticipated operational date is the earlier of the estimated date when leases have commenced on 100% of a property’s space or one year from the cessation of major construction activities. |
(3) | A portion of this property is undergoing redevelopment (22,000 of the 47,000 square feet). |
(4) | The costs associated with the project on this summary are reported on our consolidated balance sheet in the line entitled “land held.” |
Total Property | Square Feet Placed in Service in 2017 | Space Placed in Service % Leased as of 12/31/17 | |||||||||||||||
Property Segment | % Leased as of 12/31/17 | ||||||||||||||||
Property and Location | Rentable Square Feet | Prior Year | 1st Quarter | 2nd Quarter | 3rd Quarter | 4th Quarter | Total 2017 | ||||||||||
7134 Columbia Gateway Drive Columbia, Maryland | Ft Meade/BW Corridor | 100% | 22 | 8 | 14 | — | — | — | 14 | 100% | |||||||
1201 Winterson Road Linthicum, Maryland | Ft Meade/BW Corridor | 72% | 68 | — | 68 | — | — | — | 68 | 72% | |||||||
Airport Landing Retail Buildings Linthicum, Maryland | Ft Meade/BW Corridor | 100% | 14 | 2 | 4 | 2 | — | 6 | 12 | 100% | |||||||
Bethlehem Technology Park - DC 20 Manassas, Virginia | Data Center Shells | 100% | 216 | — | — | 216 | — | — | 216 | 100% | |||||||
540 National Business Parkway Annapolis Junction, Maryland | Ft Meade/BW Corridor | 49% | 145 | — | — | 71 | — | — | 71 | 100% | |||||||
2100 Rideout Road Huntsville, Alabama | Redstone Arsenal | 66% | 19 | 11 | — | 8 | — | — | 8 | 66% | |||||||
Bethlehem Technology Park - DC 18 Manassas, Virginia | Data Center Shells | 100% | 216 | — | — | — | 216 | — | 216 | 100% | |||||||
NoVA Office D Northern Virginia | NoVA Defense/IT | 100% | 240 | — | — | — | 240 | — | 240 | 100% | |||||||
Paragon Park - DC 21 Sterling, Virginia | Data Center Shells | 100% | 149 | — | — | — | — | 149 | 149 | 100% | |||||||
Paragon Park - DC 22 Sterling, Virginia | Data Center Shells | 100% | 149 | — | — | — | — | 149 | 149 | 100% | |||||||
310 Sentinel Way (1) Annapolis Junction, Maryland | Ft Meade/BW Corridor | 12% | 191 | — | — | — | — | 22 | 22 | 100% | |||||||
Total Construction/Redevelopment Placed Into Service | 81% | 1,429 | 21 | 86 | 297 | 456 | 326 | 1,165 | 98% | ||||||||
Location | Acres | Estimated Developable Square Feet (in thousands) | Carrying Amount | ||||||
Land Owned/Controlled for Future Development | |||||||||
Defense/IT Locations: | |||||||||
Fort Meade/BW Corridor: | |||||||||
National Business Park | 196 | 2,106 | |||||||
Howard County | 27 | 590 | |||||||
Other | 133 | 1,494 | |||||||
Total Fort Meade/BW Corridor | 356 | 4,190 | |||||||
NoVA Defense/IT | 59 | 1,965 | |||||||
Lackland AFB | 68 | 1,033 | |||||||
Navy Support | 44 | 109 | |||||||
Redstone Arsenal (2) | 422 | 4,005 | |||||||
Data Center Shells | 41 | 636 | |||||||
Total Defense/IT Locations | 990 | 11,938 | |||||||
Regional Office | 10 | 900 | |||||||
Total land owned/controlled for future development | 1,000 | 12,838 | $ | 284,272 | |||||
Other land owned/controlled | 150 | 1,638 | 4,495 | ||||||
Land held, net | 1,150 | 14,476 | $ | 288,767 | |||||
(1) | This land inventory schedule includes properties under ground lease to us and excludes all properties listed as construction, redevelopment or pre-leased pre-construction as detailed on pages 25 and 26. The costs associated with the land included on this summary and our pre-leased pre-construction project included on page 26 are reported on our consolidated balance sheet in the line entitled “land held.” |
(2) | This land is controlled under a long-term master lease agreement to LW Redstone Company, a consolidated joint venture (see page 33). As this land is developed in the future, the joint venture will execute site-specific leases under the master lease agreement. Rental payments will commence under the site-specific leases as cash rents under tenant leases commence at the respective properties. |
Wtd. Avg. | Effective | Gross Debt | |||||||||||
Maturity | Stated | Rate | Balance at | ||||||||||
(Years) | Rate | (1)(2) | 12/31/2017 | ||||||||||
Debt | |||||||||||||
Secured debt | 6.2 | 4.11 | % | 4.06 | % | $ | 164,506 | ||||||
Unsecured debt | 5.0 | 3.86 | % | 4.08 | % | 1,677,661 | |||||||
Total Consolidated Debt | 5.1 | 3.88 | % | 4.08 | % | $ | 1,842,167 | ||||||
Fixed rate debt (2) | 5.7 | 4.30 | % | 4.18 | % | $ | 1,716,167 | ||||||
Variable rate debt | 3.4 | 2.74 | % | 2.69 | % | 126,000 | |||||||
Total Consolidated Debt | $ | 1,842,167 | |||||||||||
Preferred Equity | Redeemable | ||||||||||||
7.5% Series I Convertible Preferred Units (3) | Sep-19 | $ | 8,800 | ||||||||||
Common Equity | |||||||||||||
Common Shares | 101,292 | ||||||||||||
Common Units | 3,251 | ||||||||||||
Total Common Shares and Units | 104,543 | ||||||||||||
Closing Common Share Price on 12/29/17 | $ | 29.20 | |||||||||||
Common Equity Market Capitalization | $ | 3,052,656 | |||||||||||
Total Equity Market Capitalization | $ | 3,061,456 | |||||||||||
Total Market Capitalization | $ | 4,903,623 | |||||||||||
Forward Equity Sale Agreements Capacity (4) | $ | 221,934 | |||||||||||
(1) Excludes the effect of deferred financing cost amortization. | |||||||||||||
(2) Includes the effect of interest rate swaps with notional amounts of $463.2 million that hedge the risk of changes in interest rates on variable rate debt. | |||||||||||||
(3) 352,000 units outstanding with a liquidation preference of $25 per unit, and convertible into 176,000 common units. | |||||||||||||
(4) Based on settlement value on remaining capacity as of 12/31/17. | |||||||||||||
Investment Grade Ratings & Outlook: | Latest Affirmation | ||||
Fitch | BBB- | Stable | 7/19/17 | ||
Moody’s | Baa3 | Positive | 8/9/17 | ||
Standard & Poor’s | BBB- | Stable | 5/26/17 | ||
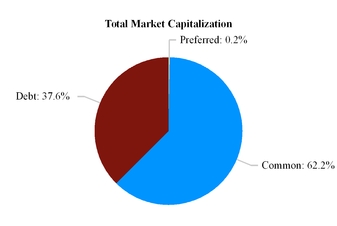
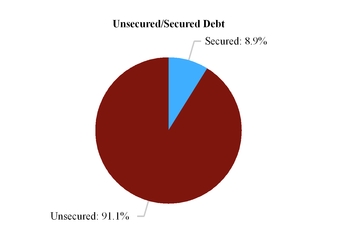
Balloon | ||||||||||||||||||||
Payment | ||||||||||||||||||||
Stated | Amount | Maturity | Stated | Amount | Due Upon | Maturity | ||||||||||||||
Unsecured Debt | Rate | Outstanding | Date | Secured Debt | Rate | Outstanding | Maturity | Date | ||||||||||||
Revolving Credit Facility | L + 1.20% | $ | 126,000 | May-19 | (1)(2) | 7015 Albert Einstein Drive | 7.87 | % | $ | 829 | $ | — | Nov-19 | |||||||
Senior Unsecured Notes | 7200 Redstone Gateway (3) | L + 1.85% | 13,217 | 12,132 | Oct-20 | |||||||||||||||
3.70% due 2021 | 3.70 | % | $ | 300,000 | Jun-21 | 7740 Milestone Parkway | 3.96 | % | 18,203 | 15,902 | Feb-23 | |||||||||
3.60% due 2023 | 3.60 | % | 350,000 | May-23 | 100 & 30 Light Street | 4.32 | % | 53,531 | 47,676 | Jun-23 | ||||||||||
5.25% due 2024 | 5.25 | % | 250,000 | Feb-24 | 1000, 1200 and 1100 Redstone | |||||||||||||||
5.00% due 2025 | 5.00 | % | 300,000 | Jul-25 | Gateway (3) | 4.47 | % | (4) | 34,925 | 27,649 | Jun-24 | |||||||||
Subtotal - Senior Unsecured Notes | 4.32 | % | $ | 1,200,000 | M Square (5825 & 5850 | |||||||||||||||
University Research Court) (3) | 3.82 | % | 43,801 | 35,603 | Jun-26 | |||||||||||||||
Unsecured Bank Term Loans | Total Secured Debt | 4.11 | % | $ | 164,506 | |||||||||||||||
2020 Maturity | L + 1.40% | 100,000 | May-20 | (2) | ||||||||||||||||
2022 Maturity | L + 1.35% | 250,000 | Dec-22 | (2) | ||||||||||||||||
Subtotal - Term Loans | 2.73 | % | 350,000 | |||||||||||||||||
Other Unsecured Debt | — | % | 1,661 | May-26 | ||||||||||||||||
Total Unsecured Debt | 3.86 | % | $ | 1,677,661 | ||||||||||||||||
Debt Summary | ||||||||||||||||||||
Total Unsecured Debt | 3.86 | % | $ | 1,677,661 | ||||||||||||||||
Total Secured Debt | 4.11 | % | 164,506 | |||||||||||||||||
Consolidated Debt | 3.88 | % | $ | 1,842,167 | ||||||||||||||||
Net discounts and deferred | ||||||||||||||||||||
financing costs | (13,834 | ) | ||||||||||||||||||
Debt, per balance sheet | $ | 1,828,333 | ||||||||||||||||||
Consolidated Debt | $ | 1,842,167 | ||||||||||||||||||
COPT’s share of unconsolid. JV gross debt (5) | 30,000 | |||||||||||||||||||
Gross debt | $ | 1,872,167 | ||||||||||||||||||
(1) | The Company’s $800 million line of credit matures in May 2019 and may be extended for two six-month periods, at our option. |
(2) | Pre-payable anytime without penalty. |
(3) | These properties are owned through consolidated joint ventures. |
(4) | Represents the weighted average rate of three loans on the properties. |
(5) | See page 34 for additional disclosure regarding an unconsolidated real estate joint venture. |
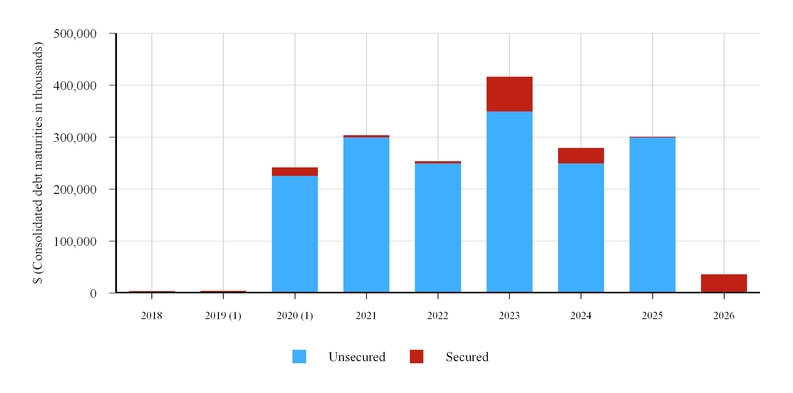
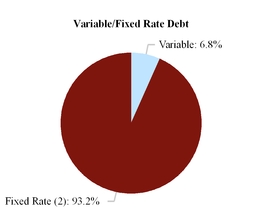
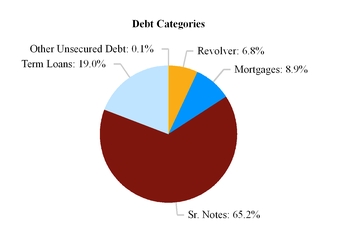
As of and for Three | As of and for Three | ||||||||||||||
Months Ended | Line of Credit & | Months Ended | |||||||||||||
Senior Note Covenants (1) | Required | 12/31/2017 | Term Loan Covenants (1) | Required | 12/31/2017 | ||||||||||
Total Debt / Total Assets | < 60% | 41.5% | Total Debt / Total Assets | < 60% | 36.2% | ||||||||||
Secured Debt / Total Assets | < 40% | 3.7% | Secured Debt / Total Assets | < 40% | 3.4% | ||||||||||
Debt Service Coverage | > 1.5x | 3.8x | Adjusted EBITDA / Fixed Charges | > 1.5x | 3.6x | ||||||||||
Unencumbered Assets / Unsecured Debt | > 150% | 243.0% | Unsecured Debt / Unencumbered Assets | < 60% | 36.4% | ||||||||||
Unencumbered Adjusted NOI / Unsecured Interest Expense | > 1.75x | 3.9x | |||||||||||||
Debt Ratios | Source | Unencumbered Portfolio Analysis | |||||||||||||
Gross debt | p. 30 | $ | 1,872,167 | # of unencumbered properties | 143 | ||||||||||
Adjusted book | p. 37 | $ | 4,536,067 | % of total portfolio | 90 | % | |||||||||
Net debt / adjusted book ratio | 41.0 | % | Unencumbered square feet in-service | 14,866 | |||||||||||
Net debt plus pref. equity / adj. book ratio | 41.2 | % | % of total portfolio | 86 | % | ||||||||||
Net debt | p. 37 | $ | 1,859,535 | NOI from unencumbered real estate operations | $ | 74,056 | |||||||||
Net debt plus preferred equity | p. 37 | $ | 1,868,335 | % of total NOI from real estate operations | 91 | % | |||||||||
In-place adjusted EBITDA | p. 10 | $ | 76,380 | Adjusted EBITDA from unencumbered real estate operations | $ | 69,479 | |||||||||
Net debt / in-place adjusted EBITDA ratio | 6.1 | x | % of total adjusted EBITDA from real estate operations | 90 | % | ||||||||||
Net debt plus pref. equity / in-place adj. EBITDA ratio | 6.1 | x | Unencumbered adjusted book | $ | 4,127,533 | ||||||||||
Denominator for debt service coverage | p. 36 | $ | 19,799 | % of total adjusted book | 91 | % | |||||||||
Denominator for fixed charge coverage | p. 36 | $ | 20,996 | ||||||||||||
Adjusted EBITDA | p. 10 | $ | 76,958 | ||||||||||||
Adjusted EBITDA debt service coverage ratio | 3.9 | x | |||||||||||||
Adjusted EBITDA fixed charge coverage ratio | 3.7 | x | |||||||||||||
Operating Properties | Operational Square Feet | Occupancy % | Leased % | NOI for the Three Months Ended 12/31/17 (2) | NOI for the Year Ended 12/31/17 (2) | Total Assets (1) | Venture Level Debt | % COPT Owned | |||||||||
Suburban Maryland: | |||||||||||||||||
M Square Associates, LLC (2 properties) | 242 | 100.0% | 100.0% | $ | 1,390 | $ | 5,576 | $ | 55,769 | $ | 43,801 | 50% | |||||
Huntsville, AL: | |||||||||||||||||
LW Redstone Company, LLC (6 properties) | 514 | 98.7% | 98.7% | 1,926 | 7,295 | 83,444 | 48,142 | 85% | |||||||||
Total/Average | 756 | 99.1% | 99.1% | $ | 3,316 | $ | 12,871 | $ | 139,213 | $ | 91,943 | ||||||
Non-operational Properties | Estimated Developable Square Feet | Total Assets (1) | Venture Level Debt | % COPT Owned | |||||||
Suburban Maryland: | |||||||||||
M Square Research Park | 521 | $ | 17,347 | $ | — | 50% | |||||
Huntsville, Alabama: | |||||||||||
Redstone Gateway (3) | 4,084 | 75,447 | — | 85% | |||||||
Washington, DC: | |||||||||||
Stevens Place | 190 | 71,976 | — | 95% | |||||||
Total | 4,795 | $ | 164,770 | $ | — | ||||||
(2) | Represents gross NOI of the joint venture operating properties before allocation to joint venture partners. |
(3) | Total assets include $54.5 million due from the City of Huntsville (including accrued interest) in connection with infrastructure costs funded by the joint venture. |
Joint venture information | |||||||||||||||
COPT ownership % | 50 | % | |||||||||||||
Investment in unconsolidated real estate joint venture | $ | 25,066 | |||||||||||||
Number of properties | 6 | ||||||||||||||
Square feet | 962 | ||||||||||||||
Percentage occupied | 100 | % | |||||||||||||
Balance sheet information | Venture | COPT’s Share (1) | |||||||||||||
Operating properties, net | $ | 125,853 | $ | 62,927 | |||||||||||
Total Assets | $ | 143,386 | $ | 71,693 | |||||||||||
Debt | $ | 59,600 | $ | 29,800 | |||||||||||
Three Months Ended 12/31/17 | Year Ended 12/31/17 | ||||||||||||||
Operating information | Venture | COPT’s Share (1) | Venture | COPT’s Share (1) | |||||||||||
Revenue | $ | 2,965 | $ | 1,531 | $ | 11,794 | $ | 6,089 | |||||||
Operating expenses | (463 | ) | (232 | ) | (1,801 | ) | (901 | ) | |||||||
NOI and EBITDA | 2,502 | 1,299 | 9,993 | 5,188 | |||||||||||
Interest expense | (533 | ) | (266 | ) | (2,115 | ) | (1,058 | ) | |||||||
Depreciation and amortization | (874 | ) | (311 | ) | (3,494 | ) | (1,243 | ) | |||||||
Net income | $ | 1,095 | $ | 722 | $ | 4,384 | $ | 2,887 | |||||||
NOI (per above) | $ | 2,502 | $ | 1,299 | $ | 9,993 | $ | 5,188 | |||||||
Straight line rent adjustments | (243 | ) | (169 | ) | (1,055 | ) | (719 | ) | |||||||
Cash NOI | $ | 2,259 | $ | 1,130 | $ | 8,938 | $ | 4,469 | |||||||
Corporate Office Properties Trust Supplementary Reconciliations of Non-GAAP Measures (dollars in thousands) | |||||||||||||||||||||||||||
Three Months Ended | Year Ended | ||||||||||||||||||||||||||
12/31/17 | 9/30/17 | 6/30/17 | 3/31/17 | 12/31/16 | 12/31/17 | 12/31/16 | |||||||||||||||||||||
Gain on sales of real estate, net, per statements of operations | $ | 4,452 | $ | 1,188 | $ | 12 | $ | 4,238 | $ | 6,885 | $ | 9,890 | $ | 40,986 | |||||||||||||
Gain on sales of non-operating properties | — | (1,180 | ) | — | (4,219 | ) | (7,197 | ) | (5,399 | ) | (7,197 | ) | |||||||||||||||
Gain on sales of previously depreciated operating properties | $ | 4,452 | $ | 8 | $ | 12 | $ | 19 | $ | (312 | ) | $ | 4,491 | $ | 33,789 | ||||||||||||
Impairment losses (recoveries), per statements of operations | $ | 13,659 | $ | (161 | ) | $ | 1,625 | $ | — | $ | 1,554 | $ | 15,123 | $ | 101,391 | ||||||||||||
Impairment (losses) recoveries on previously depreciated operating properties | (9,004 | ) | 159 | (1,610 | ) | — | (1,518 | ) | (10,455 | ) | (83,346 | ) | |||||||||||||||
Impairment losses (recoveries) on non-operating properties | $ | 4,655 | $ | (2 | ) | $ | 15 | $ | — | $ | 36 | $ | 4,668 | $ | 18,045 | ||||||||||||
NOI from real estate operations (1) | |||||||||||||||||||||||||||
Real estate revenues | $ | 127,685 | $ | 127,231 | $ | 128,297 | $ | 126,767 | $ | 127,999 | $ | 509,980 | $ | 525,964 | |||||||||||||
Real estate property operating expenses | (47,449 | ) | (46,368 | ) | (48,628 | ) | (48,519 | ) | (47,562 | ) | (190,964 | ) | (197,530 | ) | |||||||||||||
COPT’s share of NOI in unconsolidated real estate JV (2) | 1,299 | 1,297 | 1,294 | 1,298 | 1,297 | 5,188 | 2,305 | ||||||||||||||||||||
NOI from real estate operations | 81,535 | 82,160 | 80,963 | 79,546 | 81,734 | 324,204 | 330,739 | ||||||||||||||||||||
General and administrative expenses | (5,552 | ) | (5,692 | ) | (6,017 | ) | (6,747 | ) | (6,211 | ) | (24,008 | ) | (30,095 | ) | |||||||||||||
Leasing expenses | (1,447 | ) | (1,676 | ) | (1,842 | ) | (1,864 | ) | (1,578 | ) | (6,829 | ) | (6,458 | ) | |||||||||||||
Business development expenses and land carry costs | (1,646 | ) | (1,277 | ) | (1,597 | ) | (1,693 | ) | (1,747 | ) | (6,213 | ) | (8,244 | ) | |||||||||||||
NOI from construction contracts and other service operations | 853 | 998 | 823 | 548 | 1,024 | 3,222 | 2,883 | ||||||||||||||||||||
Impairment (losses) recoveries on non-operating properties | (4,655 | ) | 2 | (15 | ) | — | (36 | ) | (4,668 | ) | (18,045 | ) | |||||||||||||||
Equity in (loss) income of unconsolidated non-real estate entities | (2 | ) | (1 | ) | (1 | ) | (1 | ) | (1 | ) | (5 | ) | 20 | ||||||||||||||
Interest and other income | 1,501 | 1,508 | 1,583 | 1,726 | 1,567 | 6,318 | 5,444 | ||||||||||||||||||||
Loss on early extinguishment of debt | — | — | (513 | ) | — | (1,073 | ) | (513 | ) | (1,110 | ) | ||||||||||||||||
Gain on sales of non-operating properties | — | 1,180 | — | 4,219 | 7,197 | 5,399 | 7,197 | ||||||||||||||||||||
Interest expense | (19,211 | ) | (19,615 | ) | (19,163 | ) | (18,994 | ) | (18,664 | ) | (76,983 | ) | (83,163 | ) | |||||||||||||
COPT’s share of interest expense of unconsolidated real estate JV | (266 | ) | (267 | ) | (264 | ) | (261 | ) | (267 | ) | (1,058 | ) | (475 | ) | |||||||||||||
Income tax expense | (953 | ) | (57 | ) | (48 | ) | (40 | ) | (272 | ) | (1,098 | ) | (244 | ) | |||||||||||||
FFO - per NAREIT (1) | $ | 50,157 | $ | 57,263 | $ | 53,909 | $ | 56,439 | $ | 61,673 | $ | 217,768 | $ | 198,449 | |||||||||||||
(1) Please refer to the section entitled “Definitions” for a definition of this measure. | |||||||||||||||||||||||||||
(2) See page 34 for a schedule of the related components. | |||||||||||||||||||||||||||
Corporate Office Properties Trust Supplementary Reconciliations of Non-GAAP Measures (continued) (dollars in thousands) | |||||||||||||||||||||||||||
Three Months Ended | Year Ended | ||||||||||||||||||||||||||
12/31/17 | 9/30/17 | 6/30/17 | 3/31/17 | 12/31/16 | 12/31/17 | 12/31/16 | |||||||||||||||||||||
Total interest expense | $ | 19,211 | $ | 19,615 | $ | 19,163 | $ | 18,994 | $ | 18,664 | $ | 76,983 | $ | 83,163 | |||||||||||||
Less: Amortization of deferred financing costs | (443 | ) | (554 | ) | (922 | ) | (1,009 | ) | (1,093 | ) | (2,928 | ) | (4,573 | ) | |||||||||||||
Less: Amortization of net debt discounts and prem., net of amounts capitalized | (350 | ) | (347 | ) | (343 | ) | (339 | ) | (336 | ) | (1,379 | ) | (1,312 | ) | |||||||||||||
Less: Accum. other comprehensive loss on derivatives amortized to expense | (54 | ) | (53 | ) | (36 | ) | — | — | (143 | ) | — | ||||||||||||||||
Gain (loss) on interest rate derivatives | 191 | 34 | (444 | ) | 453 | 725 | 234 | 378 | |||||||||||||||||||
COPT’s share of interest expense of unconsolidated real estate JV, excluding deferred financing costs | 260 | 261 | 258 | 255 | 261 | 1,034 | 465 | ||||||||||||||||||||
Denominator for interest coverage | 18,815 | 18,956 | 17,676 | 18,354 | 18,221 | 73,801 | 78,121 | ||||||||||||||||||||
Scheduled principal amortization | 984 | 965 | 955 | 958 | 941 | 3,862 | 5,395 | ||||||||||||||||||||
Denominator for debt service coverage | 19,799 | 19,921 | 18,631 | 19,312 | 19,162 | 77,663 | 83,516 | ||||||||||||||||||||
Capitalized interest | 1,032 | 1,055 | 1,611 | 1,531 | 1,419 | 5,229 | 5,723 | ||||||||||||||||||||
Preferred share dividends - redeemable non-convertible | — | — | 3,039 | 3,180 | 3,640 | 6,219 | 14,297 | ||||||||||||||||||||
Preferred unit distributions | 165 | 165 | 165 | 165 | 165 | 660 | 660 | ||||||||||||||||||||
Denominator for fixed charge coverage | $ | 20,996 | $ | 21,141 | $ | 23,446 | $ | 24,188 | $ | 24,386 | $ | 89,771 | $ | 104,196 | |||||||||||||
Preferred share dividends | $ | — | $ | — | $ | 3,039 | $ | 3,180 | $ | 3,640 | $ | 6,219 | $ | 14,297 | |||||||||||||
Preferred unit distributions | 165 | 165 | 165 | 165 | 165 | 660 | 660 | ||||||||||||||||||||
Common share dividends - unrestricted shares | 27,747 | 27,282 | 27,241 | 27,219 | 26,991 | 109,489 | 104,811 | ||||||||||||||||||||
Common share dividends - restricted shares | 112 | 95 | 117 | 125 | 100 | 449 | 419 | ||||||||||||||||||||
Common unit distributions | 894 | 895 | 936 | 936 | 987 | 3,661 | 3,990 | ||||||||||||||||||||
Total dividends/distributions | $ | 28,918 | $ | 28,437 | $ | 31,498 | $ | 31,625 | $ | 31,883 | $ | 120,478 | $ | 124,177 | |||||||||||||
Common share dividends - unrestricted shares | $ | 27,747 | $ | 27,282 | $ | 27,241 | $ | 27,219 | $ | 26,991 | $ | 109,489 | $ | 104,811 | |||||||||||||
Common unit distributions | 894 | 895 | 936 | 936 | 987 | 3,661 | 3,990 | ||||||||||||||||||||
Dividends and distributions for payout ratios | $ | 28,641 | $ | 28,177 | $ | 28,177 | $ | 28,155 | $ | 27,978 | $ | 113,150 | $ | 108,801 | |||||||||||||
Corporate Office Properties Trust Supplementary Reconciliations of Non-GAAP Measures (continued) (dollars in thousands) | |||||||||||||||||||||||||||
Three Months Ended | |||||||||||||||||||||||||||
12/31/17 | 9/30/17 | 6/30/17 | 3/31/17 | 12/31/16 | |||||||||||||||||||||||
Total Assets | $ | 3,578,484 | $ | 3,559,772 | $ | 3,574,887 | $ | 3,739,366 | $ | 3,780,885 | |||||||||||||||||
Accumulated depreciation | 786,193 | 759,262 | 755,208 | 732,371 | 706,385 | ||||||||||||||||||||||
Accumulated depreciation included in assets held for sale | — | 24,903 | 8,148 | 7,104 | 9,566 | ||||||||||||||||||||||
Accumulated amort. of real estate intangibles and deferred leasing costs | 193,151 | 187,219 | 183,199 | 218,336 | 210,692 | ||||||||||||||||||||||
Accumulated amortization of real estate intangibles and deferred leasing costs included in assets held for sale | — | 1,874 | 9,951 | 9,259 | 11,575 | ||||||||||||||||||||||
COPT’s share of liabilities of unconsolidated real estate JV | 29,908 | 30,028 | 29,888 | 30,037 | 29,873 | ||||||||||||||||||||||
COPT’s share of accumulated depreciation and amortization of unconsolidated real estate JV | 3,189 | 2,627 | 2,064 | 1,501 | 938 | ||||||||||||||||||||||
Less: Disposed property included in assets held for sale (1) | (42,226 | ) | — | — | — | — | |||||||||||||||||||||
Less: Cash and cash equivalents | (12,261 | ) | (10,858 | ) | (10,606 | ) | (226,470 | ) | (209,863 | ) | |||||||||||||||||
Less: COPT’s share of cash of unconsolidated real estate JV | (371 | ) | (376 | ) | (377 | ) | (370 | ) | (283 | ) | |||||||||||||||||
Adjusted book | $ | 4,536,067 | $ | 4,554,451 | $ | 4,552,362 | $ | 4,511,134 | $ | 4,539,768 | |||||||||||||||||
Gross debt (page 30) | $ | 1,872,167 | $ | 1,917,201 | $ | 1,942,216 | $ | 1,949,221 | $ | 1,950,229 | |||||||||||||||||
Less: Cash and cash equivalents | (12,261 | ) | (10,858 | ) | (10,606 | ) | (226,470 | ) | (209,863 | ) | |||||||||||||||||
COPT’s share of cash of unconsolidated real estate JV | (371 | ) | (376 | ) | (377 | ) | (370 | ) | (283 | ) | |||||||||||||||||
Net debt | $ | 1,859,535 | $ | 1,905,967 | $ | 1,931,233 | $ | 1,722,381 | $ | 1,740,083 | |||||||||||||||||
Preferred equity | 8,800 | 8,800 | 8,800 | 181,300 | 207,883 | ||||||||||||||||||||||
Net debt plus preferred equity | $ | 1,868,335 | $ | 1,914,767 | $ | 1,940,033 | $ | 1,903,681 | $ | 1,947,966 | |||||||||||||||||
(1) | We provided a financial guaranty to the buyer of this property under which we provided a limited indemnification for losses it could incur related to a potential defined capital event occurring on the property by 6/30/19. Accordingly, we did not recognize the sale of the property for accounting purposes (and will not until the guaranty expires) and we reported the sale price of the property, less sale costs, as a liability on our consolidated balance sheet as of 12/31/17. We do not expect to incur any losses under this financial guaranty. |
 | 6711 Columbia Gateway Drive, Suite 300 | |
Columbia, Maryland 21046 | ||
Telephone 443-285-5400 | ||
Facsimile 443-285-7650 | ||
www.copt.com | ||
NYSE: OFC | ||
NEWS RELEASE | ||
FOR IMMEDIATE RELEASE | IR Contacts: | |
Stephanie Krewson-Kelly | Michelle Layne | |
443-285-5453 | 443-285-5452 | |
stephanie.kelly@copt.com | michelle.layne@copt.com | |
• | Diluted earnings per share (“EPS”) was $0.10 for the quarter ended December 31, 2017 as compared to $0.22 for the fourth quarter of 2016. |
• | Diluted funds from operations per share (“FFOPS”), as calculated in accordance with NAREIT’s definition, was $0.48 for the fourth quarter of 2017 as compared to $0.57 for the fourth quarter of 2016. |
• | FFOPS, as adjusted for comparability, was $0.53 for the quarter ended December 31, 2017 and $0.51 for the fourth quarter of 2016. |
• | EPS for the year ended December 31, 2017 was $0.57 as compared to a diluted loss per share of $(0.03) for 2016. |
• | Per NAREIT’s definition, FFOPS for 2017 was $1.95 as compared to $1.82 for 2016. |
• | FFOPS, as adjusted for comparability, for 2017 was $2.03 as compared to $2.01 for 2016. |
• | At December 31, 2017, the Company’s core portfolio of 156 operating office and data center shell properties was 94.5% occupied and 95.1% leased. |
• | During the quarter, the Company placed 326,000 square feet of development into service that, at December 31, 2017, were 100% leased. During the year, the Company placed 1.2 million square feet into service that were 98% leased at year-end. |
• | At December 31, 2017, COPT’s same-property portfolio of 135 buildings was 92.8% occupied and 93.4% leased. |
• | For the quarter ended December 31, 2017, the Company’s same-property cash NOI increased 0.9% as compared to the quarter ended December 31, 2016. For the full year, same-property cash NOI grew 3.4% versus 2016. |
• | Square Feet Leased-For the quarter ended December 31, 2017, the Company leased 1.1 million total square feet, including 438,000 square feet of renewing leases, 199,000 square feet of new leases on vacant space, and 493,000 square feet in development projects. For the year ended December 31, 2017, the Company completed 3.2 million square feet of leasing, comprised of 1.8 million square feet of renewing leases, 431,000 square feet of vacancy leasing, and 975,000 square feet in development projects. |
• | Renewal Rates-During the fourth quarter, the Company renewed 86% of expiring Defense/IT leases, and 77% of total expiring leases. For the year, the Company renewed 92% of expiring Defense/IT leases and achieved an 80% renewal rate overall. |
• | Rent Spreads & Average Escalations on Renewing Leases-For the quarter ended December 31, 2017, rents on renewed space increased 5.4% on a GAAP basis and declined 4.6% on a cash basis; average escalations on renewing leases in the fourth quarter were 2.6%. For the year, GAAP rents on renewing leases increased 7.9% and cash rents decreased 1.4%. Average annual escalations on renewals completed during 2017 were 2.0%. |
• | Lease Terms-In the fourth quarter, lease terms averaged 4.6 years on renewing leases, 5.4 years on new leasing, and 10.1 years on development leasing, for a weighted average lease term of 7.1 years on all leasing. For the full year ended December 31, 2017, lease terms averaged 3.2 years on renewing leases, 5.8 years on new leasing, and 10.9 years on development leasing, for a weighted average lease term of 5.9 years on all leasing. |
• | The Company has seven properties totaling 742,000 square feet under construction that, at December 31, 2017, were 73% leased. These projects have a total estimated cost of $165.3 million, of which $69.0 million has been incurred. |
• | The Company also has two completed properties that total 352,000 square feet which are being held for the U.S. Government and which currently are 6% leased. Including these two projects, the Company’s construction pipeline totals 1.1 million square feet and is 51% leased. |
• | COPT has one project under redevelopment totaling 22,000 square feet that is 73% leased. Excluding the project’s historical net basis of $622,000, the Company has invested $1.4 million of the $3.3 million total incremental cost planned. |
• | As of December 31, 2017, the Company’s net debt plus preferred equity to adjusted book ratio was 41.2% and its net debt plus preferred equity to in-place adjusted EBITDA ratio was 6.1x. For the quarter ended December 31, 2017, the Company’s adjusted EBITDA fixed charge coverage ratio was 3.7x. |
• | As of December 31, 2017 and including the effect of interest rate swaps, the Company’s weighted average effective interest rate was 4.1%. Additionally, 93% of the Company’s debt was subject to fixed interest rates and the debt portfolio had a weighted average maturity of 5.1 years. |
• | In January 2017, the Company redeemed all $26.6 million outstanding shares of its 5.600% Series K Convertible Preferred Shares. In June, the Company redeemed all $172.5 million of its 7.375% Series L Cumulative Preferred Shares. |
• | During the first half of the year, the Company issued 591,000 common shares at a weighted average price of $33.84 per share under its existing at-the-market (“ATM”) stock offering program, netting $19.7 million of proceeds. COPT’s remaining capacity under this ATM program is an aggregate gross sales price of $70.0 million in common share sales. |
• | In November 2017, the Company entered into a $285 million forward equity sale contract. In late December, COPT issued 1.7 million common shares pursuant to the agreement for $50 million of proceeds. |
* | general economic and business conditions, which will, among other things, affect office property and data center demand and rents, tenant creditworthiness, interest rates, financing availability and property values; |
* | adverse changes in the real estate markets including, among other things, increased competition with other companies; |
* | governmental actions and initiatives, including risks associated with the impact of a prolonged government shutdown or budgetary reductions or impasses, such as a reduction in rental revenues, non-renewal of leases, and/or a curtailment of demand for additional space by the Company's strategic customers; |
* | the Company’s ability to borrow on favorable terms; |
* | risks of real estate acquisition and development activities, including, among other things, risks that development projects may not be completed on schedule, that tenants may not take occupancy or pay rent or that development or operating costs may be greater than anticipated; |
* | risks of investing through joint venture structures, including risks that the Company’s joint venture partners may not fulfill their financial obligations as investors or may take actions that are inconsistent with the Company’s objectives; |
* | changes in the Company’s plans for properties or views of market economic conditions or failure to obtain development rights, either of which could result in recognition of significant impairment losses; |
* | the Company’s ability to satisfy and operate effectively under Federal income tax rules relating to real estate investment trusts and partnerships; |
* | possible adverse changes in tax laws; |
* | the Company's ability to achieve projected results; |
* | the dilutive effects of issuing additional common shares; and |
* | environmental requirements. |
For the Three Months Ended December 31, | For the Year Ended December 31, | ||||||||||||||
2017 | 2016 | 2017 | 2016 | ||||||||||||
Revenues | |||||||||||||||
Real estate revenues | $ | 127,685 | $ | 127,999 | $ | 509,980 | $ | 525,964 | |||||||
Construction contract and other service revenues | 36,882 | 13,992 | 102,840 | 48,364 | |||||||||||
Total revenues | 164,567 | 141,991 | 612,820 | 574,328 | |||||||||||
Expenses | |||||||||||||||
Property operating expenses | 47,449 | 47,562 | 190,964 | 197,530 | |||||||||||
Depreciation and amortization associated with real estate operations | 33,938 | 32,929 | 134,228 | 132,719 | |||||||||||
Construction contract and other service expenses | 36,029 | 12,968 | 99,618 | 45,481 | |||||||||||
Impairment losses | 13,659 | 1,554 | 15,123 | 101,391 | |||||||||||
General and administrative expenses | 5,552 | 6,211 | 24,008 | 30,095 | |||||||||||
Leasing expenses | 1,447 | 1,578 | 6,829 | 6,458 | |||||||||||
Business development expenses and land carry costs | 1,646 | 1,747 | 6,213 | 8,244 | |||||||||||
Total operating expenses | 139,720 | 104,549 | 476,983 | 521,918 | |||||||||||
Operating income | 24,847 | 37,442 | 135,837 | 52,410 | |||||||||||
Interest expense | (19,211 | ) | (18,664 | ) | (76,983 | ) | (83,163 | ) | |||||||
Interest and other income | 1,501 | 1,567 | 6,318 | 5,444 | |||||||||||
Loss on early extinguishment of debt | — | (1,073 | ) | (513 | ) | (1,110 | ) | ||||||||
Income (loss) before equity in income of unconsolidated entities and income taxes | 7,137 | 19,272 | 64,659 | (26,419 | ) | ||||||||||
Equity in income of unconsolidated entities | 720 | 718 | 2,882 | 1,332 | |||||||||||
Income tax expense | (953 | ) | (272 | ) | (1,098 | ) | (244 | ) | |||||||
Gain on sales of real estate | 4,452 | 6,885 | 9,890 | 40,986 | |||||||||||
Net income | 11,356 | 26,603 | 76,333 | 15,655 | |||||||||||
Net (income) loss attributable to noncontrolling interests | |||||||||||||||
Common units in the Operating Partnership (“OP”) | (325 | ) | (793 | ) | (1,936 | ) | 155 | ||||||||
Preferred units in the OP | (165 | ) | (165 | ) | (660 | ) | (660 | ) | |||||||
Other consolidated entities | (908 | ) | (912 | ) | (3,646 | ) | (3,711 | ) | |||||||
Net income attributable to COPT | 9,958 | 24,733 | 70,091 | 11,439 | |||||||||||
Preferred share dividends | — | (3,640 | ) | (6,219 | ) | (14,297 | ) | ||||||||
Issuance costs associated with redeemed preferred shares | — | (17 | ) | (6,847 | ) | (17 | ) | ||||||||
Net income (loss) attributable to COPT common shareholders | $ | 9,958 | $ | 21,076 | $ | 57,025 | $ | (2,875 | ) | ||||||
Earnings per share (“EPS”) computation: | |||||||||||||||
Numerator for diluted EPS: | |||||||||||||||
Net income attributable to common shareholders | $ | 9,958 | $ | 21,076 | $ | 57,025 | $ | (2,875 | ) | ||||||
Amount allocable to share-based compensation awards | (112 | ) | (100 | ) | (449 | ) | (419 | ) | |||||||
Numerator for diluted EPS | $ | 9,846 | $ | 20,976 | $ | 56,576 | $ | (3,294 | ) | ||||||
Denominator: | |||||||||||||||
Weighted average common shares - basic | 99,304 | 95,066 | 98,969 | 94,502 | |||||||||||
Dilutive effect of forward equity sale agreements and share-based compensation awards | 283 | 76 | 186 | — | |||||||||||
Weighted average common shares - diluted | 99,587 | 95,142 | 99,155 | 94,502 | |||||||||||
Diluted EPS | $ | 0.10 | $ | 0.22 | $ | 0.57 | $ | (0.03 | ) | ||||||
For the Three Months Ended December 31, | For the Year Ended December 31, | ||||||||||||||
2017 | 2016 | 2017 | 2016 | ||||||||||||
Net income | $ | 11,356 | $ | 26,603 | $ | 76,333 | $ | 15,655 | |||||||
Real estate-related depreciation and amortization | 33,938 | 32,929 | 134,228 | 132,719 | |||||||||||
Impairment losses on previously depreciated operating properties | 9,004 | 1,518 | 10,455 | 83,346 | |||||||||||
Gain on sales of previously depreciated operating properties | (4,452 | ) | 312 | (4,491 | ) | (33,789 | ) | ||||||||
Depreciation and amortization on unconsolidated real estate JV | 311 | 311 | 1,243 | 518 | |||||||||||
Funds from operations (“FFO”) | 50,157 | 61,673 | 217,768 | 198,449 | |||||||||||
Preferred share dividends | — | (3,640 | ) | (6,219 | ) | (14,297 | ) | ||||||||
Noncontrolling interests - preferred units in the OP | (165 | ) | (165 | ) | (660 | ) | (660 | ) | |||||||
FFO allocable to other noncontrolling interests | (874 | ) | (1,085 | ) | (3,675 | ) | (4,020 | ) | |||||||
Issuance costs associated with redeemed preferred shares | — | (17 | ) | (6,847 | ) | (17 | ) | ||||||||
Basic and diluted FFO allocable to share-based compensation awards | (198 | ) | (208 | ) | (814 | ) | (694 | ) | |||||||
Basic and Diluted FFO available to common share and common unit holders (“Diluted FFO”) | 48,920 | 56,558 | 199,553 | 178,761 | |||||||||||
Gain on sales of non-operating properties | — | (7,197 | ) | (5,399 | ) | (7,197 | ) | ||||||||
Impairment losses on non-operating properties | 4,655 | 36 | 4,668 | 18,045 | |||||||||||
Income tax expense associated with FFO comparability adjustments | 800 | — | 800 | — | |||||||||||
Gain on interest rate derivatives | (191 | ) | (725 | ) | (234 | ) | (378 | ) | |||||||
Loss on early extinguishment of debt | — | 1,073 | 513 | 1,110 | |||||||||||
Issuance costs associated with redeemed preferred shares | — | 17 | 6,847 | 17 | |||||||||||
Demolition costs on redevelopment properties | — | — | 294 | 578 | |||||||||||
Executive transition costs | — | 431 | 732 | 6,454 | |||||||||||
Diluted FFO comparability adjustments allocable to share-based compensation awards | (23 | ) | 26 | (35 | ) | (73 | ) | ||||||||
Diluted FFO available to common share and common unit holders, as adjusted for comparability | 54,161 | 50,219 | 207,739 | 197,317 | |||||||||||
Straight line rent adjustments and lease incentive amortization | (1,343 | ) | 1,294 | 46 | 1,500 | ||||||||||
Amortization of intangibles included in net operating income | 342 | 463 | 1,344 | 1,488 | |||||||||||
Share-based compensation, net of amounts capitalized | 1,523 | 1,174 | 5,353 | 5,549 | |||||||||||
Amortization of deferred financing costs | 443 | 1,093 | 2,928 | 4,573 | |||||||||||
Amortization of net debt discounts, net of amounts capitalized | 350 | 336 | 1,379 | 1,312 | |||||||||||
Accum. other comprehensive loss on derivatives amortized to expense | 54 | — | 143 | — | |||||||||||
Replacement capital expenditures | (23,475 | ) | (13,716 | ) | (63,026 | ) | (53,102 | ) | |||||||
Other diluted AFFO adjustments associated with real estate JVs | (135 | ) | (146 | ) | (593 | ) | (150 | ) | |||||||
Diluted adjusted funds from operations available to common share and common unit holders (“Diluted AFFO”) | $ | 31,920 | $ | 40,717 | $ | 155,313 | $ | 158,487 | |||||||
Diluted FFO per share | $ | 0.48 | $ | 0.57 | $ | 1.95 | $ | 1.82 | |||||||
Diluted FFO per share, as adjusted for comparability | $ | 0.53 | $ | 0.51 | $ | 2.03 | $ | 2.01 | |||||||
Dividends/distributions per common share/unit | $ | 0.275 | $ | 0.275 | $ | 1.100 | $ | 1.100 | |||||||
December 31, 2017 | December 31, 2016 | |||||||
Balance Sheet Data | ||||||||
Properties, net of accumulated depreciation | $ | 3,141,105 | $ | 3,073,362 | ||||
Total assets | 3,578,484 | 3,780,885 | ||||||
Debt, per balance sheet | 1,828,333 | 1,904,001 | ||||||
Total liabilities | 2,103,773 | 2,163,242 | ||||||
Redeemable noncontrolling interest | 23,125 | 22,979 | ||||||
Equity | 1,451,586 | 1,594,664 | ||||||
Net debt to adjusted book | 41.0 | % | 38.3 | % | ||||
Core Portfolio Data (as of period end) (1) | ||||||||
Number of operating properties | 156 | 152 | ||||||
Total net rentable square feet owned (in thousands) | 17,059 | 16,301 | ||||||
Occupancy % | 94.5 | % | 92.9 | % | ||||
Leased % | 95.1 | % | 94.4 | % | ||||
For the Three Months Ended December 31, | For the Year Ended December 31, | ||||||||||
2017 | 2016 | 2017 | 2016 | ||||||||
Payout ratios | |||||||||||
Diluted FFO | 58.5 | % | 49.5 | % | 56.7 | % | 60.9 | % | |||
Diluted FFO, as adjusted for comparability | 52.9 | % | 55.7 | % | 54.5 | % | 55.1 | % | |||
Diluted AFFO | 89.7 | % | 68.7 | % | 72.9 | % | 68.6 | % | |||
Adjusted EBITDA fixed charge coverage ratio | 3.7 | x | 3.1 | x | 3.4 | x | 3.0 | x | |||
Net debt to in-place adjusted EBITDA ratio (2) | 6.1 | x | 5.7 | x | N/A | N/A | |||||
Net debt plus preferred equity to in-place adjusted EBITDA ratio (3) | 6.1 | x | 6.3 | x | N/A | N/A | |||||
Reconciliation of denominators for per share measures | |||||||||||
Denominator for diluted EPS | 99,587 | 95,142 | 99,155 | 94,502 | |||||||
Weighted average common units | 3,252 | 3,591 | 3,362 | 3,633 | |||||||
Anti-dilutive EPS effect of share-based compensation awards | — | — | — | 92 | |||||||
Denominator for diluted FFO per share and as adjusted for comparability | 102,839 | 98,733 | 102,517 | 98,227 | |||||||
(1) | Represents Defense/IT Locations and Regional Office properties, and includes six properties owned through an unconsolidated joint venture totaling 962,000 square feet that were 100% occupied and leased. |
(2) | Represents net debt as of period end divided by in-place adjusted EBITDA for the period, as annualized (i.e. three month periods are multiplied by four). |
(3) | Represents net debt plus the total liquidation preference of preferred equity as of period end divided by in-place adjusted EBITDA for the period, as annualized (i.e. three month periods are multiplied by four). |
For the Three Months Ended December 31, | For the Year Ended December 31, | ||||||||||||||
2017 | 2016 | 2017 | 2016 | ||||||||||||
Reconciliation of common share dividends to dividends and distributions for payout ratios | |||||||||||||||
Common share dividends - unrestricted shares | $ | 27,747 | $ | 26,991 | $ | 109,489 | $ | 104,811 | |||||||
Common unit distributions | 894 | 987 | 3,661 | 3,990 | |||||||||||
Dividends and distributions for payout ratios | $ | 28,641 | $ | 27,978 | $ | 113,150 | $ | 108,801 | |||||||
Reconciliation of GAAP net income to adjusted earnings before interest, income taxes, depreciation and amortization (“Adjusted EBITDA”) and in-place adjusted EBITDA | |||||||||||||||
Net income | $ | 11,356 | $ | 26,603 | $ | 76,333 | $ | 15,655 | |||||||
Interest expense | 19,211 | 18,664 | 76,983 | 83,163 | |||||||||||
Income tax expense | 953 | 272 | 1,098 | 244 | |||||||||||
Real estate-related depreciation and amortization | 33,938 | 32,929 | 134,228 | 132,719 | |||||||||||
Depreciation of furniture, fixtures and equipment | 600 | 512 | 2,273 | 2,151 | |||||||||||
Impairment losses | 13,659 | 1,554 | 15,123 | 101,391 | |||||||||||
Loss on early extinguishment of debt | — | 1,073 | 513 | 1,110 | |||||||||||
Gain on sales of operating properties | (4,452 | ) | 312 | (4,491 | ) | (33,789 | ) | ||||||||
Gain on sales of non-operational properties | — | (7,197 | ) | (5,399 | ) | (7,197 | ) | ||||||||
Net gain on investments in unconsolidated entities included in interest and other income | — | (117 | ) | — | (149 | ) | |||||||||
Business development expenses | 1,116 | 1,167 | 3,786 | 4,823 | |||||||||||
Demolition costs on redevelopment properties | — | — | 294 | 578 | |||||||||||
Adjustments from unconsolidated real estate JV | 577 | 578 | 2,301 | 993 | |||||||||||
Executive transition costs | — | 431 | 732 | 6,454 | |||||||||||
Adjusted EBITDA | $ | 76,958 | $ | 76,781 | $ | 303,774 | $ | 308,146 | |||||||
Proforma net operating income adjustment for property changes within period | (578 | ) | 39 | ||||||||||||
In-place adjusted EBITDA | $ | 76,380 | $ | 76,820 | |||||||||||
Reconciliation of interest expense to the denominators for fixed charge coverage-Adjusted EBITDA | |||||||||||||||
Interest expense | $ | 19,211 | $ | 18,664 | $ | 76,983 | $ | 83,163 | |||||||
Less: Amortization of deferred financing costs | (443 | ) | (1,093 | ) | (2,928 | ) | (4,573 | ) | |||||||
Less: Amortization of net debt discounts and prem., net of amounts capitalized | (350 | ) | (336 | ) | (1,379 | ) | (1,312 | ) | |||||||
Less: Accum. other comprehensive loss on derivatives amortized to expense | (54 | ) | — | (143 | ) | — | |||||||||
Gain on interest rate derivatives | 191 | 725 | 234 | 378 | |||||||||||
COPT’s share of interest expense of unconsolidated real estate JV, excluding deferred financing costs | 260 | 261 | 1,034 | 465 | |||||||||||
Scheduled principal amortization | 984 | 941 | 3,862 | 5,395 | |||||||||||
Capitalized interest | 1,032 | 1,419 | 5,229 | 5,723 | |||||||||||
Preferred share dividends | — | 3,640 | 6,219 | 14,297 | |||||||||||
Preferred unit distributions | 165 | 165 | 660 | 660 | |||||||||||
Denominator for fixed charge coverage-Adjusted EBITDA | $ | 20,996 | $ | 24,386 | $ | 89,771 | $ | 104,196 | |||||||
For the Three Months Ended December 31, | For the Year Ended December 31, | ||||||||||||||
2017 | 2016 | 2017 | 2016 | ||||||||||||
Reconciliations of tenant improvements and incentives, capital improvements and leasing costs for operating properties to replacement capital expenditures | |||||||||||||||
Tenant improvements and incentives | $ | 14,804 | $ | 8,000 | $ | 37,034 | $ | 45,020 | |||||||
Building improvements | 9,241 | 7,064 | 22,308 | 22,026 | |||||||||||
Leasing costs | 3,242 | 1,387 | 8,487 | 9,365 | |||||||||||
Net (exclusions from) additions to tenant improvements and incentives | (2,929 | ) | 871 | 2,984 | (14,073 | ) | |||||||||
Excluded building improvements | (853 | ) | (3,606 | ) | (7,757 | ) | (8,817 | ) | |||||||
Excluded leasing costs | (30 | ) | — | (30 | ) | (419 | ) | ||||||||
Replacement capital expenditures | $ | 23,475 | $ | 13,716 | $ | 63,026 | $ | 53,102 | |||||||
Same property cash NOI | $ | 69,607 | $ | 68,973 | $ | 276,440 | $ | 267,306 | |||||||
Straight line rent adjustments and lease incentive amortization | (1,635 | ) | (1,288 | ) | (4,551 | ) | (6,561 | ) | |||||||
Amortization of acquired above- and below-market rents | (287 | ) | (315 | ) | (1,123 | ) | (897 | ) | |||||||
Amortization of below-market cost arrangements | (146 | ) | (239 | ) | (585 | ) | (956 | ) | |||||||
Lease termination fee, gross | 828 | 601 | 2,911 | 2,279 | |||||||||||
Tenant funded landlord assets | 276 | 1,370 | 1,119 | 7,160 | |||||||||||
Same property NOI | $ | 68,643 | $ | 69,102 | $ | 274,211 | $ | 268,331 | |||||||
December 31, 2017 | December 31, 2016 | |||||||
Reconciliation of total assets to adjusted book | ||||||||
Total assets | $ | 3,578,484 | $ | 3,780,885 | ||||
Accumulated depreciation | 786,193 | 706,385 | ||||||
Accumulated depreciation included in assets held for sale | — | 9,566 | ||||||
Accumulated amortization of real estate intangibles and deferred leasing costs | 193,151 | 210,692 | ||||||
Accumulated amortization of real estate intangibles and deferred leasing costs included in assets held for sale | — | 11,575 | ||||||
COPT’s share of liabilities of unconsolidated real estate JV | 29,908 | 29,873 | ||||||
COPT’s share of accumulated depreciation and amortization of unconsolidated real estate JV | 3,189 | 938 | ||||||
Less: Disposed property included in assets held for sale | (42,226 | ) | — | |||||
Less: Cash and cash equivalents | (12,261 | ) | (209,863 | ) | ||||
COPT’s share of cash of unconsolidated real estate JV | (371 | ) | (283 | ) | ||||
Adjusted book | $ | 4,536,067 | $ | 4,539,768 | ||||
Reconciliation of debt outstanding to net debt and net debt plus preferred equity | ||||||||
Debt outstanding (excluding net debt discounts and deferred financing costs) | $ | 1,872,167 | $ | 1,950,229 | ||||
Less: Cash and cash equivalents | (12,261 | ) | (209,863 | ) | ||||
COPT’s share of cash of unconsolidated real estate JV | (371 | ) | (283 | ) | ||||
Net debt | $ | 1,859,535 | $ | 1,740,083 | ||||
Preferred equity | 8,800 | 207,883 | ||||||
Net debt plus preferred equity | $ | 1,868,335 | $ | 1,947,966 | ||||