 | |||||||||||||||||
Please refer to the section entitled “Definitions” for definitions of non-GAAP measures and other terms we use herein that may not be customary or commonly known. | |||||||||||||||||
 | |||||||||||||||||
| THE COMPANY | ||
| MANAGEMENT | INVESTOR RELATIONS | |||||||
| Stephen E. Budorick, President + CEO | Venkat Kommineni, VP | |||||||
| Britt A. Snider, EVP + COO | 443.285.5587 | venkat.kommineni@copt.com | |||||||
| Anthony Mifsud, EVP + CFO | ||||||||
| Michelle Layne, Senior Manager | ||||||||
443.285.5452 | michelle.layne@copt.com | ||||||||
| CORPORATE CREDIT RATING | ||
| DISCLOSURE STATEMENT | ||
1 | 1Q 2026 Supplemental Information Package |  | ||||||
| FIRM | SENIOR ANALYST | PHONE | ||||||||||||||||||
| BTIG | Tom Catherwood | 212.738.6410 | tcatherwood@btig.com | |||||||||||||||||
| Cantor Fitzgerald | Richard Anderson | 929.441.6927 | richard.anderson@cantor.com | |||||||||||||||||
| Citigroup Global Markets | Seth Bergey | 212.816.2066 | seth.bergey@citi.com | |||||||||||||||||
| Evercore ISI | Steve Sakwa | 212.446.9462 | steve.sakwa@evercoreisi.com | |||||||||||||||||
| Green Street | Dylan Burzinski | 949.640.8780 | dburzinski@greenstreet.com | |||||||||||||||||
| Jefferies | Joe Dickstein | 212.778.8771 | jdickstein1@jefferies.com | |||||||||||||||||
| JP Morgan | Tony Paolone | 212.622.6682 | anthony.paolone@jpmorgan.com | |||||||||||||||||
| Truist Securities | Michael Lewis | 212.319.5659 | michael.r.lewis@truist.com | |||||||||||||||||
| Wells Fargo Securities | Blaine Heck | 410.662.2556 | blaine.heck@wellsfargo.com | |||||||||||||||||
2 | 1Q 2026 Supplemental Information Package | | ||||||
| Page | Three Months Ended | |||||||||||||||||||||||||||||||||||||
| SUMMARY OF RESULTS | Refer. | 3/31/26 | 12/31/25 | 9/30/25 | 6/30/25 | 3/31/25 | ||||||||||||||||||||||||||||||||
| Net income | $ | 40,139 | $ | 39,396 | $ | 43,744 | $ | 40,166 | $ | 36,228 | ||||||||||||||||||||||||||||
| NOI from real estate operations | $ | 115,217 | $ | 113,952 | $ | 111,818 | $ | 112,412 | $ | 107,446 | ||||||||||||||||||||||||||||
| Same Property NOI | $ | 110,381 | $ | 110,957 | $ | 111,277 | $ | 111,907 | $ | 107,046 | ||||||||||||||||||||||||||||
| Same Property cash NOI | $ | 106,253 | $ | 106,666 | $ | 106,864 | $ | 104,519 | $ | 100,792 | ||||||||||||||||||||||||||||
| Adjusted EBITDA | $ | 107,832 | $ | 108,223 | $ | 103,771 | $ | 104,726 | $ | 99,119 | ||||||||||||||||||||||||||||
| FFO per NAREIT | $ | 81,838 | $ | 82,371 | $ | 82,090 | $ | 80,471 | $ | 76,028 | ||||||||||||||||||||||||||||
| Diluted AFFO avail. to common share and unit holders | $ | 65,084 | $ | 57,209 | $ | 63,274 | $ | 57,660 | $ | 56,045 | ||||||||||||||||||||||||||||
| Dividend per common share | N/A | $ | 0.32 | $ | 0.305 | $ | 0.305 | $ | 0.305 | $ | 0.305 | |||||||||||||||||||||||||||
| Per share - diluted | ||||||||||||||||||||||||||||||||||||||
| EPS | $ | 0.34 | $ | 0.33 | $ | 0.37 | $ | 0.34 | $ | 0.31 | ||||||||||||||||||||||||||||
| FFO - Nareit | $ | 0.69 | $ | 0.70 | $ | 0.69 | $ | 0.68 | $ | 0.65 | ||||||||||||||||||||||||||||
| FFO - as adjusted for comparability | $ | 0.69 | $ | 0.70 | $ | 0.69 | $ | 0.68 | $ | 0.65 | ||||||||||||||||||||||||||||
| Numerators for diluted per share amounts | ||||||||||||||||||||||||||||||||||||||
| Diluted EPS | $ | 38,395 | $ | 37,388 | $ | 41,594 | $ | 38,235 | $ | 34,597 | ||||||||||||||||||||||||||||
| Diluted FFO available to common share and unit holders | $ | 80,168 | $ | 80,358 | $ | 80,093 | $ | 78,635 | $ | 74,393 | ||||||||||||||||||||||||||||
| Diluted FFO available to common share and unit holders, as adjusted for comparability | $ | 80,168 | $ | 80,424 | $ | 80,121 | $ | 78,635 | $ | 74,393 | ||||||||||||||||||||||||||||
3 | 1Q 2026 Supplemental Information Package | | ||||||
| Page | As of or for Three Months Ended | |||||||||||||||||||||||||||||||||||||
| PAYOUT RATIOS AND CAPITALIZATION | Refer. | 3/31/26 | 12/31/25 | 9/30/25 | 6/30/25 | 3/31/25 | ||||||||||||||||||||||||||||||||
| GAAP | ||||||||||||||||||||||||||||||||||||||
| Payout ratio | ||||||||||||||||||||||||||||||||||||||
| Net income | N/A | 92.5% | 89.3% | 80.5% | 87.7% | 97.2% | ||||||||||||||||||||||||||||||||
| Capitalization and debt ratios | ||||||||||||||||||||||||||||||||||||||
| Total assets | $ | 4,458,909 | $ | 4,701,790 | $ | 4,351,432 | $ | 4,286,950 | $ | 4,250,311 | ||||||||||||||||||||||||||||
| Total equity | $ | 1,566,641 | $ | 1,562,169 | $ | 1,555,039 | $ | 1,545,741 | $ | 1,538,291 | ||||||||||||||||||||||||||||
| Debt per balance sheet | $ | 2,546,958 | $ | 2,767,834 | $ | 2,443,518 | $ | 2,438,591 | $ | 2,412,670 | ||||||||||||||||||||||||||||
| Debt to assets | 57.1% | 58.9% | 56.2% | 56.9% | 56.8% | |||||||||||||||||||||||||||||||||
| Net income to interest expense ratio | 1.7x | 1.6x | 2.1x | 1.9x | 1.8x | |||||||||||||||||||||||||||||||||
| Debt to net income ratio | 15.9x | 17.6x | 14.0x | 15.2x | 16.6x | |||||||||||||||||||||||||||||||||
| Non-GAAP | ||||||||||||||||||||||||||||||||||||||
| Payout ratios | ||||||||||||||||||||||||||||||||||||||
| Diluted FFO | N/A | 46.0% | 43.5% | 43.7% | 44.5% | 47.0% | ||||||||||||||||||||||||||||||||
| Diluted FFO - as adjusted for comparability | N/A | 46.0% | 43.5% | 43.7% | 44.5% | 47.0% | ||||||||||||||||||||||||||||||||
| Diluted AFFO | N/A | 56.6% | 61.2% | 55.3% | 60.7% | 62.4% | ||||||||||||||||||||||||||||||||
| Capitalization and debt ratios | ||||||||||||||||||||||||||||||||||||||
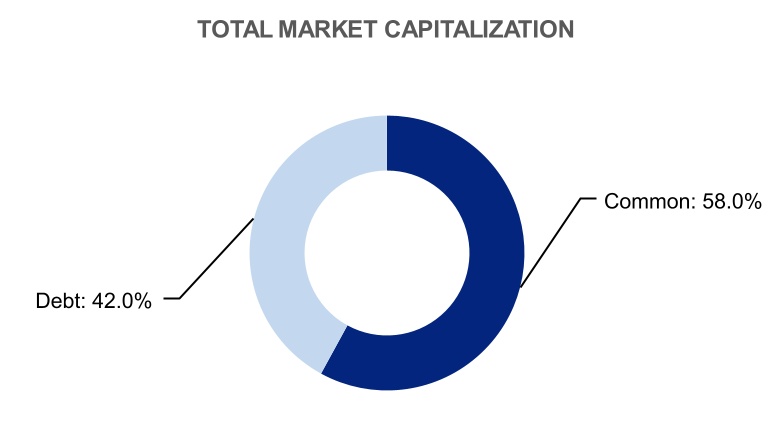
| Total Market Capitalization | $ | 6,112,751 | $ | 5,997,335 | $ | 5,814,654 | $ | 5,640,563 | $ | 5,578,378 | ||||||||||||||||||||||||||||
| Total Equity Market Capitalization | $ | 3,543,847 | $ | 3,206,035 | $ | 3,352,013 | $ | 3,181,463 | $ | 3,143,822 | ||||||||||||||||||||||||||||
| Net debt | $ | 2,614,344 | $ | 2,589,666 | $ | 2,512,124 | $ | 2,489,618 | $ | 2,462,248 | ||||||||||||||||||||||||||||
| Net debt to adjusted book | 40.6% | 40.5% | 40.2% | 40.6% | 40.7% | |||||||||||||||||||||||||||||||||
| Adjusted EBITDA fixed charge coverage ratio | 4.3x | 4.3x | 4.8x | 4.9x | 4.7x | |||||||||||||||||||||||||||||||||
| Net debt to in-place adjusted EBITDA ratio | 6.1x | 5.9x | 6.1x | 5.9x | 6.1x | |||||||||||||||||||||||||||||||||
| Net debt adjusted for fully-leased investment properties to in-place adjusted EBITDA ratio | 5.9x | 5.8x | 5.8x | 5.8x | 6.0x | |||||||||||||||||||||||||||||||||
4 | 1Q 2026 Supplemental Information Package | | ||||||
| 3/31/26 | 12/31/25 | 9/30/25 | 6/30/25 | 3/31/25 | |||||||||||||||||||||||||
| # of Properties | |||||||||||||||||||||||||||||
| Total Portfolio | 207 | 207 | 204 | 204 | 204 | ||||||||||||||||||||||||
| Consolidated Portfolio | 183 | 183 | 180 | 180 | 180 | ||||||||||||||||||||||||
| Defense/IT Portfolio | 201 | 201 | 198 | 198 | 198 | ||||||||||||||||||||||||
| Same Property | 203 | 203 | 203 | 203 | 203 | ||||||||||||||||||||||||
| % Occupied | |||||||||||||||||||||||||||||
| Total Portfolio | 94.4 | % | 94.0 | % | 93.9 | % | 94.0 | % | 93.6 | % | |||||||||||||||||||
| Consolidated Portfolio | 93.2 | % | 92.8 | % | 92.6 | % | 92.8 | % | 92.3 | % | |||||||||||||||||||
| Defense/IT Portfolio | 95.6 | % | 95.5 | % | 95.4 | % | 95.6 | % | 95.3 | % | |||||||||||||||||||
| Same Property | 94.2 | % | 93.9 | % | 93.9 | % | 94.0 | % | 93.6 | % | |||||||||||||||||||
| % Leased | |||||||||||||||||||||||||||||
| Total Portfolio | 95.2 | % | 95.3 | % | 95.7 | % | 95.6 | % | 95.1 | % | |||||||||||||||||||
| Consolidated Portfolio | 94.3 | % | 94.3 | % | 94.8 | % | 94.6 | % | 94.0 | % | |||||||||||||||||||
| Defense/IT Portfolio | 96.4 | % | 96.5 | % | 97.0 | % | 96.8 | % | 96.6 | % | |||||||||||||||||||
| Same Property | 95.1 | % | 95.4 | % | 95.7 | % | 95.5 | % | 95.1 | % | |||||||||||||||||||
| Square Feet (in thousands) | |||||||||||||||||||||||||||||
| Total Portfolio | 25,155 | 25,147 | 24,585 | 24,571 | 24,548 | ||||||||||||||||||||||||
| Consolidated Portfolio | 20,859 | 20,851 | 20,290 | 20,276 | 20,253 | ||||||||||||||||||||||||
| Defense/IT Portfolio | 23,167 | 23,159 | 22,597 | 22,583 | 22,560 | ||||||||||||||||||||||||
| Same Property | 24,557 | 24,557 | 24,557 | 24,557 | 24,557 | ||||||||||||||||||||||||
5 | 1Q 2026 Supplemental Information Package | | ||||||
| 3/31/26 | 12/31/25 | 9/30/25 | 6/30/25 | 3/31/25 | |||||||||||||||||||||||||
| Assets | |||||||||||||||||||||||||||||
| Properties, net | |||||||||||||||||||||||||||||
| Operating properties, net | $ | 3,494,556 | $ | 3,500,087 | $ | 3,372,672 | $ | 3,359,676 | $ | 3,343,341 | |||||||||||||||||||
| Development and redevelopment in progress, including land (1) | 120,936 | 95,284 | 140,091 | 108,710 | 89,132 | ||||||||||||||||||||||||
| Land held (1) | 187,484 | 188,106 | 213,093 | 214,170 | 211,009 | ||||||||||||||||||||||||
| Total properties, net | 3,802,976 | 3,783,477 | 3,725,856 | 3,682,556 | 3,643,482 | ||||||||||||||||||||||||
| Property - operating lease right-of-use assets | 48,906 | 50,383 | 51,838 | 53,271 | 54,374 | ||||||||||||||||||||||||
| Cash and cash equivalents | 28,580 | 274,986 | 23,687 | 21,288 | 24,292 | ||||||||||||||||||||||||
| Investment in unconsolidated real estate joint ventures | 35,818 | 36,368 | 36,301 | 38,555 | 38,960 | ||||||||||||||||||||||||
| Accounts receivable, net | 51,907 | 58,185 | 38,931 | 43,873 | 45,924 | ||||||||||||||||||||||||
| Deferred rent receivable | 182,647 | 177,921 | 173,758 | 171,257 | 165,968 | ||||||||||||||||||||||||
| Lease incentives, net | 71,879 | 72,347 | 68,263 | 66,478 | 64,260 | ||||||||||||||||||||||||
| Deferred leasing costs, net | 76,430 | 75,052 | 72,272 | 73,342 | 71,468 | ||||||||||||||||||||||||
| Investing receivables, net | 69,922 | 69,856 | 79,772 | 79,300 | 78,430 | ||||||||||||||||||||||||
| Prepaid expenses and other assets, net | 89,844 | 103,215 | 80,754 | 57,030 | 63,153 | ||||||||||||||||||||||||
| Total assets | $ | 4,458,909 | $ | 4,701,790 | $ | 4,351,432 | $ | 4,286,950 | $ | 4,250,311 | |||||||||||||||||||
| Liabilities and equity | |||||||||||||||||||||||||||||
| Liabilities | |||||||||||||||||||||||||||||
| Debt | $ | 2,546,958 | $ | 2,767,834 | $ | 2,443,518 | $ | 2,438,591 | $ | 2,412,670 | |||||||||||||||||||
| Accounts payable and accrued expenses | 116,954 | 147,200 | 135,331 | 106,749 | 98,039 | ||||||||||||||||||||||||
| Rents received in advance and security deposits | 40,252 | 37,914 | 36,988 | 37,799 | 41,624 | ||||||||||||||||||||||||
| Dividends and distributions payable | 37,102 | 35,205 | 35,220 | 35,214 | 35,208 | ||||||||||||||||||||||||
| Deferred revenue associated with operating leases | 47,874 | 47,714 | 43,671 | 39,325 | 38,915 | ||||||||||||||||||||||||
| Property - operating lease liabilities | 43,768 | 45,012 | 46,203 | 47,372 | 48,216 | ||||||||||||||||||||||||
| Other liabilities | 34,230 | 33,236 | 31,245 | 12,901 | 13,809 | ||||||||||||||||||||||||
| Total liabilities | 2,867,138 | 3,114,115 | 2,772,176 | 2,717,951 | 2,688,481 | ||||||||||||||||||||||||
| Redeemable noncontrolling interest | 25,130 | 25,506 | 24,217 | 23,258 | 23,539 | ||||||||||||||||||||||||
| Equity | |||||||||||||||||||||||||||||
| COPT Defense’s shareholders’ equity | |||||||||||||||||||||||||||||
| Common shares | 1,134 | 1,132 | 1,130 | 1,129 | 1,129 | ||||||||||||||||||||||||
| Additional paid-in capital | 2,500,341 | 2,502,661 | 2,497,736 | 2,495,422 | 2,492,454 | ||||||||||||||||||||||||
| Cumulative distributions in excess of net income | (986,706) | (988,957) | (991,935) | (999,218) | (1,003,120) | ||||||||||||||||||||||||
| Accumulated other comprehensive income (loss) | 34 | (61) | 79 | 342 | 403 | ||||||||||||||||||||||||
| Total COPT Defense’s shareholders’ equity | 1,514,803 | 1,514,775 | 1,507,010 | 1,497,675 | 1,490,866 | ||||||||||||||||||||||||
| Noncontrolling interests in subsidiaries | |||||||||||||||||||||||||||||
| Common units in the Operating Partnership | 33,687 | 29,317 | 33,024 | 33,181 | 32,745 | ||||||||||||||||||||||||
| Other consolidated entities | 18,151 | 18,077 | 15,005 | 14,885 | 14,680 | ||||||||||||||||||||||||
| Total noncontrolling interests in subsidiaries | 51,838 | 47,394 | 48,029 | 48,066 | 47,425 | ||||||||||||||||||||||||
| Total equity | 1,566,641 | 1,562,169 | 1,555,039 | 1,545,741 | 1,538,291 | ||||||||||||||||||||||||
| Total liabilities, redeemable noncontrolling interest, and equity | $ | 4,458,909 | $ | 4,701,790 | $ | 4,351,432 | $ | 4,286,950 | $ | 4,250,311 | |||||||||||||||||||
6 | 1Q 2026 Supplemental Information Package | | ||||||
| Three Months Ended | |||||||||||||||||||||||||||||
| 3/31/26 | 12/31/25 | 9/30/25 | 6/30/25 | 3/31/25 | |||||||||||||||||||||||||
| Revenues | |||||||||||||||||||||||||||||
| Lease revenue | $ | 192,971 | $ | 185,002 | $ | 178,272 | $ | 175,598 | $ | 175,308 | |||||||||||||||||||
| Other property revenue | 1,625 | 1,483 | 2,038 | 1,859 | 2,289 | ||||||||||||||||||||||||
| Construction contract and other service revenues | 6,041 | 10,872 | 8,485 | 12,458 | 10,259 | ||||||||||||||||||||||||
| Total revenues | 200,637 | 197,357 | 188,795 | 189,915 | 187,856 | ||||||||||||||||||||||||
| Operating expenses | |||||||||||||||||||||||||||||
| Property operating expenses | 81,435 | 74,616 | 70,356 | 66,915 | 72,040 | ||||||||||||||||||||||||
| Depreciation and amortization associated with real estate operations | 42,685 | 42,263 | 40,631 | 39,573 | 39,359 | ||||||||||||||||||||||||
| Construction contract and other service expenses | 5,552 | 10,432 | 7,952 | 11,873 | 9,705 | ||||||||||||||||||||||||
| General and administrative expenses | 8,456 | 7,943 | 8,483 | 8,202 | 8,148 | ||||||||||||||||||||||||
| Leasing expenses | 2,994 | 2,896 | 2,449 | 2,613 | 2,999 | ||||||||||||||||||||||||
| Business development expenses and land carry costs | 1,199 | 904 | 1,098 | 1,096 | 1,009 | ||||||||||||||||||||||||
| Total operating expenses | 142,321 | 139,054 | 130,969 | 130,272 | 133,260 | ||||||||||||||||||||||||
| Interest expense | (23,996) | (24,324) | (20,894) | (20,938) | (20,504) | ||||||||||||||||||||||||
| Interest and other income, net | 3,955 | 5,301 | 2,591 | 1,223 | 1,568 | ||||||||||||||||||||||||
| Gain on sales of real estate | 582 | 32 | 3,018 | — | 300 | ||||||||||||||||||||||||
| Loss on early extinguishment of debt | — | (66) | — | — | — | ||||||||||||||||||||||||
| Income before equity in income of unconsolidated entities and income taxes | 38,857 | 39,246 | 42,541 | 39,928 | 35,960 | ||||||||||||||||||||||||
| Equity in income of unconsolidated entities | 1,406 | 265 | 1,815 | 355 | 371 | ||||||||||||||||||||||||
| Income tax expense | (124) | (115) | (612) | (117) | (103) | ||||||||||||||||||||||||
| Net income | 40,139 | 39,396 | 43,744 | 40,166 | 36,228 | ||||||||||||||||||||||||
| Net income attributable to noncontrolling interests | |||||||||||||||||||||||||||||
| Common units in the Operating Partnership | (812) | (743) | (924) | (846) | (726) | ||||||||||||||||||||||||
| Other consolidated entities | (771) | (1,152) | (1,093) | (973) | (762) | ||||||||||||||||||||||||
| Net income attributable to common shareholders | $ | 38,556 | $ | 37,501 | $ | 41,727 | $ | 38,347 | $ | 34,740 | |||||||||||||||||||
| Amount allocable to share-based compensation awards | (161) | (113) | (133) | (112) | (143) | ||||||||||||||||||||||||
| Numerator for diluted EPS | $ | 38,395 | $ | 37,388 | $ | 41,594 | $ | 38,235 | $ | 34,597 | |||||||||||||||||||
7 | 1Q 2026 Supplemental Information Package | | ||||||
| Three Months Ended | |||||||||||||||||||||||||||||
| 3/31/26 | 12/31/25 | 9/30/25 | 6/30/25 | 3/31/25 | |||||||||||||||||||||||||
| Net income | $ | 40,139 | $ | 39,396 | $ | 43,744 | $ | 40,166 | $ | 36,228 | |||||||||||||||||||
| Real estate-related depreciation and amortization | 42,685 | 42,263 | 40,631 | 39,573 | 39,359 | ||||||||||||||||||||||||
| Gain on sales of real estate | (582) | (32) | (3,018) | — | (300) | ||||||||||||||||||||||||
| Depreciation and amortization on unconsolidated real estate JVs (1) | 742 | 744 | 733 | 732 | 741 | ||||||||||||||||||||||||
| Gain on sale of real estate on unconsolidated real estate JV (1) | (1,146) | — | — | — | — | ||||||||||||||||||||||||
| FFO - per Nareit (2) | 81,838 | 82,371 | 82,090 | 80,471 | 76,028 | ||||||||||||||||||||||||
| FFO allocable to other noncontrolling interests (3) | (1,131) | (1,524) | (1,502) | (1,382) | (1,158) | ||||||||||||||||||||||||
| Basic FFO allocable to share-based compensation awards | (603) | (543) | (548) | (550) | (530) | ||||||||||||||||||||||||
| Basic FFO available to common share and common unit holders (2) | 80,104 | 80,304 | 80,040 | 78,539 | 74,340 | ||||||||||||||||||||||||
| Diluted FFO adjustments allocable to share-based compensation awards | 64 | 54 | 53 | 96 | 53 | ||||||||||||||||||||||||
| Diluted FFO available to common share and common unit holders - per Nareit (2) | 80,168 | 80,358 | 80,093 | 78,635 | 74,393 | ||||||||||||||||||||||||
| Loss on early extinguishment of debt | — | 66 | — | — | — | ||||||||||||||||||||||||
| Loss on early extinguishment of debt on unconsolidated real estate JVs (1) | — | — | 28 | — | — | ||||||||||||||||||||||||
| Diluted FFO available to common share and common unit holders, as adjusted for comparability (2) | $ | 80,168 | $ | 80,424 | $ | 80,121 | $ | 78,635 | $ | 74,393 | |||||||||||||||||||
8 | 1Q 2026 Supplemental Information Package | | ||||||
| Three Months Ended | |||||||||||||||||||||||||||||
| 3/31/26 | 12/31/25 | 9/30/25 | 6/30/25 | 3/31/25 | |||||||||||||||||||||||||
| EPS Denominator | |||||||||||||||||||||||||||||
| Weighted average common shares - basic | 112,806 | 112,733 | 112,485 | 112,459 | 112,383 | ||||||||||||||||||||||||
| Dilutive effect of share-based compensation awards | 1,031 | 850 | 702 | 765 | 643 | ||||||||||||||||||||||||
| Dilutive exchangeable debt | 472 | — | — | — | — | ||||||||||||||||||||||||
| Weighted average common shares - diluted | 114,309 | 113,583 | 113,187 | 113,224 | 113,026 | ||||||||||||||||||||||||
| Diluted EPS | $ | 0.34 | $ | 0.33 | $ | 0.37 | $ | 0.34 | $ | 0.31 | |||||||||||||||||||
| Weighted Average Shares for period ended | |||||||||||||||||||||||||||||
| Common shares | 112,806 | 112,733 | 112,485 | 112,459 | 112,383 | ||||||||||||||||||||||||
| Dilutive effect of share-based compensation awards | 1,031 | 850 | 702 | 765 | 643 | ||||||||||||||||||||||||
| Common units | 2,063 | 1,926 | 2,182 | 2,177 | 2,047 | ||||||||||||||||||||||||
| Dilutive exchangeable debt | 472 | — | — | — | — | ||||||||||||||||||||||||
| Denominator for diluted FFO per share and as adjusted for comparability | 116,372 | 115,509 | 115,369 | 115,401 | 115,073 | ||||||||||||||||||||||||
| Weighted average common units | (2,063) | (1,926) | (2,182) | (2,177) | (2,047) | ||||||||||||||||||||||||
| Denominator for diluted EPS | 114,309 | 113,583 | 113,187 | 113,224 | 113,026 | ||||||||||||||||||||||||
| Diluted FFO per share - Nareit (1) | $ | 0.69 | $ | 0.70 | $ | 0.69 | $ | 0.68 | $ | 0.65 | |||||||||||||||||||
| Diluted FFO per share - as adjusted for comparability (1) | $ | 0.69 | $ | 0.70 | $ | 0.69 | $ | 0.68 | $ | 0.65 | |||||||||||||||||||
9 | 1Q 2026 Supplemental Information Package | | ||||||
| Three Months Ended | |||||||||||||||||||||||||||||
| 3/31/26 | 12/31/25 | 9/30/25 | 6/30/25 | 3/31/25 | |||||||||||||||||||||||||
| Diluted FFO available to common share and common unit holders, as adjusted for comparability (1) | $ | 80,168 | $ | 80,424 | $ | 80,121 | $ | 78,635 | $ | 74,393 | |||||||||||||||||||
| Straight line rent adjustments and lease incentive amortization | (1,330) | 3,634 | 5,053 | (1,836) | (1,699) | ||||||||||||||||||||||||
| Amortization of intangibles and other assets included in NOI | 60 | (384) | 42 | 64 | 162 | ||||||||||||||||||||||||
| Share-based compensation, net of amounts capitalized | 3,186 | 2,954 | 2,961 | 2,924 | 2,854 | ||||||||||||||||||||||||
| Amortization of deferred financing costs | 832 | 817 | 657 | 657 | 667 | ||||||||||||||||||||||||
| Amortization of net debt discounts, net of amounts capitalized | 1,217 | 1,282 | 1,070 | 1,060 | 1,051 | ||||||||||||||||||||||||
| Replacement capital expenditures (1) | (19,205) | (31,290) | (26,982) | (23,919) | (21,464) | ||||||||||||||||||||||||
| Other | 156 | (228) | 352 | 75 | 81 | ||||||||||||||||||||||||
| Diluted AFFO available to common share and common unit holders (“diluted AFFO”) (1) | $ | 65,084 | $ | 57,209 | $ | 63,274 | $ | 57,660 | $ | 56,045 | |||||||||||||||||||
| Replacement capital expenditures (1) | |||||||||||||||||||||||||||||
| Tenant improvements and incentives | $ | 15,899 | $ | 25,671 | $ | 24,769 | $ | 15,293 | $ | 13,758 | |||||||||||||||||||
| Building improvements | 1,142 | 8,888 | 3,662 | 5,641 | 1,872 | ||||||||||||||||||||||||
| Leasing costs | 1,547 | 5,008 | 2,240 | 4,929 | 3,461 | ||||||||||||||||||||||||
| Net additions to (exclusions from) tenant improvements and incentives | 924 | (6,335) | (3,390) | (241) | 3,538 | ||||||||||||||||||||||||
| Excluded building improvements | (307) | (1,942) | (299) | (1,703) | (201) | ||||||||||||||||||||||||
| Excluded leasing costs | — | — | — | — | (964) | ||||||||||||||||||||||||
| Replacement capital expenditures | $ | 19,205 | $ | 31,290 | $ | 26,982 | $ | 23,919 | $ | 21,464 | |||||||||||||||||||
10 | 1Q 2026 Supplemental Information Package | | ||||||
| Three Months Ended | |||||||||||||||||||||||||||||
| 3/31/26 | 12/31/25 | 9/30/25 | 6/30/25 | 3/31/25 | |||||||||||||||||||||||||
| Net income | $ | 40,139 | $ | 39,396 | $ | 43,744 | $ | 40,166 | $ | 36,228 | |||||||||||||||||||
| Interest expense | 23,996 | 24,324 | 20,894 | 20,938 | 20,504 | ||||||||||||||||||||||||
| Income tax expense | 124 | 115 | 612 | 117 | 103 | ||||||||||||||||||||||||
| Real estate-related depreciation and amortization | 42,685 | 42,263 | 40,631 | 39,573 | 39,359 | ||||||||||||||||||||||||
| Other depreciation and amortization | 416 | 435 | 428 | 468 | 542 | ||||||||||||||||||||||||
| Gain on sales of real estate | (582) | (32) | (3,018) | — | (300) | ||||||||||||||||||||||||
| Adjustments from unconsolidated real estate JVs | 650 | 1,818 | 1,758 | 1,515 | 1,518 | ||||||||||||||||||||||||
| EBITDAre (1) | 107,428 | 108,319 | 105,049 | 102,777 | 97,954 | ||||||||||||||||||||||||
| Credit loss (recoveries) expense | (369) | (644) | (324) | 1,187 | 515 | ||||||||||||||||||||||||
| Business development expenses | 802 | 508 | 731 | 741 | 593 | ||||||||||||||||||||||||
| Executive transition costs | — | — | — | 21 | 57 | ||||||||||||||||||||||||
| Loss on early extinguishment of debt | — | 66 | — | — | — | ||||||||||||||||||||||||
| Loss on early extinguishment of debt on unconsolidated real estate JVs | — | — | 28 | — | — | ||||||||||||||||||||||||
| Net gain on other investments | (29) | (26) | (1,713) | — | — | ||||||||||||||||||||||||
| Adjusted EBITDA (1) | 107,832 | 108,223 | 103,771 | 104,726 | 99,119 | ||||||||||||||||||||||||
| Pro forma NOI adjustment for property changes within period | — | 1,969 | 21 | 57 | 786 | ||||||||||||||||||||||||
| Change in collectability of deferred rental revenue | 86 | 127 | — | 20 | 1,232 | ||||||||||||||||||||||||
| In-place adjusted EBITDA (1) | $ | 107,918 | $ | 110,319 | $ | 103,792 | $ | 104,803 | $ | 101,137 | |||||||||||||||||||
11 | 1Q 2026 Supplemental Information Package | | ||||||
| # of Properties | Operational Square Feet | % Occupied | % Leased | |||||||||||||||||||||||
| Defense/IT Portfolio | ||||||||||||||||||||||||||
| Fort Meade/Baltimore Washington (“BW”) Corridor | ||||||||||||||||||||||||||
| National Business Park (Annapolis Junction, MD) | 34 | 4,288 | 96.8% | 97.0% | ||||||||||||||||||||||
| Howard County, MD | 36 | 3,084 | 90.0% | 92.1% | ||||||||||||||||||||||
| Other | 25 | 1,883 | 91.8% | 93.5% | ||||||||||||||||||||||
| Total Fort Meade/BW Corridor | 95 | 9,255 | 93.5% | 94.7% | ||||||||||||||||||||||
| Redstone Arsenal (Huntsville, AL) | 25 | 2,525 | 96.1% | 97.9% | ||||||||||||||||||||||
| Northern Virginia (“NoVA”) Defense/IT | 17 | 2,644 | 93.9% | 94.5% | ||||||||||||||||||||||
| Lackland Air Force Base (San Antonio, TX) | 9 | 1,143 | 100.0% | 100.0% | ||||||||||||||||||||||
| Navy Support | 22 | 1,271 | 88.2% | 89.4% | ||||||||||||||||||||||
| Data Center Shells | ||||||||||||||||||||||||||
| Consolidated Properties | 9 | 2,034 | 100.0% | 100.0% | ||||||||||||||||||||||
| Unconsolidated JV Properties (1) | 24 | 4,295 | 100.0% | 100.0% | ||||||||||||||||||||||
| Total Defense/IT Portfolio | 201 | 23,167 | 95.6% | 96.4% | ||||||||||||||||||||||
| Other | 6 | 1,988 | 79.7% | 81.4% | ||||||||||||||||||||||
| Total Portfolio | 207 | 25,155 | 94.4% | 95.2% | ||||||||||||||||||||||
| Consolidated Portfolio | 183 | 20,859 | 93.2% | 94.3% | ||||||||||||||||||||||
12 | 1Q 2026 Supplemental Information Package | | ||||||
| Three Months Ended | |||||||||||||||||||||||||||||
| 3/31/26 | 12/31/25 | 9/30/25 | 6/30/25 | 3/31/25 | |||||||||||||||||||||||||
| Consolidated real estate revenues | |||||||||||||||||||||||||||||
| Defense/IT Portfolio | |||||||||||||||||||||||||||||
| Fort Meade/BW Corridor | $ | 87,533 | $ | 82,215 | $ | 81,756 | $ | 81,337 | $ | 84,608 | |||||||||||||||||||
| Redstone Arsenal | 20,645 | 19,783 | 19,477 | 18,977 | 16,422 | ||||||||||||||||||||||||
| NoVA Defense/IT | 24,816 | 23,307 | 22,343 | 22,018 | 23,162 | ||||||||||||||||||||||||
| Lackland Air Force Base | 18,354 | 20,639 | 18,555 | 17,475 | 16,410 | ||||||||||||||||||||||||
| Navy Support | 8,992 | 8,621 | 8,727 | 8,258 | 7,960 | ||||||||||||||||||||||||
| Data Center Shells-Consolidated | 14,665 | 12,642 | 10,715 | 10,644 | 10,865 | ||||||||||||||||||||||||
| Total Defense/IT Portfolio | 175,005 | 167,207 | 161,573 | 158,709 | 159,427 | ||||||||||||||||||||||||
| Other | 19,591 | 19,278 | 18,737 | 18,748 | 18,170 | ||||||||||||||||||||||||
| Consolidated real estate revenues (1) | $ | 194,596 | $ | 186,485 | $ | 180,310 | $ | 177,457 | $ | 177,597 | |||||||||||||||||||
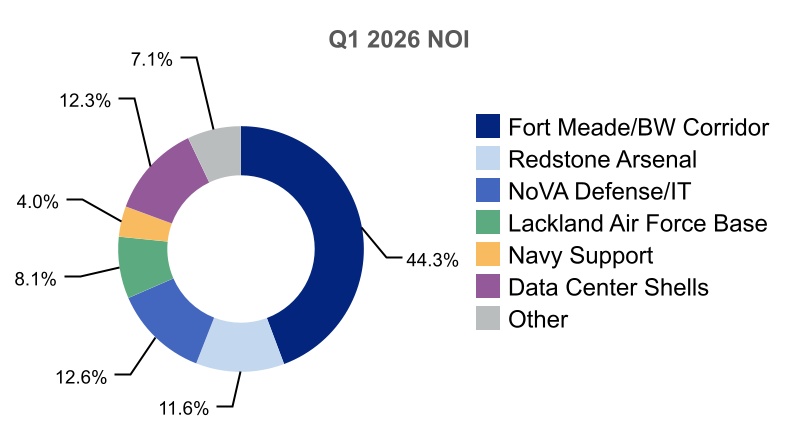
| NOI from real estate operations (2) | |||||||||||||||||||||||||||||
| Defense/IT Portfolio | |||||||||||||||||||||||||||||
| Fort Meade/BW Corridor | $ | 51,053 | $ | 52,028 | $ | 53,279 | $ | 54,440 | $ | 52,678 | |||||||||||||||||||
| Redstone Arsenal | 13,396 | 12,857 | 12,227 | 12,817 | 10,128 | ||||||||||||||||||||||||
| NoVA Defense/IT | 14,460 | 14,104 | 13,452 | 13,160 | 13,073 | ||||||||||||||||||||||||
| Lackland Air Force Base | 9,356 | 9,059 | 8,310 | 8,234 | 7,411 | ||||||||||||||||||||||||
| Navy Support | 4,633 | 4,807 | 4,711 | 4,402 | 3,794 | ||||||||||||||||||||||||
| Data Center Shells | |||||||||||||||||||||||||||||
| Consolidated properties | 12,116 | 10,486 | 9,014 | 8,861 | 9,012 | ||||||||||||||||||||||||
| COPT Defense’s share of unconsolidated real estate JVs | 2,056 | 2,083 | 1,864 | 1,870 | 1,889 | ||||||||||||||||||||||||
| Total Defense/IT Portfolio | 107,070 | 105,424 | 102,857 | 103,784 | 97,985 | ||||||||||||||||||||||||
| Other | 8,147 | 8,528 | 8,961 | 8,628 | 9,461 | ||||||||||||||||||||||||
| NOI from real estate operations (1) | $ | 115,217 | $ | 113,952 | $ | 111,818 | $ | 112,412 | $ | 107,446 | |||||||||||||||||||
13 | 1Q 2026 Supplemental Information Package | | ||||||
| Three Months Ended | |||||||||||||||||||||||||||||
| 3/31/26 | 12/31/25 | 9/30/25 | 6/30/25 | 3/31/25 | |||||||||||||||||||||||||
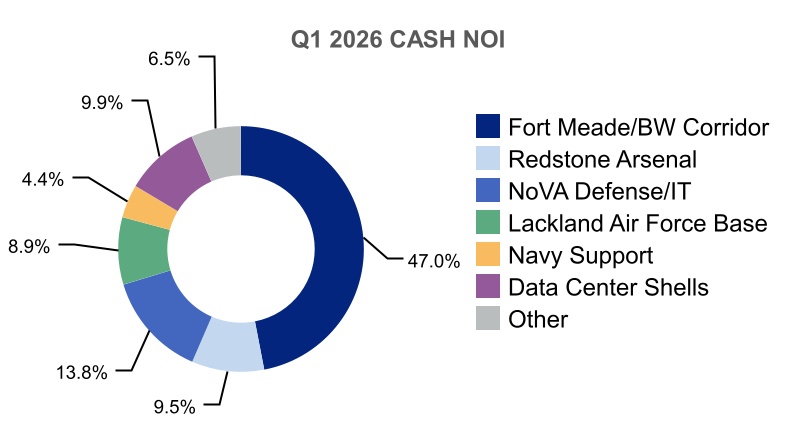
| Cash NOI from real estate operations (1) | |||||||||||||||||||||||||||||
| Defense/IT Portfolio | |||||||||||||||||||||||||||||
| Fort Meade/BW Corridor | $ | 50,873 | $ | 52,727 | $ | 53,019 | $ | 51,640 | $ | 50,104 | |||||||||||||||||||
| Redstone Arsenal | 10,322 | 9,937 | 9,549 | 10,283 | 8,723 | ||||||||||||||||||||||||
| NoVA Defense/IT | 14,964 | 14,607 | 13,669 | 12,717 | 12,263 | ||||||||||||||||||||||||
| Lackland Air Force Base | 9,606 | 8,946 | 8,863 | 8,846 | 8,086 | ||||||||||||||||||||||||
| Navy Support | 4,744 | 4,628 | 4,155 | 4,215 | 3,833 | ||||||||||||||||||||||||
| Data Center Shells | |||||||||||||||||||||||||||||
| Consolidated properties | 8,989 | 8,170 | 8,217 | 7,521 | 7,002 | ||||||||||||||||||||||||
| COPT Defense’s share of unconsolidated real estate JVs | 1,701 | 1,682 | 1,655 | 1,651 | 1,628 | ||||||||||||||||||||||||
| Total Defense/IT Portfolio | 101,199 | 100,697 | 99,127 | 96,873 | 91,639 | ||||||||||||||||||||||||
| Other | 7,105 | 7,010 | 7,997 | 8,054 | 9,586 | ||||||||||||||||||||||||
| Cash NOI from real estate operations (2) | $ | 108,304 | $ | 107,707 | $ | 107,124 | $ | 104,927 | $ | 101,225 | |||||||||||||||||||
14 | 1Q 2026 Supplemental Information Package | | ||||||
| As of Period End | NOI from Real Estate Operations (3) | |||||||||||||||||||||||||||||||||||||||||||
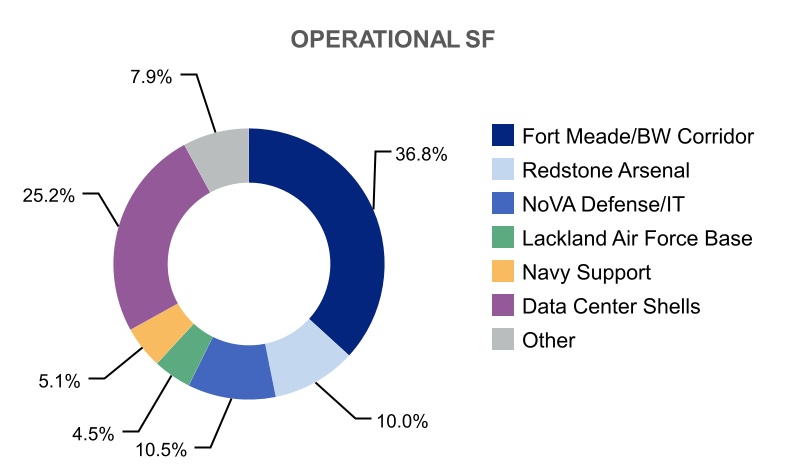
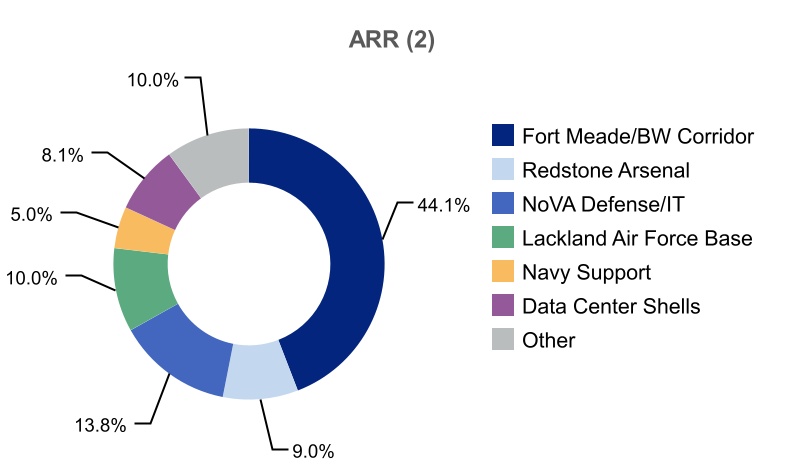
| # of Properties | Operational Square Feet | % Occupied (1) | % Leased (1) | Annualized Rental Revenue (2) | % of Total Annualized Rental Revenue (2) | |||||||||||||||||||||||||||||||||||||||
| Property Grouping | Three Months Ended | |||||||||||||||||||||||||||||||||||||||||||
| Defense/IT Portfolio | ||||||||||||||||||||||||||||||||||||||||||||
| Same Property (2) | ||||||||||||||||||||||||||||||||||||||||||||
| Consolidated properties | 173 | 18,274 | 94.5% | 95.5% | $ | 641,459 | 86.5 | % | $ | 100,548 | ||||||||||||||||||||||||||||||||||
| Unconsolidated JV properties | 24 | 4,295 | 100.0% | 100.0% | 8,498 | 1.1 | % | 2,056 | ||||||||||||||||||||||||||||||||||||
| Total Same Property in Defense/IT Portfolio | 197 | 22,569 | 95.5% | 96.3% | 649,957 | 87.6 | % | 102,604 | ||||||||||||||||||||||||||||||||||||
| Properties Placed in Service (4) | 3 | 456 | 100.0% | 100.0% | 12,528 | 1.7 | % | 3,435 | ||||||||||||||||||||||||||||||||||||
| Acquired properties | 1 | 142 | 100.0% | 100.0% | 4,959 | 0.7 | % | 1,031 | ||||||||||||||||||||||||||||||||||||
| Total Defense/IT Portfolio | 201 | 23,167 | 95.6% | 96.4% | 667,444 | 90.0 | % | 107,070 | ||||||||||||||||||||||||||||||||||||
| Other | 6 | 1,988 | 79.7% | 81.4% | 74,334 | 10.0 | % | 8,147 | ||||||||||||||||||||||||||||||||||||
| Total Portfolio | 207 | 25,155 | 94.4% | 95.2% | $ | 741,778 | 100.0 | % | $ | 115,217 | ||||||||||||||||||||||||||||||||||
| Consolidated Portfolio | 183 | 20,859 | 93.2% | 94.3% | $ | 733,280 | 98.9 | % | $ | 113,161 | ||||||||||||||||||||||||||||||||||
15 | 1Q 2026 Supplemental Information Package | | ||||||
| # of Properties | Operational Square Feet | Three Months Ended | |||||||||||||||||||||||||||||||||||||||
| 3/31/26 | 12/31/25 | 9/30/25 | 6/30/25 | 3/31/25 | |||||||||||||||||||||||||||||||||||||
| Defense/IT Portfolio | |||||||||||||||||||||||||||||||||||||||||
| Fort Meade/BW Corridor | 95 | 9,255 | 93.4 | % | 93.6 | % | 94.3 | % | 94.4 | % | 94.7 | % | |||||||||||||||||||||||||||||
| Redstone Arsenal | 24 | 2,475 | 96.0 | % | 96.6 | % | 96.0 | % | 95.5 | % | 94.8 | % | |||||||||||||||||||||||||||||
| NoVA Defense/IT | 16 | 2,501 | 93.3 | % | 92.8 | % | 93.1 | % | 92.5 | % | 92.3 | % | |||||||||||||||||||||||||||||
| Lackland Air Force Base | 9 | 1,143 | 100.0 | % | 100.0 | % | 100.0 | % | 100.0 | % | 95.3 | % | |||||||||||||||||||||||||||||
| Navy Support | 22 | 1,271 | 86.8 | % | 85.8 | % | 83.5 | % | 83.4 | % | 82.1 | % | |||||||||||||||||||||||||||||
| Data Center Shells | |||||||||||||||||||||||||||||||||||||||||
| Consolidated properties | 7 | 1,629 | 100.0 | % | 100.0 | % | 100.0 | % | 100.0 | % | 100.0 | % | |||||||||||||||||||||||||||||
| Unconsolidated JV properties | 24 | 4,295 | 100.0 | % | 100.0 | % | 100.0 | % | 100.0 | % | 100.0 | % | |||||||||||||||||||||||||||||
| Total Defense/IT Portfolio | 197 | 22,569 | 95.4 | % | 95.4 | % | 95.5 | % | 95.4 | % | 95.2 | % | |||||||||||||||||||||||||||||
| Other | 6 | 1,988 | 79.2 | % | 76.8 | % | 76.2 | % | 75.6 | % | 73.3 | % | |||||||||||||||||||||||||||||
| Total Same Property | 203 | 24,557 | 94.1 | % | 93.9 | % | 94.0 | % | 93.8 | % | 93.4 | % | |||||||||||||||||||||||||||||
Same Property (1) Period End Occupancy Rates by Segment (square feet in thousands) | |||||||||||||||||||||||||||||||||||||||||
| # of Properties | Operational Square Feet | ||||||||||||||||||||||||||||||||||||||||
| 3/31/26 | 12/31/25 | 9/30/25 | 6/30/25 | 3/31/25 | |||||||||||||||||||||||||||||||||||||
| Defense/IT Portfolio | |||||||||||||||||||||||||||||||||||||||||
| Fort Meade/BW Corridor | 95 | 9,255 | 93.5 | % | 93.6 | % | 94.1 | % | 94.5 | % | 94.4 | % | |||||||||||||||||||||||||||||
| Redstone Arsenal | 24 | 2,475 | 96.0 | % | 96.0 | % | 95.7 | % | 95.7 | % | 95.3 | % | |||||||||||||||||||||||||||||
| NoVA Defense/IT | 16 | 2,501 | 93.5 | % | 93.1 | % | 93.0 | % | 93.1 | % | 92.2 | % | |||||||||||||||||||||||||||||
| Lackland Air Force Base | 9 | 1,143 | 100.0 | % | 100.0 | % | 100.0 | % | 100.0 | % | 100.0 | % | |||||||||||||||||||||||||||||
| Navy Support | 22 | 1,271 | 88.2 | % | 86.9 | % | 83.9 | % | 84.0 | % | 81.6 | % | |||||||||||||||||||||||||||||
| Data Center Shells | |||||||||||||||||||||||||||||||||||||||||
| Consolidated properties | 7 | 1,629 | 100.0 | % | 100.0 | % | 100.0 | % | 100.0 | % | 100.0 | % | |||||||||||||||||||||||||||||
| Unconsolidated JV properties | 24 | 4,295 | 100.0 | % | 100.0 | % | 100.0 | % | 100.0 | % | 100.0 | % | |||||||||||||||||||||||||||||
| Total Defense/IT Portfolio | 197 | 22,569 | 95.5 | % | 95.4 | % | 95.4 | % | 95.6 | % | 95.3 | % | |||||||||||||||||||||||||||||
| Other | 6 | 1,988 | 79.7 | % | 76.6 | % | 76.8 | % | 76.2 | % | 74.7 | % | |||||||||||||||||||||||||||||
| Total Same Property | 203 | 24,557 | 94.2 | % | 93.9 | % | 93.9 | % | 94.0 | % | 93.6 | % | |||||||||||||||||||||||||||||
16 | 1Q 2026 Supplemental Information Package | | ||||||
| Three Months Ended | |||||||||||||||||||||||||||||
| 3/31/26 | 12/31/25 | 9/30/25 | 6/30/25 | 3/31/25 | |||||||||||||||||||||||||
| Same Property real estate revenues | |||||||||||||||||||||||||||||
| Defense/IT Portfolio | |||||||||||||||||||||||||||||
| Fort Meade/BW Corridor | $ | 87,534 | $ | 82,215 | $ | 81,756 | $ | 81,337 | $ | 84,608 | |||||||||||||||||||
| Redstone Arsenal | 20,133 | 19,302 | 19,128 | 18,879 | 16,399 | ||||||||||||||||||||||||
| NoVA Defense/IT | 23,405 | 22,349 | 22,343 | 22,018 | 23,162 | ||||||||||||||||||||||||
| Lackland Air Force Base | 18,354 | 20,639 | 18,554 | 17,475 | 16,411 | ||||||||||||||||||||||||
| Navy Support | 8,992 | 8,621 | 8,727 | 8,258 | 7,960 | ||||||||||||||||||||||||
| Data Center Shells-Consolidated | 11,393 | 11,101 | 10,715 | 10,644 | 10,865 | ||||||||||||||||||||||||
| Total Defense/IT Portfolio | 169,811 | 164,227 | 161,223 | 158,611 | 159,405 | ||||||||||||||||||||||||
| Other | 17,245 | 16,889 | 16,419 | 16,291 | 15,675 | ||||||||||||||||||||||||
| Same Property real estate revenues | $ | 187,056 | $ | 181,116 | $ | 177,642 | $ | 174,902 | $ | 175,080 | |||||||||||||||||||
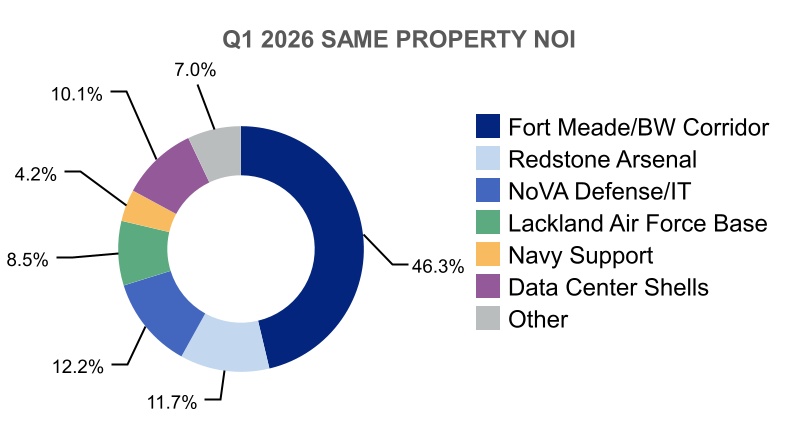
| Same Property NOI from real estate operations (“NOI”) | |||||||||||||||||||||||||||||
| Defense/IT Portfolio | |||||||||||||||||||||||||||||
| Fort Meade/BW Corridor | $ | 51,098 | $ | 52,067 | $ | 53,317 | $ | 54,442 | $ | 52,678 | |||||||||||||||||||
| Redstone Arsenal | 12,982 | 12,472 | 11,962 | 12,707 | 10,110 | ||||||||||||||||||||||||
| NoVA Defense/IT | 13,429 | 13,318 | 13,453 | 13,160 | 13,072 | ||||||||||||||||||||||||
| Lackland Air Force Base | 9,356 | 9,059 | 8,310 | 8,233 | 7,412 | ||||||||||||||||||||||||
| Navy Support | 4,632 | 4,807 | 4,710 | 4,403 | 3,794 | ||||||||||||||||||||||||
| Data Center Shells | |||||||||||||||||||||||||||||
| Consolidated properties | 9,051 | 9,022 | 9,014 | 8,861 | 9,012 | ||||||||||||||||||||||||
| COPT Defense’s share of unconsolidated real estate JVs | 2,056 | 2,083 | 1,864 | 1,870 | 1,889 | ||||||||||||||||||||||||
| Total Defense/IT Portfolio | 102,604 | 102,828 | 102,630 | 103,676 | 97,967 | ||||||||||||||||||||||||
| Other | 7,777 | 8,129 | 8,647 | 8,231 | 9,079 | ||||||||||||||||||||||||
| Same Property NOI (1) | $ | 110,381 | $ | 110,957 | $ | 111,277 | $ | 111,907 | $ | 107,046 | |||||||||||||||||||
17 | 1Q 2026 Supplemental Information Package | | ||||||
| Three Months Ended | |||||||||||||||||||||||||||||
| 3/31/26 | 12/31/25 | 9/30/25 | 6/30/25 | 3/31/25 | |||||||||||||||||||||||||
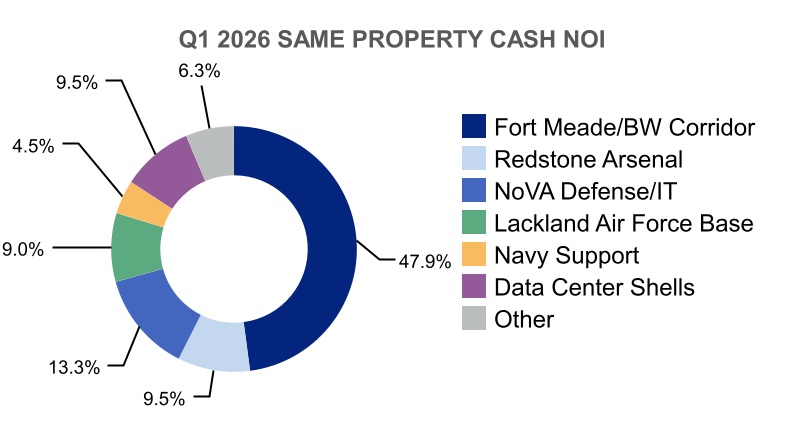
| Same Property cash NOI from real estate operations (“cash NOI”) | |||||||||||||||||||||||||||||
| Defense/IT Portfolio | |||||||||||||||||||||||||||||
| Fort Meade/BW Corridor | $ | 50,917 | $ | 52,766 | $ | 53,057 | $ | 51,642 | $ | 50,104 | |||||||||||||||||||
| Redstone Arsenal | 10,105 | 9,824 | 9,549 | 10,255 | 8,726 | ||||||||||||||||||||||||
| NoVA Defense/IT | 14,085 | 13,945 | 13,669 | 12,717 | 12,263 | ||||||||||||||||||||||||
| Lackland Air Force Base | 9,606 | 8,947 | 8,863 | 8,846 | 8,086 | ||||||||||||||||||||||||
| Navy Support | 4,744 | 4,627 | 4,155 | 4,215 | 3,833 | ||||||||||||||||||||||||
| Data Center Shells | |||||||||||||||||||||||||||||
| Consolidated properties | 8,345 | 8,247 | 8,218 | 7,521 | 7,002 | ||||||||||||||||||||||||
| COPT Defense’s share of unconsolidated real estate JVs | 1,701 | 1,682 | 1,655 | 1,651 | 1,628 | ||||||||||||||||||||||||
| Total Defense/IT Portfolio | 99,503 | 100,038 | 99,166 | 96,847 | 91,642 | ||||||||||||||||||||||||
| Other | 6,750 | 6,628 | 7,698 | 7,672 | 9,150 | ||||||||||||||||||||||||
| Same Property cash NOI (1) | $ | 106,253 | $ | 106,666 | $ | 106,864 | $ | 104,519 | $ | 100,792 | |||||||||||||||||||
| Percentage change in total Same Property cash NOI (1)(2) | 5.4% | ||||||||||||||||||||||||||||
| Percentage change in Defense/IT Portfolio Same Property cash NOI (2) | 8.6% | ||||||||||||||||||||||||||||
18 | 1Q 2026 Supplemental Information Package | | ||||||
| Defense/IT Portfolio | |||||||||||||||||||||||||||||||||||||||||||||||
| Ft Meade/BW Corridor | Redstone Arsenal | NoVA Defense/IT | Lackland Air Force Base | Navy Support | Total Defense/IT Portfolio | Other | Total | ||||||||||||||||||||||||||||||||||||||||
| Renewed Space | |||||||||||||||||||||||||||||||||||||||||||||||
| Leased Square Feet | 134 | 19 | 31 | 953 | 24 | 1,161 | 2 | 1,163 | |||||||||||||||||||||||||||||||||||||||
| Expiring Square Feet | 215 | 19 | 37 | 953 | 53 | 1,277 | 4 | 1,281 | |||||||||||||||||||||||||||||||||||||||
| Vacating Square Feet | 81 | — | 6 | — | 29 | 116 | 2 | 118 | |||||||||||||||||||||||||||||||||||||||
| Retention Rate (% based upon square feet) | 62.3 | % | 100.0 | % | 84.7 | % | 100.0 | % | 45.3 | % | 91.0 | % | 44.0 | % | 90.8 | % | |||||||||||||||||||||||||||||||
| Statistics for Completed Leasing | |||||||||||||||||||||||||||||||||||||||||||||||
| Per Annum Average Committed Cost per Square Foot | $ | 0.73 | $ | 0.66 | $ | 8.26 | $ | 2.14 | $ | 0.52 | $ | 2.08 | $ | — | $ | 2.08 | |||||||||||||||||||||||||||||||
| Weighted Average Lease Term in Years | 3.5 | 1.6 | 6.1 | 4.6 | 5.2 | 4.5 | 1.0 | 4.5 | |||||||||||||||||||||||||||||||||||||||
| Straight-line Rent Per Square Foot | |||||||||||||||||||||||||||||||||||||||||||||||
| Renewal Straight-line Rent | $ | 30.36 | $ | 31.18 | $ | 37.16 | $ | 67.05 | $ | 14.16 | $ | 60.33 | $ | 23.07 | $ | 60.27 | |||||||||||||||||||||||||||||||
| Expiring Straight-line Rent | $ | 29.25 | $ | 30.21 | $ | 31.89 | $ | 59.50 | $ | 16.09 | $ | 53.88 | $ | 21.13 | $ | 53.83 | |||||||||||||||||||||||||||||||
| Change in Straight-line Rent | 3.8 | % | 3.2 | % | 16.6 | % | 12.7 | % | (12.0 | %) | 12.0 | % | 9.2 | % | 12.0 | % | |||||||||||||||||||||||||||||||
| Cash Rent Per Square Foot | |||||||||||||||||||||||||||||||||||||||||||||||
| Renewal Cash Rent | $ | 29.54 | $ | 30.75 | $ | 37.11 | $ | 65.65 | $ | 16.16 | $ | 59.11 | $ | 23.07 | $ | 59.05 | |||||||||||||||||||||||||||||||
| Expiring Cash Rent | $ | 29.76 | $ | 30.72 | $ | 36.04 | $ | 63.01 | $ | 16.65 | $ | 56.95 | $ | 23.07 | $ | 56.90 | |||||||||||||||||||||||||||||||
| Change in Cash Rent | (0.8 | %) | 0.1 | % | 3.0 | % | 4.2 | % | (2.9 | %) | 3.8 | % | — | % | 3.8 | % | |||||||||||||||||||||||||||||||
| Compound Annual Growth Rate | 4.7 | % | 6.6 | % | 4.3 | % | 6.3 | % | 0.2 | % | 6.0 | % | 2.0 | % | 6.0 | % | |||||||||||||||||||||||||||||||
| Average Escalations Per Year | 4.6 | % | 2.5 | % | 2.6 | % | 3.0 | % | 2.5 | % | 3.1 | % | — | % | 3.1 | % | |||||||||||||||||||||||||||||||
| New Leases | |||||||||||||||||||||||||||||||||||||||||||||||
| Investment Space | |||||||||||||||||||||||||||||||||||||||||||||||
| Leased Square Feet | 384 | — | — | — | — | 384 | — | 384 | |||||||||||||||||||||||||||||||||||||||
| Statistics for Completed Leasing | |||||||||||||||||||||||||||||||||||||||||||||||
| Per Annum Average Committed Cost per Square Foot | $ | 4.16 | $ | — | $ | — | $ | — | $ | — | $ | 4.16 | $ | — | $ | 4.16 | |||||||||||||||||||||||||||||||
| Weighted Average Lease Term in Years | 13.4 | — | — | — | — | 13.4 | — | 13.4 | |||||||||||||||||||||||||||||||||||||||
| Straight-line Rent Per Square Foot | $ | 54.76 | $ | — | $ | — | $ | — | $ | — | $ | 54.76 | $ | — | $ | 54.76 | |||||||||||||||||||||||||||||||
| Cash Rent Per Square Foot | $ | 48.05 | $ | — | $ | — | $ | — | $ | — | $ | 48.05 | $ | — | $ | 48.05 | |||||||||||||||||||||||||||||||
| Vacant Space | |||||||||||||||||||||||||||||||||||||||||||||||
| Leased Square Feet | 68 | 5 | — | — | 14 | 87 | 5 | 92 | |||||||||||||||||||||||||||||||||||||||
| Statistics for Completed Leasing | |||||||||||||||||||||||||||||||||||||||||||||||
| Per Annum Average Committed Cost per Square Foot | $ | 4.81 | $ | 3.66 | $ | — | $ | — | $ | 4.58 | $ | 4.71 | $ | 10.93 | $ | 5.03 | |||||||||||||||||||||||||||||||
| Weighted Average Lease Term in Years | 6.8 | 4.3 | — | — | 6.8 | 6.7 | 5.4 | 6.6 | |||||||||||||||||||||||||||||||||||||||
| Straight-line Rent Per Square Foot | $ | 26.58 | $ | 28.60 | $ | — | $ | — | $ | 23.19 | $ | 26.16 | $ | 28.36 | $ | 26.28 | |||||||||||||||||||||||||||||||
| Cash Rent Per Square Foot | $ | 27.89 | $ | 27.45 | $ | — | $ | — | $ | 23.00 | $ | 27.10 | $ | 28.75 | $ | 27.18 | |||||||||||||||||||||||||||||||
| Total Square Feet Leased | 586 | 24 | 31 | 953 | 38 | 1,632 | 7 | 1,639 | |||||||||||||||||||||||||||||||||||||||
| Average Escalations Per Year | 2.8 | % | 2.5 | % | 2.6 | % | 3.0 | % | 2.6 | % | 2.9 | % | 2.8 | % | 2.9 | % | |||||||||||||||||||||||||||||||
19 | 1Q 2026 Supplemental Information Package | | ||||||
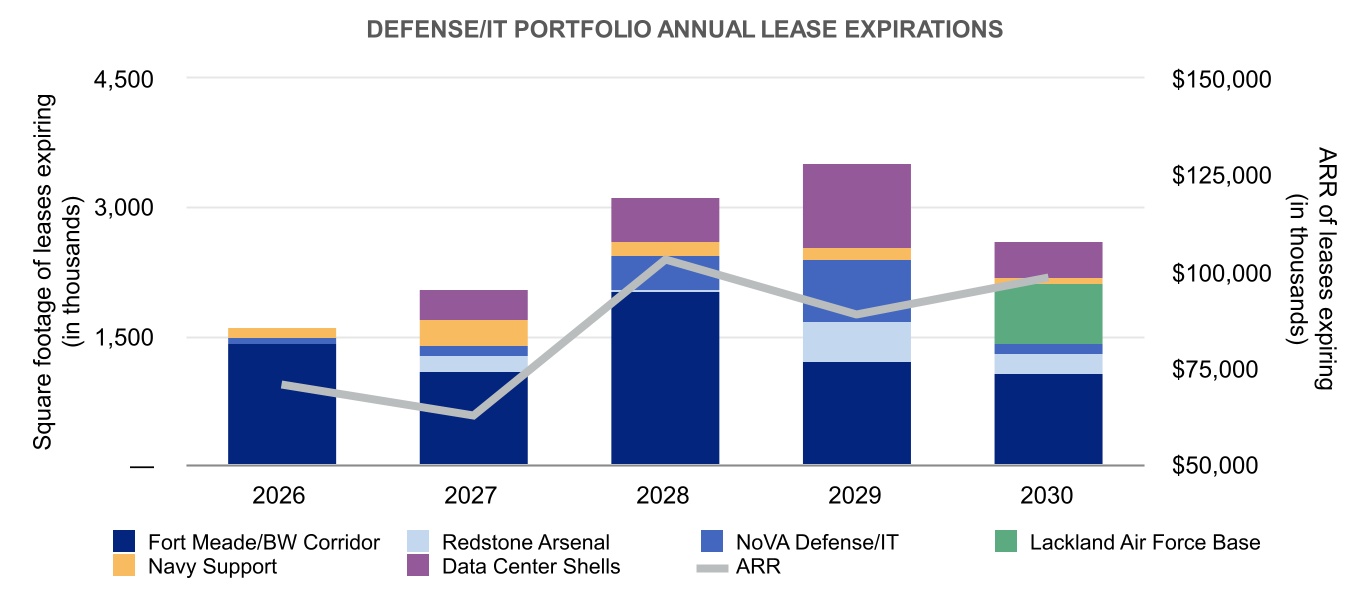
| Segment of Lease and Year of Expiration (2) | Square Footage of Leases Expiring | Annualized Rental Revenue of Expiring Leases (3) | % of Defense/IT Annualized Rental Revenue Expiring (3) | Annualized Rental Revenue of Expiring Leases per Occupied Sq. Foot (3) | ||||||||||||||||||||||
| Defense/IT Portfolio | ||||||||||||||||||||||||||
| Fort Meade/BW Corridor | 1,427 | $ | 64,590 | 9.7 | % | $ | 45.20 | |||||||||||||||||||
| Redstone Arsenal | 5 | 173 | — | % | 32.33 | |||||||||||||||||||||
| NoVA Defense/IT | 63 | 2,002 | 0.3 | % | 31.97 | |||||||||||||||||||||
| Navy Support | 121 | 3,860 | 0.6 | % | 31.83 | |||||||||||||||||||||
| 2026 | 1,616 | 70,625 | 10.6 | % | 43.64 | |||||||||||||||||||||
| Fort Meade/BW Corridor | 1,096 | 42,600 | 6.4 | % | 38.85 | |||||||||||||||||||||
| Redstone Arsenal | 192 | 5,711 | 0.9 | % | 29.79 | |||||||||||||||||||||
| NoVA Defense/IT | 114 | 3,997 | 0.6 | % | 35.16 | |||||||||||||||||||||
| Navy Support | 297 | 9,768 | 1.5 | % | 32.85 | |||||||||||||||||||||
| Data Center Shells-Unconsolidated JV Properties | 364 | 588 | 0.1 | % | 16.13 | |||||||||||||||||||||
| 2027 | 2,063 | 62,664 | 9.4 | % | 36.10 | |||||||||||||||||||||
| Fort Meade/BW Corridor | 2,030 | 79,026 | 11.8 | % | 38.88 | |||||||||||||||||||||
| Redstone Arsenal | 16 | 460 | 0.1 | % | 29.67 | |||||||||||||||||||||
| NoVA Defense/IT | 410 | 18,003 | 2.7 | % | 43.91 | |||||||||||||||||||||
| Navy Support | 146 | 4,548 | 0.7 | % | 31.13 | |||||||||||||||||||||
| Data Center Shells-Unconsolidated JV Properties | 515 | 946 | 0.1 | % | 18.36 | |||||||||||||||||||||
| 2028 | 3,117 | 102,983 | 15.4 | % | 38.78 | |||||||||||||||||||||
| Fort Meade/BW Corridor | 1,220 | 42,743 | 6.4 | % | 34.99 | |||||||||||||||||||||
| Redstone Arsenal | 464 | 10,317 | 1.5 | % | 22.15 | |||||||||||||||||||||
| NoVA Defense/IT | 728 | 29,253 | 4.4 | % | 40.19 | |||||||||||||||||||||
| Navy Support | 126 | 3,912 | 0.6 | % | 31.01 | |||||||||||||||||||||
| Data Center Shells-Unconsolidated JV Properties | 992 | 2,415 | 0.4 | % | 24.35 | |||||||||||||||||||||
| 2029 | 3,530 | 88,640 | 13.3 | % | 33.57 | |||||||||||||||||||||
| Fort Meade/BW Corridor | 1,066 | 35,927 | 5.4 | % | 33.61 | |||||||||||||||||||||
| Redstone Arsenal | 246 | 6,967 | 1.0 | % | 28.34 | |||||||||||||||||||||
| NoVA Defense/IT | 116 | 4,571 | 0.7 | % | 39.34 | |||||||||||||||||||||
| Lackland Air Force Base | 703 | 48,358 | 7.2 | % | 68.82 | |||||||||||||||||||||
| Navy Support | 52 | 1,518 | 0.2 | % | 29.17 | |||||||||||||||||||||
| Data Center Shells-Unconsolidated JV Properties | 432 | 884 | 0.1 | % | 20.45 | |||||||||||||||||||||
| 2030 | 2,615 | 98,225 | 14.7 | % | 44.08 | |||||||||||||||||||||
| Thereafter | ||||||||||||||||||||||||||
| Consolidated Properties | 7,221 | 240,641 | 36.1 | % | 32.57 | |||||||||||||||||||||
| Unconsolidated JV Properties | 1,992 | 3,666 | 0.5 | % | 18.41 | |||||||||||||||||||||
| Total Defense/IT Portfolio | 22,154 | $ | 667,444 | 100.0 | % | $ | 36.18 | |||||||||||||||||||
20 | 1Q 2026 Supplemental Information Package | | ||||||
| Segment of Lease and Year of Expiration (2) | Square Footage of Leases Expiring | Annualized Rental Revenue of Expiring Leases (3) | % of Total Annualized Rental Revenue Expiring (3) | Annualized Rental Revenue of Expiring Leases per Occupied Sq. Foot (3) | ||||||||||||||||||||||
| Total Defense/IT Portfolio | 22,154 | $ | 667,444 | 90.0 | % | $ | 36.18 | |||||||||||||||||||
| Other | ||||||||||||||||||||||||||
| 2026 | 47 | 1,890 | 0.3 | % | 39.14 | |||||||||||||||||||||
| 2027 | 98 | 4,454 | 0.6 | % | 45.02 | |||||||||||||||||||||
| 2028 | 264 | 17,354 | 2.3 | % | 38.17 | |||||||||||||||||||||
| 2029 | 157 | 6,836 | 0.9 | % | 43.48 | |||||||||||||||||||||
| 2030 | 33 | 1,254 | 0.2 | % | 38.27 | |||||||||||||||||||||
| Thereafter | 985 | 42,546 | 5.7 | % | 43.11 | |||||||||||||||||||||
| Total Other | 1,584 | 74,334 | 10.0 | % | 42.22 | |||||||||||||||||||||
| Total Portfolio | 23,738 | $ | 741,778 | 100.0 | % | $ | 36.66 | |||||||||||||||||||
| Consolidated Portfolio | 19,443 | $ | 733,280 | |||||||||||||||||||||||
| Unconsolidated JV Properties | 4,295 | $ | 8,498 | |||||||||||||||||||||||
21 | 1Q 2026 Supplemental Information Package | | ||||||
| Segment of Lease and Quarter of Expiration (2) | Square Footage of Leases Expiring | Annualized Rental Revenue of Expiring Leases (3) | % of Defense/IT Annualized Rental Revenue Expiring (3) | Annualized Rental Revenue of Expiring Leases per Occupied Sq. Foot (3) | ||||||||||||||||||||||
| Defense/IT Portfolio | ||||||||||||||||||||||||||
| Fort Meade/BW Corridor | 1,129 | $ | 50,007 | 7.6 | % | $ | 44.23 | |||||||||||||||||||
| NoVA Defense/IT | 29 | 1,077 | 0.2 | % | 37.61 | |||||||||||||||||||||
| Navy Support | 52 | 1,474 | 0.2 | % | 28.12 | |||||||||||||||||||||
| Q2 2026 | 1,210 | 52,558 | 8.0 | % | 43.38 | |||||||||||||||||||||
| Fort Meade/BW Corridor | 86 | 3,473 | 0.5 | % | 40.10 | |||||||||||||||||||||
| Redstone Arsenal | 4 | 131 | — | % | 33.69 | |||||||||||||||||||||
| NoVA Defense/IT | 28 | 925 | 0.1 | % | 32.64 | |||||||||||||||||||||
| Navy Support | 28 | 922 | 0.1 | % | 33.05 | |||||||||||||||||||||
| Q3 2026 | 146 | 5,451 | 0.7 | % | 37.13 | |||||||||||||||||||||
| Fort Meade/BW Corridor | 212 | 11,110 | 1.7 | % | 52.44 | |||||||||||||||||||||
| Redstone Arsenal | 1 | 42 | — | % | 28.70 | |||||||||||||||||||||
| NoVA Defense/IT | 6 | — | — | % | — | |||||||||||||||||||||
| Navy Support | 41 | 1,464 | 0.2 | % | 35.74 | |||||||||||||||||||||
| Q4 2026 | 260 | 12,616 | 1.9 | % | 48.53 | |||||||||||||||||||||
| 1,616 | $ | 70,625 | 10.7 | % | $ | 43.64 | ||||||||||||||||||||
22 | 1Q 2026 Supplemental Information Package | | ||||||
| Tenant | Total Annualized Rental Revenue (2) | % of Total Annualized Rental Revenue (2) | Occupied Square Feet | Weighted Average Remaining Lease Term (3) | ||||||||||||||||||||||
| United States Government | (4) | $ | 262,407 | 35.4 | % | 5,683 | 3.8 | |||||||||||||||||||
| Fortune 100 Company | 81,076 | 11.0 | % | 6,807 | 7.3 | |||||||||||||||||||||
| General Dynamics Corporation | 33,684 | 4.6 | % | 657 | 2.9 | |||||||||||||||||||||
| Peraton Corp. | 19,067 | 2.6 | % | 488 | 5.2 | |||||||||||||||||||||
| The Boeing Company | 15,815 | 2.1 | % | 452 | 1.9 | |||||||||||||||||||||
| Northrop Grumman Corporation | 15,780 | 2.1 | % | 519 | 5.5 | |||||||||||||||||||||
| CACI International Inc | 14,533 | 2.0 | % | 342 | 2.9 | |||||||||||||||||||||
| Fortune 100 Company | 12,258 | 1.7 | % | 183 | 8.5 | |||||||||||||||||||||
| Booz Allen Hamilton, Inc. | 11,399 | 1.5 | % | 266 | 1.5 | |||||||||||||||||||||
| Morrison & Foerster, LLP | 10,122 | 1.4 | % | 102 | 11.0 | |||||||||||||||||||||
| KBR, Inc. | 8,163 | 1.1 | % | 284 | 7.9 | |||||||||||||||||||||
| CareFirst, Inc. | 8,046 | 1.1 | % | 216 | 10.6 | |||||||||||||||||||||
| Amentum Holdings, Inc. | 7,712 | 1.0 | % | 202 | 3.6 | |||||||||||||||||||||
| Yulista Holding, LLC | 7,642 | 1.0 | % | 368 | 3.7 | |||||||||||||||||||||
| Mantech International Corp. | 7,069 | 1.0 | % | 208 | 2.6 | |||||||||||||||||||||
| AT&T Corporation | 7,022 | 1.0 | % | 314 | 3.6 | |||||||||||||||||||||
| University System of Maryland | 6,678 | 0.9 | % | 176 | 3.8 | |||||||||||||||||||||
| Wells Fargo & Company | 6,207 | 0.8 | % | 138 | 2.8 | |||||||||||||||||||||
| Lockheed Martin Corporation | 6,070 | 0.8 | % | 194 | 4.3 | |||||||||||||||||||||
| The MITRE Corporation | 4,946 | 0.7 | % | 139 | 4.0 | |||||||||||||||||||||
| Subtotal Top 20 Tenants | 545,696 | 73.8 | % | 17,738 | 5.3 | |||||||||||||||||||||
| All remaining tenants | 196,082 | 26.2 | % | 6,000 | 4.9 | |||||||||||||||||||||
| Total / Weighted Average | $ | 741,778 | 100.0 | % | 23,738 | 5.2 | ||||||||||||||||||||
23 | 1Q 2026 Supplemental Information Package | | ||||||
| Total Rentable Square Feet | % Leased as of 3/31/26 | as of 3/31/26 (2) | Actual or Anticipated Shell Completion Date | Anticipated Operational Date (3) | |||||||||||||||||||||||||
| Anticipated Total Cost | Cost to Date | Cost to Date Placed in Service | |||||||||||||||||||||||||||
| Property and Segment/Sub-Segment | Location | ||||||||||||||||||||||||||||
| Defense/IT Portfolio | |||||||||||||||||||||||||||||
| Fort Meade/BW Corridor | |||||||||||||||||||||||||||||
| 400 National Business Parkway (4) | Annapolis Junction, MD | 148 | 100% | $ | 68,323 | $ | 53,717 | $ | 13,752 | 2Q 25 | 2Q 26 | ||||||||||||||||||
| 4400 River Road | College Park, MD | 110 | 100% | 66,266 | 6,917 | — | 2Q 27 | 3Q 27 | |||||||||||||||||||||
| 620 Guardian Way | Annapolis Junction, MD | 236 | 100% | 145,970 | 24,232 | — | 3Q 28 | 3Q 28 | |||||||||||||||||||||
| Fort Meade/BW Corridor Subtotal / Average | 494 | 100% | 280,559 | 84,866 | 13,752 | ||||||||||||||||||||||||
| Redstone Arsenal | |||||||||||||||||||||||||||||
| 7700 Advanced Gateway | Huntsville, AL | 101 | 100% | 32,760 | 7,870 | — | 1Q 27 | 1Q 27 | |||||||||||||||||||||
| 8500 Advanced Gateway | Huntsville, AL | 155 | 20% | 52,317 | 32,323 | — | 2Q 26 | 2Q 27 | |||||||||||||||||||||
| 410 Goss Road | Huntsville, AL | 151 | 0% | 55,003 | 10,204 | — | 3Q 27 | 3Q 28 | |||||||||||||||||||||
| Redstone Arsenal Subtotal / Average | 407 | 33% | 140,080 | 50,397 | — | ||||||||||||||||||||||||
| Lackland Air Force Base | |||||||||||||||||||||||||||||
| Project EL 2 | San Antonio, TX | 132 | 100% | 87,600 | 3,592 | — | 4Q 27 | 4Q 27 | |||||||||||||||||||||
| Total Defense/IT Portfolio Under Development | 1,033 | 73% | $ | 508,239 | $ | 138,855 | $ | 13,752 | |||||||||||||||||||||
24 | 1Q 2026 Supplemental Information Package | | ||||||
| Location | Acres | Estimated Developable Square Feet | Carrying Amount | ||||||||||||||
| Defense/IT Portfolio land owned/controlled for future development | |||||||||||||||||
| Fort Meade/BW Corridor | |||||||||||||||||
| National Business Park (Annapolis Junction, MD) | 136 | 1,247 | |||||||||||||||
| Howard County, MD | 19 | 290 | |||||||||||||||
| Other | 123 | 1,228 | |||||||||||||||
| Total Fort Meade/BW Corridor | 278 | 2,765 | |||||||||||||||
| Redstone Arsenal (2) | 271 | 2,949 | |||||||||||||||
| NoVA Defense/IT | 29 | 1,739 | |||||||||||||||
| Navy Support | 36 | 57 | |||||||||||||||
| Data Center Shells | 365 | 3,300 | |||||||||||||||
| Total Defense/IT Portfolio land owned/controlled for future development | 979 | 10,810 | $ | 179,448 | |||||||||||||
| Other land owned/controlled | 47 | 1,478 | 8,036 | ||||||||||||||
| Land held, net | 1,026 | 12,288 | $ | 187,484 | |||||||||||||
25 | 1Q 2026 Supplemental Information Package | | ||||||
| Wtd. Avg. Maturity (Years) (1) | Stated Rate | Effective Rate (2)(3) | Amount Outstanding at 3/31/26 | |||||||||||||||||||||||
| Debt | ||||||||||||||||||||||||||
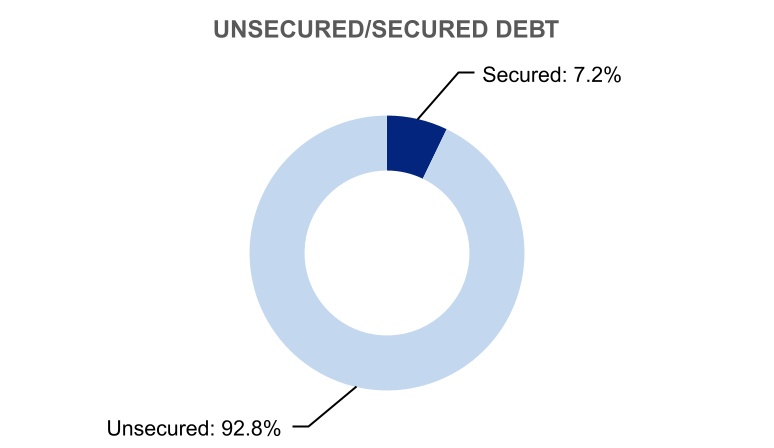
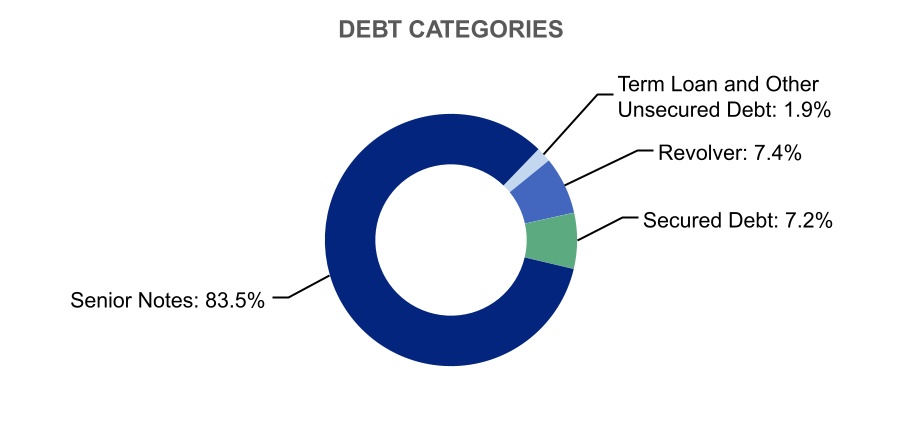
| Secured debt | 3.5 | 4.80 | % | 4.69 | % | $ | 183,893 | |||||||||||||||||||
| Unsecured debt | 4.5 | 3.49 | % | 3.70 | % | 2,385,011 | ||||||||||||||||||||
| Total Consolidated Debt | 4.5 | 3.58 | % | 3.77 | % | $ | 2,568,904 | |||||||||||||||||||
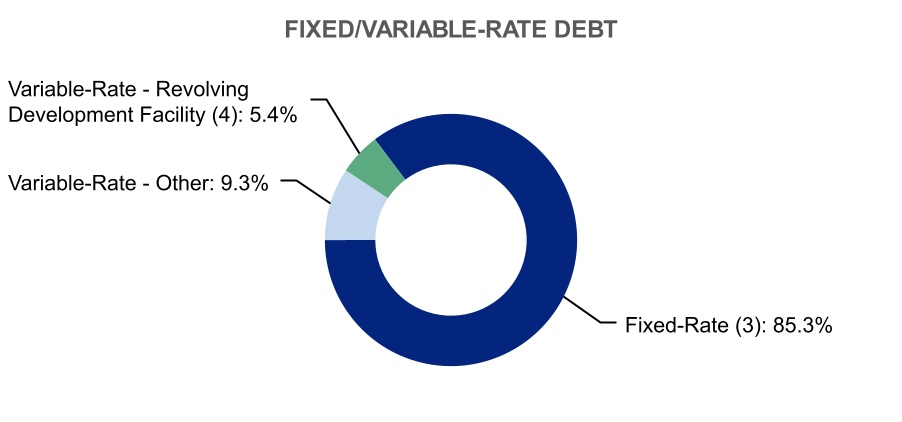
| Fixed-rate debt (3) | 4.5 | 3.37 | % | 3.60 | % | $ | 2,190,904 | |||||||||||||||||||
| Variable-rate debt (3) | 4.1 | 4.74 | % | 4.73 | % | 378,000 | ||||||||||||||||||||
| Total Consolidated Debt | $ | 2,568,904 | ||||||||||||||||||||||||
| Common Equity | ||||||||||||||||||||||||||
| Common Shares | 113,378 | |||||||||||||||||||||||||
| Common Units (4) | 2,434 | |||||||||||||||||||||||||
| Total Common Shares and Units | 115,812 | |||||||||||||||||||||||||
Closing Common Share Price on 3/31/26 | $ | 30.60 | ||||||||||||||||||||||||
| Equity Market Capitalization (5) | $ | 3,543,847 | ||||||||||||||||||||||||
| Total Market Capitalization (5) | $ | 6,112,751 | ||||||||||||||||||||||||
| Investment Grade Ratings & Outlook | Latest Report | |||||||||||||||||||
| Fitch | BBB- | Stable | 2/25/26 | |||||||||||||||||
| Moody’s | Baa2 | Stable | 3/12/26 | |||||||||||||||||
| S&P | BBB- | Stable | 4/11/25 | |||||||||||||||||
26 | 1Q 2026 Supplemental Information Package | | ||||||
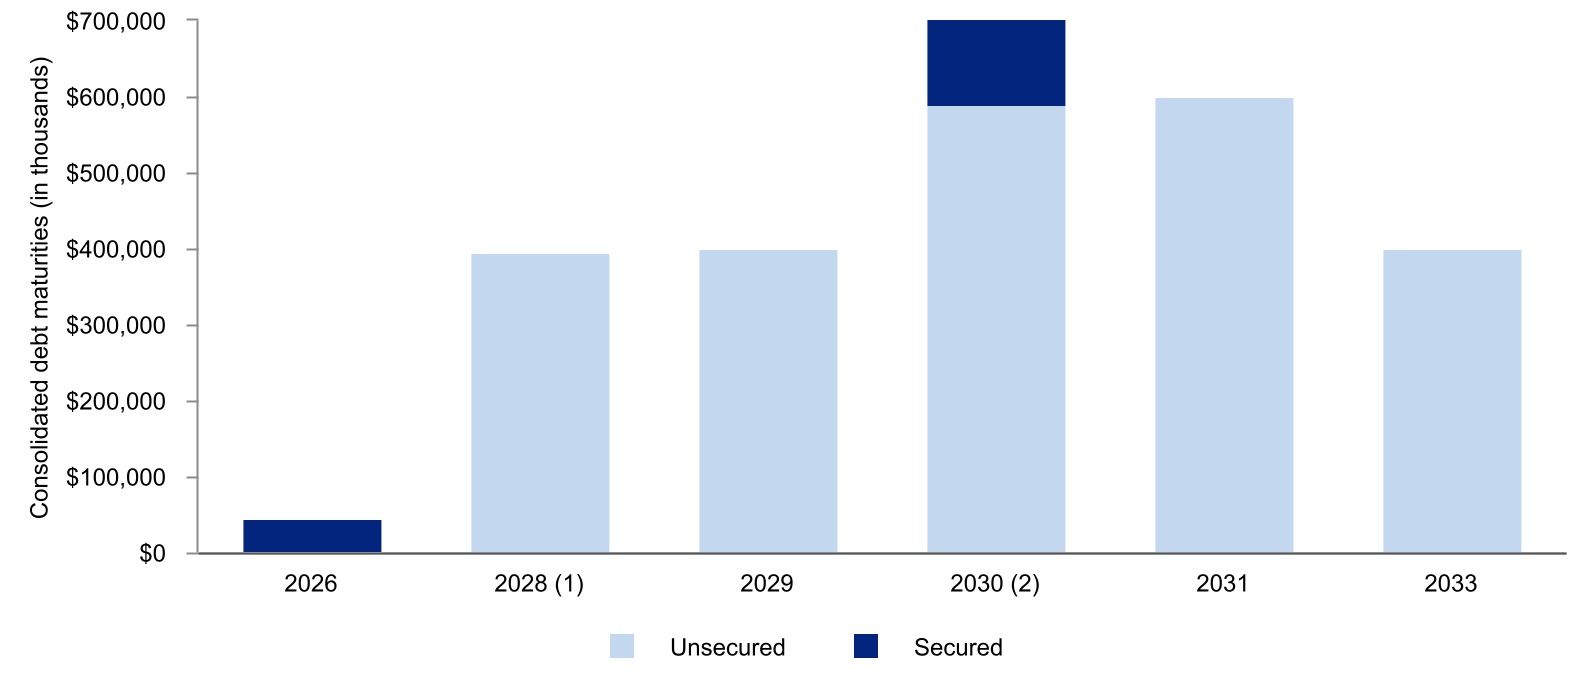
| Unsecured Debt | Stated Rate | Amount Outstanding | Maturity Date | Secured Debt | Stated Rate | Amount Outstanding | Balloon Payment Due Upon Maturity | Maturity Date | |||||||||||||||||||||||||||||||||
| Revolving Credit Facility | SOFR+0.85% | $ | 190,000 | Oct-29 | (1)(2) | Revolving Development Facility | SOFR+1.35% | $ | 138,000 | $ | 138,000 | Oct-29 | (2)(3) | ||||||||||||||||||||||||||||
| Senior Unsecured Notes | M Square | ||||||||||||||||||||||||||||||||||||||||
| 5.25% due 2028 | 5.25% | 345,000 | Sep-28 | (4) | 5825 & 5850 University Research Court (5) | 3.82% | 35,793 | $ | 35,603 | Jun-26 | |||||||||||||||||||||||||||||||
| 2.00% due 2029 | 2.00% | 400,000 | Jan-29 | ||||||||||||||||||||||||||||||||||||||
| 4.50% due 2030 | 4.50% | 400,000 | Oct-30 | 5801 University Research Court (2)(5) | SOFR +0.10%+1.45% | 10,100 | $ | 10,020 | Aug-26 | ||||||||||||||||||||||||||||||||
| 2.75% due 2031 | 2.75% | 600,000 | Apr-31 | ||||||||||||||||||||||||||||||||||||||
| 2.90% due 2033 | 2.90% | 400,000 | Dec-33 | Total Secured Debt | 4.80% | $ | 183,893 | ||||||||||||||||||||||||||||||||||
| Subtotal - Senior Unsecured Notes | 3.37% | 2,145,000 | |||||||||||||||||||||||||||||||||||||||
| Unsecured Bank Term Loan | SOFR+1.05% | 50,000 | Jan-27 | (2)(6) | |||||||||||||||||||||||||||||||||||||
| Other Unsecured Debt | 0.00% | 11 | May-26 | ||||||||||||||||||||||||||||||||||||||
| Total Unsecured Debt | 3.49% | $ | 2,385,011 | ||||||||||||||||||||||||||||||||||||||
| Debt Summary | |||||||||||||||||||||||||||||||||||||||||
| Total Unsecured Debt | 3.49% | $ | 2,385,011 | ||||||||||||||||||||||||||||||||||||||
| Total Secured Debt | 4.80% | 183,893 | |||||||||||||||||||||||||||||||||||||||
| Consolidated Debt | 3.58% | $ | 2,568,904 | ||||||||||||||||||||||||||||||||||||||
| Debt per balance sheet | $ | 2,546,958 | |||||||||||||||||||||||||||||||||||||||
| Net discounts and deferred financing costs | 21,946 | ||||||||||||||||||||||||||||||||||||||||
| Consolidated Debt | 2,568,904 | ||||||||||||||||||||||||||||||||||||||||
| COPT Defense’s share of unconsolidated JV gross debt (7) | 75,250 | ||||||||||||||||||||||||||||||||||||||||
| Gross debt | $ | 2,644,154 | |||||||||||||||||||||||||||||||||||||||
27 | 1Q 2026 Supplemental Information Package | | ||||||
28 | 1Q 2026 Supplemental Information Package | | ||||||
As of and for Three Months Ended 3/31/26 | As of and for Three Months Ended 3/31/26 | |||||||||||||||||||||||||||||||
| Senior Note Covenants (1) | Required | Line of Credit & Term Loan Covenants (1) | Required | |||||||||||||||||||||||||||||
| Total Debt / Total Assets | < 60% | 41.3% | Total Debt / Total Assets | < 60% | 37.2% | |||||||||||||||||||||||||||
| Secured Debt / Total Assets | < 40% | 3.0% | Secured Debt / Total Assets | < 40% | 3.4% | |||||||||||||||||||||||||||
| Debt Service Coverage | > 1.5x | 4.5x | Adjusted EBITDA / Fixed Charges | > 1.5x | 4.3x | |||||||||||||||||||||||||||
| Unencumbered Assets / Unsecured Debt | > 150% | 242.5% | Unsecured Debt / Unencumbered Assets | < 60% | 37.6% | |||||||||||||||||||||||||||
| Unencumbered Adjusted NOI / Unsecured Interest Expense | > 1.75x | 4.3x | ||||||||||||||||||||||||||||||
| Debt Ratios | Page Refer. | Unencumbered Portfolio Analysis | ||||||||||||||||||||||||||||||
| GAAP | NOI from unencumbered real estate operations | $ | 107,303 | |||||||||||||||||||||||||||||
| Debt per balance sheet | $ | 2,546,958 | % of total NOI from real estate operations | 93 | % | |||||||||||||||||||||||||||
| Total assets | $ | 4,458,909 | Adjusted EBITDA from unencumbered real estate operations | $ | 99,918 | |||||||||||||||||||||||||||
| Debt to assets | 57.1 | % | % of total adjusted EBITDA from real estate operations | 93 | % | |||||||||||||||||||||||||||
| Net income | $ | 40,139 | Unencumbered adjusted book | $ | 5,958,980 | |||||||||||||||||||||||||||
| Debt to net income ratio (2) | 15.9 | x | % of total adjusted book | 93 | % | |||||||||||||||||||||||||||
| Interest expense | $ | 23,996 | ||||||||||||||||||||||||||||||
| Net income to interest expense ratio (2) | 1.7 | x | ||||||||||||||||||||||||||||||
| Non-GAAP | ||||||||||||||||||||||||||||||||
| Net debt | $ | 2,614,344 | ||||||||||||||||||||||||||||||
| Adjusted book | $ | 6,432,520 | ||||||||||||||||||||||||||||||
| Net debt to adjusted book | 40.6 | % | ||||||||||||||||||||||||||||||
| Net debt adjusted for fully-leased investment properties | $ | 2,531,768 | ||||||||||||||||||||||||||||||
| In-place adjusted EBITDA | $ | 107,918 | ||||||||||||||||||||||||||||||
| Net debt to in-place adjusted EBITDA ratio | 6.1 | x | ||||||||||||||||||||||||||||||
| Net debt adjusted for fully-leased investment properties to in-place adjusted EBITDA ratio | 5.9 | x | ||||||||||||||||||||||||||||||
| Denominator for debt service coverage | $ | 23,291 | ||||||||||||||||||||||||||||||
| Denominator for fixed charge coverage | $ | 24,970 | ||||||||||||||||||||||||||||||
| Adjusted EBITDA | $ | 107,832 | ||||||||||||||||||||||||||||||
| Adjusted EBITDA debt service coverage ratio | 4.6 | x | ||||||||||||||||||||||||||||||
| Adjusted EBITDA fixed charge coverage ratio | 4.3 | x | ||||||||||||||||||||||||||||||
29 | 1Q 2026 Supplemental Information Package | | ||||||
| NOI from Real Estate Operations (1) | Venture Level Debt Outstanding (3) | COPT Defense Nominal Ownership % | ||||||||||||||||||||||||
| Operating Properties | Operational Square Feet | % Occupied | % Leased | Three Months Ended | Total Assets (2) | |||||||||||||||||||||
| Suburban MD | ||||||||||||||||||||||||||
M Square Associates, LLC (4 properties) | 414 | 98.4% | 98.4% | $ | 1,643 | $ | 91,479 | $ | 45,893 | 50% | ||||||||||||||||
| Huntsville, AL | ||||||||||||||||||||||||||
LW Redstone Company, LLC (24 properties) | 2,388 | 96.9% | 98.5% | 12,783 | 634,542 | — | 85% | (4) | ||||||||||||||||||
| Washington, DC | ||||||||||||||||||||||||||
Stevens Place (1 property) | 188 | 92.2% | 93.7% | 2,504 | 141,689 | — | 95% | |||||||||||||||||||
| Total / Average | 2,990 | 96.8% | 98.1% | $ | 16,930 | $ | 867,710 | $ | 45,893 | |||||||||||||||||
| Non-Operating Properties | Estimated Developable Square Feet | Total Assets (2) | Venture Level Debt Outstanding | COPT Defense Nominal Ownership % | ||||||||||||||||
| Suburban MD | ||||||||||||||||||||
| M Square Research Park | 348 | $ | 14,772 | $ | — | 50% | ||||||||||||||
| Huntsville, AL | ||||||||||||||||||||
| Redstone Gateway (5) | 3,356 | 142,206 | — | 85% | (3) | |||||||||||||||
| Total | 3,704 | $ | 156,978 | $ | — | |||||||||||||||
30 | 1Q 2026 Supplemental Information Package | | ||||||
| Joint venture information | ||||||||||||||
COPT Defense ownership % | 10 | % | ||||||||||||
COPT Defense’s investment | $ | 11,805 | (2) | |||||||||||
| # of Properties | 24 | |||||||||||||
| Square Feet | 4,295 | |||||||||||||
| % Occupied | 100 | % | ||||||||||||
| COPT Defense’s share of ARR | $ | 8,498 | ||||||||||||
| Balance sheet information | Total | COPT Defense’s Share (3) | ||||||||||||
| Operating properties, net | $ | 906,881 | $ | 90,688 | ||||||||||
| Total assets | $ | 1,007,060 | $ | 100,706 | ||||||||||
| Debt (4) | $ | 747,667 | $ | 74,767 | ||||||||||
| Total liabilities | $ | 823,534 | $ | 82,353 | ||||||||||
| Three Months Ended | ||||||||||||||
| Operating information | Total | COPT Defense’s Share (3) | ||||||||||||
| Revenue | $ | 26,173 | $ | 2,617 | ||||||||||
| Operating expenses | (5,619) | (561) | ||||||||||||
| NOI from real estate operations and EBITDAre (5) | 20,554 | 2,056 | ||||||||||||
| Interest expense | (10,537) | (1,054) | ||||||||||||
| Depreciation and amortization | (7,887) | (742) | ||||||||||||
| Gain on sale of real estate (6) | 11,463 | 1,146 | ||||||||||||
| Net income | $ | 13,593 | $ | 1,406 | ||||||||||
| NOI from real estate operations (per above) (5) | $ | 20,554 | $ | 2,056 | ||||||||||
| Straight line rent adjustments | (1,743) | (174) | ||||||||||||
| Amortization of acquired above- and below-market rents | (1,804) | (181) | ||||||||||||
| Cash NOI from real estate operations (5) | $ | 17,007 | $ | 1,701 | ||||||||||
31 | 1Q 2026 Supplemental Information Package | | ||||||
| Three Months Ended | |||||||||||||||||||||||||||||
| 3/31/26 | 12/31/25 | 9/30/25 | 6/30/25 | 3/31/25 | |||||||||||||||||||||||||
| Net income | $ | 40,139 | $ | 39,396 | $ | 43,744 | $ | 40,166 | $ | 36,228 | |||||||||||||||||||
| Construction contract and other service revenues | (6,041) | (10,872) | (8,485) | (12,458) | (10,259) | ||||||||||||||||||||||||
| Depreciation and other amortization associated with real estate operations | 42,685 | 42,263 | 40,631 | 39,573 | 39,359 | ||||||||||||||||||||||||
| Construction contract and other service expenses | 5,552 | 10,432 | 7,952 | 11,873 | 9,705 | ||||||||||||||||||||||||
| General and administrative expenses | 8,456 | 7,943 | 8,483 | 8,202 | 8,148 | ||||||||||||||||||||||||
| Leasing expenses | 2,994 | 2,896 | 2,449 | 2,613 | 2,999 | ||||||||||||||||||||||||
| Business development expenses and land carry costs | 1,199 | 904 | 1,098 | 1,096 | 1,009 | ||||||||||||||||||||||||
| Interest expense | 23,996 | 24,324 | 20,894 | 20,938 | 20,504 | ||||||||||||||||||||||||
| Interest and other income, net | (3,955) | (5,301) | (2,591) | (1,223) | (1,568) | ||||||||||||||||||||||||
| Gain on sales of real estate | (582) | (32) | (3,018) | — | (300) | ||||||||||||||||||||||||
| Loss on early extinguishment of debt | — | 66 | — | — | — | ||||||||||||||||||||||||
| Equity in income of unconsolidated entities | (1,406) | (265) | (1,815) | (355) | (371) | ||||||||||||||||||||||||
| Unconsolidated real estate JVs NOI allocable to COPT Defense included in equity in income of unconsolidated entities (1) | 2,056 | 2,083 | 1,864 | 1,870 | 1,889 | ||||||||||||||||||||||||
| Income tax expense | 124 | 115 | 612 | 117 | 103 | ||||||||||||||||||||||||
| NOI from real estate operations | 115,217 | 113,952 | 111,818 | 112,412 | 107,446 | ||||||||||||||||||||||||
| Straight line rent adjustments and lease incentive amortization | (1,028) | 3,968 | 5,551 | (1,379) | (1,875) | ||||||||||||||||||||||||
| Amortization of acquired above- and below-market rents | 60 | (384) | 42 | 65 | 64 | ||||||||||||||||||||||||
| Amortization of intangibles and other assets to property operating expenses | — | — | — | — | 98 | ||||||||||||||||||||||||
| Lease termination fees, net | (1,212) | (859) | (1,190) | (729) | (834) | ||||||||||||||||||||||||
| Tenant funded landlord assets and lease incentives | (4,378) | (8,569) | (8,888) | (5,223) | (3,413) | ||||||||||||||||||||||||
| Cash NOI adjustments in unconsolidated real estate JVs | (355) | (401) | (209) | (219) | (261) | ||||||||||||||||||||||||
| Cash NOI from real estate operations | $ | 108,304 | $ | 107,707 | $ | 107,124 | $ | 104,927 | $ | 101,225 | |||||||||||||||||||
| NOI from real estate operations (from above) | $ | 115,217 | $ | 113,952 | $ | 111,818 | $ | 112,412 | $ | 107,446 | |||||||||||||||||||
| Non-Same Property NOI from real estate operations | (4,836) | (2,995) | (541) | (505) | (400) | ||||||||||||||||||||||||
| Same Property NOI from real estate operations | 110,381 | 110,957 | 111,277 | 111,907 | 107,046 | ||||||||||||||||||||||||
| Straight line rent adjustments and lease incentive amortization | 677 | 5,909 | 2,185 | (1,282) | (1,811) | ||||||||||||||||||||||||
| Amortization of acquired above- and below-market rents | 80 | (371) | 41 | 65 | 64 | ||||||||||||||||||||||||
| Lease termination fees, net | (1,212) | (859) | (1,191) | (728) | (834) | ||||||||||||||||||||||||
| Tenant funded landlord assets and lease incentives | (3,318) | (8,569) | (5,239) | (5,223) | (3,413) | ||||||||||||||||||||||||
| Cash NOI adjustments in unconsolidated real estate JVs | (355) | (401) | (209) | (220) | (260) | ||||||||||||||||||||||||
| Same Property Cash NOI from real estate operations | $ | 106,253 | $ | 106,666 | $ | 106,864 | $ | 104,519 | $ | 100,792 | |||||||||||||||||||
32 | 1Q 2026 Supplemental Information Package | | ||||||
| Three Months Ended | |||||||||||||||||||||||||||||
| 3/31/26 | 12/31/25 | 9/30/25 | 6/30/25 | 3/31/25 | |||||||||||||||||||||||||
| Real estate revenues | |||||||||||||||||||||||||||||
| Lease revenue | |||||||||||||||||||||||||||||
| Fixed contractual payments | $ | 142,467 | $ | 139,318 | $ | 135,957 | $ | 136,334 | $ | 131,691 | |||||||||||||||||||
| Variable lease payments (1) | 50,504 | 45,684 | 42,315 | 39,264 | 43,617 | ||||||||||||||||||||||||
| Lease revenue | 192,971 | 185,002 | 178,272 | 175,598 | 175,308 | ||||||||||||||||||||||||
| Other property revenue | 1,625 | 1,483 | 2,038 | 1,859 | 2,289 | ||||||||||||||||||||||||
| Real estate revenues | $ | 194,596 | $ | 186,485 | $ | 180,310 | $ | 177,457 | $ | 177,597 | |||||||||||||||||||
| Provision for credit losses (recoveries) on billed lease revenue | $ | 84 | $ | 26 | $ | 108 | $ | (280) | $ | 903 | |||||||||||||||||||
| Total revenues | $ | 200,637 | $ | 197,357 | $ | 188,795 | $ | 189,915 | $ | 187,856 | |||||||||||||||||||
| Construction contract and other service revenues | (6,041) | (10,872) | (8,485) | (12,458) | (10,259) | ||||||||||||||||||||||||
| Real estate revenues | $ | 194,596 | $ | 186,485 | $ | 180,310 | $ | 177,457 | $ | 177,597 | |||||||||||||||||||
| Total interest expense | $ | 23,996 | $ | 24,324 | $ | 20,894 | $ | 20,938 | $ | 20,504 | |||||||||||||||||||
| Less: Amortization of deferred financing costs | (832) | (817) | (657) | (657) | (667) | ||||||||||||||||||||||||
| Less: Amortization of net debt discounts, net of amounts capitalized | (1,217) | (1,282) | (1,070) | (1,060) | (1,051) | ||||||||||||||||||||||||
| COPT Defense’s share of interest expense of unconsolidated real estate JVs, excluding amortization of deferred financing costs and net debt premium and gain or loss on interest rate derivatives | 947 | 968 | 898 | 759 | 752 | ||||||||||||||||||||||||
| Denominator for interest coverage | 22,894 | 23,193 | 20,065 | 19,980 | 19,538 | ||||||||||||||||||||||||
| Scheduled principal amortization | 397 | 416 | 458 | 457 | 461 | ||||||||||||||||||||||||
| Denominator for debt service coverage | 23,291 | 23,609 | 20,523 | 20,437 | 19,999 | ||||||||||||||||||||||||
| Capitalized interest, excluding amortization of deferred financing costs | 1,679 | 1,714 | 1,292 | 1,126 | 927 | ||||||||||||||||||||||||
| Denominator for fixed charge coverage | $ | 24,970 | $ | 25,323 | $ | 21,815 | $ | 21,563 | $ | 20,926 | |||||||||||||||||||
| Dividends on unrestricted common and deferred shares | $ | 36,134 | $ | 34,414 | $ | 34,332 | $ | 34,324 | $ | 34,318 | |||||||||||||||||||
| Distributions on unrestricted common units | 711 | 573 | 658 | 666 | 661 | ||||||||||||||||||||||||
| Dividends and distributions on restricted shares and units | 267 | 205 | 209 | 218 | 236 | ||||||||||||||||||||||||
| Total dividends and distributions for GAAP payout ratio | 37,112 | 35,192 | 35,199 | 35,208 | 35,215 | ||||||||||||||||||||||||
| Dividends and distributions on antidilutive shares and units | (257) | (198) | (202) | (194) | (237) | ||||||||||||||||||||||||
| Dividends and distributions for non-GAAP payout ratios | $ | 36,855 | $ | 34,994 | $ | 34,997 | $ | 35,014 | $ | 34,978 | |||||||||||||||||||
33 | 1Q 2026 Supplemental Information Package | | ||||||
| 3/31/26 | 12/31/25 | 9/30/25 | 6/30/25 | 3/31/25 | |||||||||||||||||||||||||
| Total assets | $ | 4,458,909 | $ | 4,701,790 | $ | 4,351,432 | $ | 4,286,950 | $ | 4,250,311 | |||||||||||||||||||
| Accumulated depreciation | 1,721,016 | 1,682,367 | 1,644,472 | 1,608,032 | 1,572,422 | ||||||||||||||||||||||||
| Accumulated amortization of intangibles on property acquisitions and deferred leasing costs | 227,989 | 228,656 | 226,312 | 225,192 | 227,122 | ||||||||||||||||||||||||
| COPT Defense’s share of liabilities of unconsolidated real estate JVs | 82,353 | 82,039 | 82,430 | 61,026 | 61,190 | ||||||||||||||||||||||||
| COPT Defense’s share of accumulated depreciation and amortization of unconsolidated real estate JVs | 16,583 | 16,000 | 15,197 | 14,407 | 13,616 | ||||||||||||||||||||||||
| Less: Property - operating lease liabilities | (43,768) | (45,012) | (46,203) | (47,372) | (48,216) | ||||||||||||||||||||||||
| Less: Property - finance lease liabilities | (752) | (363) | (370) | (377) | (384) | ||||||||||||||||||||||||
| Less: Cash and cash equivalents | (28,580) | (274,986) | (23,687) | (21,288) | (24,292) | ||||||||||||||||||||||||
| Less: COPT Defense’s share of cash of unconsolidated real estate JVs | (1,230) | (1,898) | (2,080) | (1,944) | (1,766) | ||||||||||||||||||||||||
| Adjusted book | $ | 6,432,520 | $ | 6,388,593 | $ | 6,247,503 | $ | 6,124,626 | $ | 6,050,003 | |||||||||||||||||||
Gross debt (page 27) | $ | 2,644,154 | $ | 2,866,550 | $ | 2,537,891 | $ | 2,512,850 | $ | 2,488,306 | |||||||||||||||||||
| Less: Cash and cash equivalents | (28,580) | (274,986) | (23,687) | (21,288) | (24,292) | ||||||||||||||||||||||||
| Less: COPT Defense’s share of cash of unconsolidated real estate JVs | (1,230) | (1,898) | (2,080) | (1,944) | (1,766) | ||||||||||||||||||||||||
| Net debt | 2,614,344 | 2,589,666 | 2,512,124 | 2,489,618 | 2,462,248 | ||||||||||||||||||||||||
| Costs incurred on fully-leased development properties | (82,576) | (8,226) | (83,794) | (60,302) | (27,499) | ||||||||||||||||||||||||
| Net debt adjusted for fully-leased investment properties | $ | 2,531,768 | $ | 2,581,440 | $ | 2,428,330 | $ | 2,429,316 | $ | 2,434,749 | |||||||||||||||||||
34 | 1Q 2026 Supplemental Information Package | | ||||||
| Adjusted book | ||
| Adjusted earnings before interest, income taxes, depreciation and amortization (“Adjusted EBITDA”) | ||
| Adjusted EBITDA debt service coverage ratio | ||
| Amortization of acquisition intangibles included in NOI | ||
| Basic FFO available to common share and common unit holders (“Basic FFO”) | ||
Cash net operating income (“Cash NOI”) | ||
35 | 1Q 2026 Supplemental Information Package | | ||||||
COPT Defense’s share of NOI from unconsolidated real estate JVs | ||
Diluted adjusted funds from operations available to common share and common unit holders (“Diluted AFFO”) | ||
Diluted FFO available to common share and common unit holders (“Diluted FFO”) | ||
Diluted FFO available to common share and common unit holders, as adjusted for comparability (“Diluted FFO, as adjusted for comparability”) | ||
Diluted FFO per share | ||
Diluted FFO per share, as adjusted for comparability | ||
36 | 1Q 2026 Supplemental Information Package | | ||||||
Earnings before interest, income taxes, depreciation, and amortization for real estate (“EBITDAre”) | ||
Funds from operations (“FFO” or “FFO per Nareit”) | ||
Gross debt | ||
In-place adjusted EBITDA | ||
Net debt | ||
Net debt adjusted for fully-leased investment properties | ||
Net debt to Adjusted book | ||
37 | 1Q 2026 Supplemental Information Package | | ||||||
Net debt to in-place adjusted EBITDA ratio and Net debt adjusted for fully-leased investment properties to in-place adjusted EBITDA ratio | ||
Net operating income from real estate operations (“NOI”) | ||
NOI fixed charge coverage ratio and Adjusted EBITDA fixed charge coverage ratio | ||
NOI interest coverage ratio and Adjusted EBITDA interest coverage ratio | ||
| Payout ratios based on: Diluted FFO; Diluted FFO, as adjusted for comparability; and Diluted AFFO | ||
Replacement capital expenditures | ||
Same Property NOI from real estate operations and Same Property cash NOI from real estate operations | ||
38 | 1Q 2026 Supplemental Information Package | | ||||||
39 | 1Q 2026 Supplemental Information Package | | ||||||

| NEWS RELEASE | |||||||||||
| IR Contacts: | |||||||||||
| Venkat Kommineni, CFA | Michelle Layne | ||||||||||
| 443.285.5587 | 443.285.5452 | ||||||||||
| venkat.kommineni@copt.com | michelle.layne@copt.com | ||||||||||

Reconciliation of Diluted EPS to FFOPS, per Nareit, and As Adjusted for Comparability | Quarter Ending June 30, 2026 | Year Ending December 31, 2026 | ||||||||||||||||||||||||
| Low | High | Low | High | |||||||||||||||||||||||
| Diluted EPS | $ | 0.31 | $ | 0.33 | $ | 1.24 | $ | 1.30 | ||||||||||||||||||
| Real estate-related depreciation and amortization | 0.37 | 0.37 | 1.50 | 1.50 | ||||||||||||||||||||||
| Gain on sales of real estate | — | — | (0.01) | (0.01) | ||||||||||||||||||||||
| Diluted FFOPS, Nareit definition and as adjusted for comparability | $ | 0.68 | $ | 0.70 | $ | 2.73 | $ | 2.79 | ||||||||||||||||||
| For the Three Months Ended March 31, | |||||||||||
| 2026 | 2025 | ||||||||||
| Revenues | |||||||||||
| Lease revenue | $ | 192,971 | $ | 175,308 | |||||||
| Other property revenue | 1,625 | 2,289 | |||||||||
| Construction contract and other service revenues | 6,041 | 10,259 | |||||||||
| Total revenues | 200,637 | 187,856 | |||||||||
| Operating expenses | |||||||||||
| Property operating expenses | 81,435 | 72,040 | |||||||||
| Depreciation and amortization associated with real estate operations | 42,685 | 39,359 | |||||||||
| Construction contract and other service expenses | 5,552 | 9,705 | |||||||||
| General and administrative expenses | 8,456 | 8,148 | |||||||||
| Leasing expenses | 2,994 | 2,999 | |||||||||
| Business development expenses and land carry costs | 1,199 | 1,009 | |||||||||
| Total operating expenses | 142,321 | 133,260 | |||||||||
| Interest expense | (23,996) | (20,504) | |||||||||
| Interest and other income, net | 3,955 | 1,568 | |||||||||
| Gain on sales of real estate | 582 | 300 | |||||||||
| Income before equity in income of unconsolidated entities and income taxes | 38,857 | 35,960 | |||||||||
| Equity in income of unconsolidated entities | 1,406 | 371 | |||||||||
| Income tax expense | (124) | (103) | |||||||||
| Net income | 40,139 | 36,228 | |||||||||
| Net income attributable to noncontrolling interests | |||||||||||
| Common units in the Operating Partnership (“OP”) | (812) | (726) | |||||||||
| Other consolidated entities | (771) | (762) | |||||||||
| Net income attributable to common shareholders | $ | 38,556 | $ | 34,740 | |||||||
| Earnings per share (“EPS”) computation | |||||||||||
| Numerator for diluted EPS | |||||||||||
| Net income attributable to common shareholders | $ | 38,556 | $ | 34,740 | |||||||
| Amount allocable to share-based compensation awards | (161) | (143) | |||||||||
| Numerator for diluted EPS | $ | 38,395 | $ | 34,597 | |||||||
| Denominator | |||||||||||
| Weighted average common shares - basic | 112,806 | 112,383 | |||||||||
| Dilutive effect of share-based compensation awards | 1,031 | 643 | |||||||||
| Dilutive exchangeable debt | 472 | — | |||||||||
| Weighted average common shares - diluted | 114,309 | 113,026 | |||||||||
| Diluted EPS | $ | 0.34 | $ | 0.31 | |||||||
| For the Three Months Ended March 31, | |||||||||||
| 2026 | 2025 | ||||||||||
| Net income | $ | 40,139 | $ | 36,228 | |||||||
| Real estate-related depreciation and amortization | 42,685 | 39,359 | |||||||||
| Gain on sales of real estate | (582) | (300) | |||||||||
| Depreciation and amortization on unconsolidated real estate JVs | 742 | 741 | |||||||||
| Gain on sale of real estate on unconsolidated real estate JV | (1,146) | — | |||||||||
| Funds from operations (“FFO”) | 81,838 | 76,028 | |||||||||
| FFO allocable to other noncontrolling interests | (1,131) | (1,158) | |||||||||
| Basic FFO allocable to share-based compensation awards | (603) | (530) | |||||||||
| Basic FFO available to common share and common unit holders (“Basic FFO”) | 80,104 | 74,340 | |||||||||
| Diluted FFO adjustments allocable to share-based compensation awards | 64 | 53 | |||||||||
| Diluted FFO available to common share and common unit holders and as adjusted for comparability | 80,168 | 74,393 | |||||||||
| Straight line rent adjustments and lease incentive amortization | (1,330) | (1,699) | |||||||||
| Amortization of intangibles and other assets included in net operating income (“NOI”) | 60 | 162 | |||||||||
| Share-based compensation, net of amounts capitalized | 3,186 | 2,854 | |||||||||
| Amortization of deferred financing costs | 832 | 667 | |||||||||
| Amortization of net debt discounts, net of amounts capitalized | 1,217 | 1,051 | |||||||||
| Replacement capital expenditures | (19,205) | (21,464) | |||||||||
| Other | 156 | 81 | |||||||||
| Diluted adjusted funds from operations available to common share and common unit holders (“Diluted AFFO”) | $ | 65,084 | $ | 56,045 | |||||||
| Diluted FFO per share | $ | 0.69 | $ | 0.65 | |||||||
| Diluted FFO per share, as adjusted for comparability | $ | 0.69 | $ | 0.65 | |||||||
| Dividends/distributions per common share/unit | $ | 0.32 | $ | 0.305 | |||||||
| March 31, 2026 | December 31, 2025 | ||||||||||
| Balance sheet data | |||||||||||
| Properties, net of accumulated depreciation | $ | 3,802,976 | $ | 3,783,477 | |||||||
| Total assets | $ | 4,458,909 | $ | 4,701,790 | |||||||
| Debt per balance sheet | $ | 2,546,958 | $ | 2,767,834 | |||||||
| Total liabilities | $ | 2,867,138 | $ | 3,114,115 | |||||||
| Redeemable noncontrolling interest | $ | 25,130 | $ | 25,506 | |||||||
| Total equity | $ | 1,566,641 | $ | 1,562,169 | |||||||
| Debt to assets | 57.1 | % | 58.9 | % | |||||||
| Net debt to adjusted book | 40.6 | % | 40.5 | % | |||||||
| Defense/IT Portfolio data (as of period end) | |||||||||||
| Number of operating properties | 201 | 201 | |||||||||
| Total operational square feet (in thousands) | 23,167 | 23,159 | |||||||||
| % Occupied | 95.6 | % | 95.5 | % | |||||||
| % Leased | 96.4 | % | 96.5 | % | |||||||
| For the Three Months Ended March 31, | |||||||||||
| 2026 | 2025 | ||||||||||
| GAAP | |||||||||||
| Payout ratio | |||||||||||
| Net income | 92.5 | % | 97.2 | % | |||||||
| Debt ratios | |||||||||||
| Net income to interest expense ratio | 1.7 | x | 1.8 | x | |||||||
| Debt to net income ratio | 15.9 | x | 16.6 | x | |||||||
| Non-GAAP | |||||||||||
| Payout ratios | |||||||||||
| Diluted FFO | 46.0 | % | 47.0 | % | |||||||
| Diluted FFO, as adjusted for comparability | 46.0 | % | 47.0 | % | |||||||
| Diluted AFFO | 56.6 | % | 62.4 | % | |||||||
| Debt ratios | |||||||||||
| Adjusted EBITDA fixed charge coverage ratio | 4.3 | x | 4.7 | x | |||||||
| Net debt to in-place adjusted EBITDA ratio | 6.1 | x | 6.1 | x | |||||||
| Net debt adjusted for fully-leased investment properties to in-place adjusted EBITDA ratio | 5.9 | x | 6.0 | x | |||||||
| Reconciliation of denominators for per share measures | |||||||||||
| Denominator for diluted EPS | 114,309 | 113,026 | |||||||||
| Weighted average common units | 2,063 | 2,047 | |||||||||
| Denominator for diluted FFO per share and as adjusted for comparability | 116,372 | 115,073 | |||||||||
| For the Three Months Ended March 31, | |||||||||||
| 2026 | 2025 | ||||||||||
| Numerators for payout ratios | |||||||||||
| Dividends on unrestricted common and deferred shares | $ | 36,134 | $ | 34,318 | |||||||
| Distributions on unrestricted common units | 711 | 661 | |||||||||
| Dividends and distributions on restricted shares and units | 267 | 236 | |||||||||
| Total dividends and distributions for GAAP payout ratio | 37,112 | 35,215 | |||||||||
| Dividends and distributions on antidilutive shares and units | (257) | (237) | |||||||||
| Dividends and distributions for non-GAAP payout ratios | $ | 36,855 | $ | 34,978 | |||||||
| Reconciliation of net income to earnings before interest, income taxes, depreciation and amortization for real estate (“EBITDAre”), adjusted EBITDA, and in-place adjusted EBITDA | |||||||||||
| Net income | $ | 40,139 | $ | 36,228 | |||||||
| Interest expense | 23,996 | 20,504 | |||||||||
| Income tax expense | 124 | 103 | |||||||||
| Real estate-related depreciation and amortization | 42,685 | 39,359 | |||||||||
| Other depreciation and amortization | 416 | 542 | |||||||||
| Gain on sales of real estate | (582) | (300) | |||||||||
| Adjustments from unconsolidated real estate JVs | 650 | 1,518 | |||||||||
| EBITDAre | 107,428 | 97,954 | |||||||||
| Credit loss (recoveries) expense | (369) | 515 | |||||||||
| Business development expenses | 802 | 593 | |||||||||
| Executive transition costs | — | 57 | |||||||||
| Net gain on other investments | (29) | — | |||||||||
| Adjusted EBITDA | 107,832 | 99,119 | |||||||||
| Pro forma NOI adjustment for property changes within period | — | 786 | |||||||||
| Change in collectability of deferred rental revenue | 86 | 1,232 | |||||||||
| In-place adjusted EBITDA | $ | 107,918 | $ | 101,137 | |||||||
| Reconciliations of tenant improvements and incentives, building improvements, and leasing costs for operating properties to replacement capital expenditures | |||||||||||
| Tenant improvements and incentives | $ | 15,899 | $ | 13,758 | |||||||
| Building improvements | 1,142 | 1,872 | |||||||||
| Leasing costs | 1,547 | 3,461 | |||||||||
| Net additions to tenant improvements and incentives | 924 | 3,538 | |||||||||
| Excluded building improvements | (307) | (201) | |||||||||
| Excluded leasing costs | — | (964) | |||||||||
| Replacement capital expenditures | $ | 19,205 | $ | 21,464 | |||||||
| For the Three Months Ended March 31, | |||||||||||
| 2026 | 2025 | ||||||||||
| Reconciliation of interest expense to the denominator for fixed charge coverage-Adjusted EBITDA | |||||||||||
| Interest expense | $ | 23,996 | $ | 20,504 | |||||||
| Less: Amortization of deferred financing costs | (832) | (667) | |||||||||
| Less: Amortization of net debt discounts, net of amounts capitalized | (1,217) | (1,051) | |||||||||
| COPT Defense’s share of interest expense of unconsolidated real estate JVs, excluding amortization of deferred financing costs and net debt premium and gain or loss on interest rate derivatives | 947 | 752 | |||||||||
| Scheduled principal amortization | 397 | 461 | |||||||||
| Capitalized interest, excluding amortization of deferred financing costs | 1,679 | 927 | |||||||||
| Denominator for fixed charge coverage-Adjusted EBITDA | $ | 24,970 | $ | 20,926 | |||||||
| Reconciliation of net income to NOI from real estate operations, same property NOI from real estate operations, and same property cash NOI from real estate operations | |||||||||||
| Net income | $ | 40,139 | $ | 36,228 | |||||||
| Construction contract and other service revenues | (6,041) | (10,259) | |||||||||
| Depreciation and other amortization associated with real estate operations | 42,685 | 39,359 | |||||||||
| Construction contract and other service expenses | 5,552 | 9,705 | |||||||||
| General and administrative expenses | 8,456 | 8,148 | |||||||||
| Leasing expenses | 2,994 | 2,999 | |||||||||
| Business development expenses and land carry costs | 1,199 | 1,009 | |||||||||
| Interest expense | 23,996 | 20,504 | |||||||||
| Interest and other income, net | (3,955) | (1,568) | |||||||||
| Gain on sales of real estate | (582) | (300) | |||||||||
| Equity in income of unconsolidated entities | (1,406) | (371) | |||||||||
| Unconsolidated real estate JVs NOI allocable to COPT Defense included in equity in income of unconsolidated entities | 2,056 | 1,889 | |||||||||
| Income tax expense | 124 | 103 | |||||||||
| NOI from real estate operations | 115,217 | 107,446 | |||||||||
| Non-Same Property NOI from real estate operations | (4,836) | (400) | |||||||||
| Same Property NOI from real estate operations | 110,381 | 107,046 | |||||||||
| Straight line rent adjustments and lease incentive amortization | 677 | (1,811) | |||||||||
| Amortization of acquired above- and below-market rents | 80 | 64 | |||||||||
| Lease termination fees, net | (1,212) | (834) | |||||||||
| Tenant funded landlord assets and lease incentives | (3,318) | (3,413) | |||||||||
| Cash NOI adjustments in unconsolidated real estate JVs | (355) | (260) | |||||||||
| Same Property Cash NOI from real estate operations | $ | 106,253 | $ | 100,792 | |||||||
| March 31, 2026 | December 31, 2025 | |||||||||||||
| Reconciliation of total assets to adjusted book | ||||||||||||||
| Total assets | $ | 4,458,909 | $ | 4,701,790 | ||||||||||
| Accumulated depreciation | 1,721,016 | 1,682,367 | ||||||||||||
| Accumulated amortization of intangibles on property acquisitions and deferred leasing costs | 227,989 | 228,656 | ||||||||||||
| COPT Defense’s share of liabilities of unconsolidated real estate JVs | 82,353 | 82,039 | ||||||||||||
| COPT Defense’s share of accumulated depreciation and amortization of unconsolidated real estate JVs | 16,583 | 16,000 | ||||||||||||
| Less: Property - operating lease liabilities | (43,768) | (45,012) | ||||||||||||
| Less: Property - finance lease liabilities | (752) | (363) | ||||||||||||
| Less: Cash and cash equivalents | (28,580) | (274,986) | ||||||||||||
| Less: COPT Defense’s share of cash of unconsolidated real estate JVs | (1,230) | (1,898) | ||||||||||||
| Adjusted book | $ | 6,432,520 | $ | 6,388,593 | ||||||||||
| March 31, 2026 | December 31, 2025 | March 31, 2025 | ||||||||||||||||||
| Reconciliation of debt to net debt and net debt adjusted for fully-leased investment properties | ||||||||||||||||||||
| Debt per balance sheet | $ | 2,546,958 | $ | 2,767,834 | $ | 2,412,670 | ||||||||||||||
| Net discounts and deferred financing costs | 21,946 | 23,466 | 21,886 | |||||||||||||||||
| COPT Defense’s share of unconsolidated JV gross debt | 75,250 | 75,250 | 53,750 | |||||||||||||||||
| Gross debt | 2,644,154 | 2,866,550 | 2,488,306 | |||||||||||||||||
| Less: Cash and cash equivalents | (28,580) | (274,986) | (24,292) | |||||||||||||||||
| Less: COPT Defense’s share of cash of unconsolidated real estate JVs | (1,230) | (1,898) | (1,766) | |||||||||||||||||
| Net debt | 2,614,344 | 2,589,666 | 2,462,248 | |||||||||||||||||
| Costs incurred on fully-leased development properties | (82,576) | (8,226) | (27,499) | |||||||||||||||||
| Net debt adjusted for fully-leased investment properties | $ | 2,531,768 | $ | 2,581,440 | $ | 2,434,749 | ||||||||||||||