Link to searchable text of slide shown above
Link to searchable text of slide shown above
Link to searchable text of slide shown above
Link to searchable text of slide shown above
Link to searchable text of slide shown above
STRONG OUTLOOK
STRONG OUTLOOK
Link to searchable text of slide shown above
Link to searchable text of slide shown above
Link to searchable text of slide shown above
Link to searchable text of slide shown above

Link to searchable text of slide shown above
Link to searchable text of slide shown above
Link to searchable text of slide shown above
Link to searchable text of slide shown above
Link to searchable text of slide shown above
Link to searchable text of slide shown above
Link to searchable text of slide shown above
Link to searchable text of slide shown above
Link to searchable text of slide shown above
Link to searchable text of slide shown above
Link to searchable text of slide shown above

Link to searchable text of slide shown above
Link to searchable text of slide shown above
Link to searchable text of slide shown above
Link to searchable text of slide shown above
Link to searchable text of slide shown above

Link to searchable text of slide shown above
Link to searchable text of slide shown above
Link to searchable text of slide shown above
Link to searchable text of slide shown above
Link to searchable text of slide shown above
Link to searchable text of slide shown above
Link to searchable text of slide shown above
Link to searchable text of slide shown above
Link to searchable text of slide shown above
Link to searchable text of slide shown above

Link to searchable text of slide shown above
Link to searchable text of slide shown above
Link to searchable text of slide shown above
Searchable text section of graphics shown above
CORPORATE
OFFICE
PROPERTIES
TRUST
The Mid-Atlantic Suburban Office REIT
The Money Show — Las Vegas
May 2003
DISCLOSURE
This presentation contains forward-looking information based upon the Company’s current best judgement and expectations. Actual results could vary from those presented herein. The risks and uncertainties associated with the forward-looking information include the strength of the commercial office real estate market in which the Company operates, competitive market conditions, general economic growth, interest rates and capital market conditions. The Company undertakes no obligations to publicly update or revise any forward-looking statements, whether as a result of new information, future events, or otherwise. For further information, please refer to the Company’s filings with the Securities and Exchange Commission.
Defined terms for Non GAAP measurements used throughout may be found in the Addendum. In addition, a Reconciliation of Non GAAP measures to the most comparable GAAP measure is included in the Addendum.
1
OVERVIEW
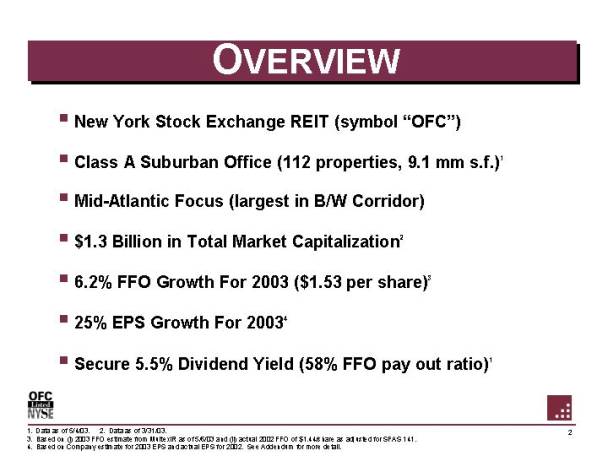
• New York Stock Exchange REIT (symbol “OFC”)
• Class A Suburban Office (112 properties, 9.1 mm s. f.)1
• Mid-Atlantic Focus (largest in B/ W Corridor)
• $1.3 Billion in Total Market Capitalization2
• 6.2% FFO Growth For 2003 ($ 1.53 per share)3
• 25% EPS Growth For 20034
• Secure 5. 5% Dividend Yield (58% FFO pay out ratio)1
1. Data as of 5/4/03. 2. Data as of 3/31/03.
3. Based on (i) 2003 FFO estimate from MultexIR as of 5/6/03 and (ii) actual 2002 FFO of $1.44/share as adjusted for SFAS 141.
4. Based on Company estimate for 2003 EPS and actual EPS for 2002. See Addendum for more detail.
2
TOP PERFORMING OFFICE REIT
|
|
|
Total Returns(1) |
|
||||||
|
|
|
1 Year |
|
2 Year |
|
3 Year |
|
4 Year |
|
|
|
|
(2002) |
|
(2001-2002) |
|
(2000-2002) |
|
(1999-2002) |
|
|
|
|
|
|
|
|
|
|
|
|
|
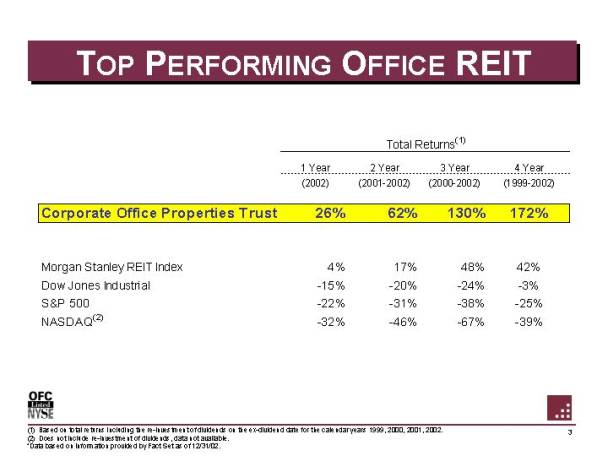
Corporate Office Properties Trust |
|
26% |
|
62% |
|
130% |
|
172% |
|
|
|
|
|
|
|
|
|
|
|
|
|
Morgan Stanley REIT Index |
|
4% |
|
17% |
|
48% |
|
42% |
|
|
Dow Jones Industrial |
|
-15% |
|
-20% |
|
-24% |
|
-3% |
|
|
S&P 500 |
|
-22% |
|
-31% |
|
-38% |
|
-25% |
|
|
NASDAQ(2) |
|
-32% |
|
-46% |
|
-67% |
|
-39% |
|
(1) Based on total returns including the re-investment of dividends on the ex-dividend date for the calendar years 1999, 2000, 2001, 2002.
(2) Does not include re-investment of dividends, data not available.
*Data based on information provided by Fact Set as of 12/31/02.
3
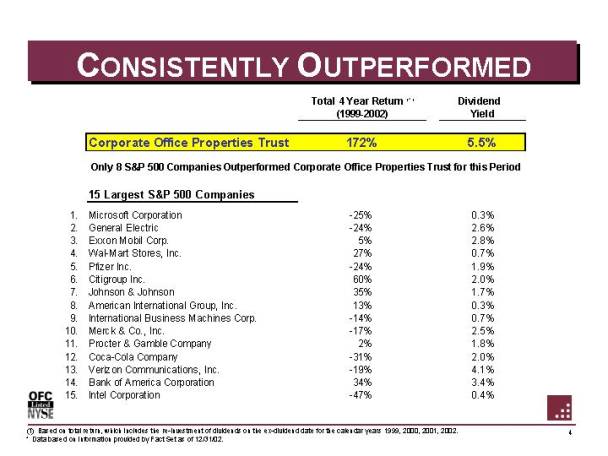
CONSISTENTLY OUTPERFORMED
|
|
|
|
|
Total 4
Year Return(1) |
|
Dividend |
|
|
|
|
|
|
|
|
|
|
|
|
|
Corporate Office Properties Trust |
|
172% |
|
5.5% |
|
|
|
|
|
|
|
|
|
|
|
|
|
Only 8 S&P 500 Companies Outperformed Corporate Office Properties Trust for this Period |
|
||||
|
|
|
|
|
|
|
|
|
|
|
|
15 Largest S&P 500 Companies |
|
|
|
|
|
|
|
|
|
|
|
|
|
|
|
1. |
|
Microsoft Corporation |
|
-25% |
|
0.3% |
|
|
2. |
|
General Electric |
|
-24% |
|
2.6% |
|
|
3. |
|
Exxon Mobil Corp. |
|
5% |
|
2.8% |
|
|
4. |
|
Wal-Mart Stores, Inc. |
|
27% |
|
0.7% |
|
|
5. |
|
Pfizer Inc. |
|
-24% |
|
1.9% |
|
|
6. |
|
Citigroup Inc. |
|
60% |
|
2.0% |
|
|
7. |
|
Johnson & Johnson |
|
35% |
|
1.7% |
|
|
8. |
|
American International Group, Inc. |
|
13% |
|
0.3% |
|
|
9. |
|
International Business Machines Corp. |
|
-14% |
|
0.7% |
|
|
10. |
|
Merck & Co., Inc. |
|
-17% |
|
2.5% |
|
|
11. |
|
Procter & Gamble Company |
|
2% |
|
1.8% |
|
|
12. |
|
Coca-Cola Company |
|
-31% |
|
2.0% |
|
|
13. |
|
Verizon Communications, Inc. |
|
-19% |
|
4.1% |
|
|
14. |
|
Bank of America Corporation |
|
34% |
|
3.4% |
|
|
15. |
|
Intel Corporation |
|
-47% |
|
0.4% |
|
(1) Based on total return, which includes the re-investment of dividends on the ex-dividend date for the calendar years 1999, 2000, 2001, 2002.
* Data based on information provided by Fact Set as of 12/31/02.
4
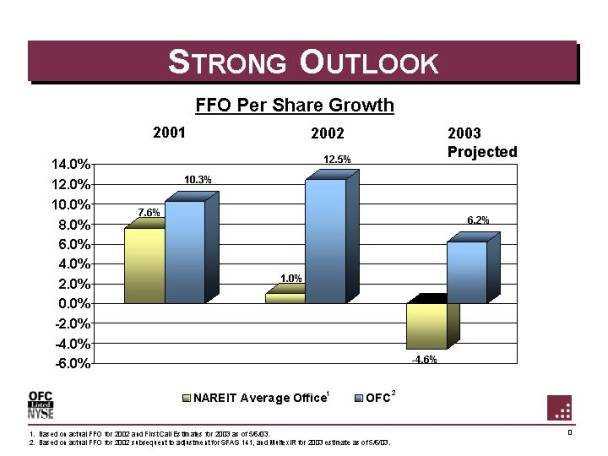
STRONG OUTLOOK
FFO Per Share Growth
[CHART]
|
|
|
|
|
|
|
2003 |
|
|
|
|
2001 |
|
2002 |
|
Projected |
|
|
NAREIT Average Office (1) |
|
7.6 |
% |
1.0 |
% |
-4.6 |
% |
|
OFC (2) |
|
10.3 |
% |
12.5 |
% |
6.2 |
% |
1. Based on actual FFO for 2002 and First Call Estimates for 2003 as of 5/6/03.
2. Based on actual FFO for 2002 subsequent to adjustment for SFAS 141, and MultexIR for 2003 estimate as of 5/6/03.
5
THE FACTS ABOUT REITS
• Real Estate Accepted as Asset Class that Improves
Portfolio Diversification
• Competitive Risk-Adjusted Returns
• Low Correlation with Stocks and Bonds
• By Design, REITs are High-Yielding Stocks
• REITs Should Trade Based on Underlying Property Values
• REITs Should Provide 12-16% Total Return on Average
6
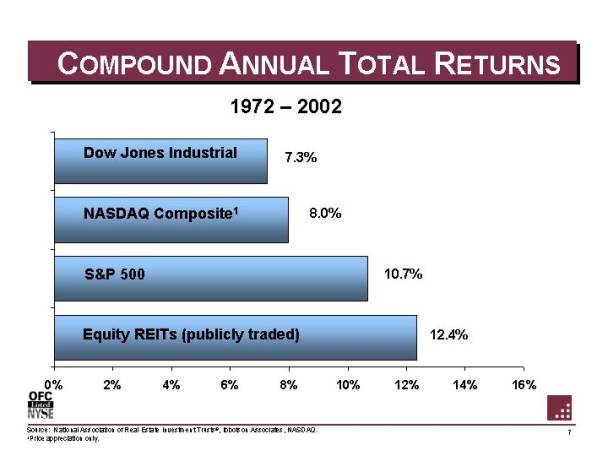
COMPOUND ANNUAL TOTAL RETURNS
1972-2002
[CHART]
|
Dow Jones Industrial |
|
7.3 |
% |
|
NASDAQ Composite (1) |
|
8.0 |
% |
|
S&P 500 |
|
10.7 |
% |
|
Equity REITs (publicly traded) |
|
12.4 |
% |
Source: National Association of Real Estate Investment Trusts®, Ibbotson Associates, NASDAQ.
1Price appreciation only.
7
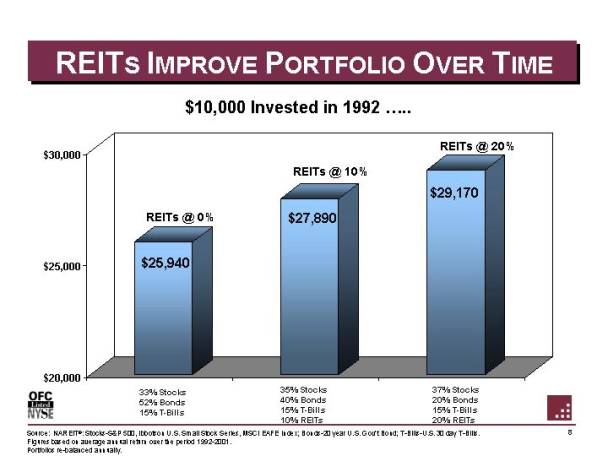
REITS IMPROVE PORTFOLIO OVER TIME
$10,000 Invested in 1992 …..
[CHART]
|
REITs @ 0% |
|
REITs @ 10% |
|
REITs @ 20% |
|
$ 25,940 |
|
$ 27,890 |
|
$ 29,170 |
|
33% Stocks |
|
35% Stocks |
|
37% Stocks |
|
52% Bonds |
|
40% Bonds |
|
20% Bonds |
|
15% T-Bills |
|
15% T-Bills |
|
15% T-Bills |
|
|
|
10% REITs |
|
20% REITs |
Source: NAREIT®: Stocks-S&P 500, Ibbotson U. S. Small Stock Series, MSCI EAFE Index; Bonds-20 year U. S. Gov’t Bond; T-Bills-U. S. 30 day T-Bills.
Figures based on average annual return over the period 1992-2001.
Portfolios re-balanced annually.
8
EXCELLENT BUYING OPPORTUNITY
• REITs
yielding 420 bps spread to Treasuries
(6.8% REIT Yield vs. 2.6% 5-Year Treasury Yield)
• REITs
yielding 500 bps spread to S&P 500 Yields
(6.8% REIT Yield vs. 1.8% S&P 500 Yield)
• REIT
multiples at a 70% discount to the S&P 500
(9.7x REIT FFO Multiple vs. 32x S&P 500 P/E Ratio)
• REITs offer portfolio diversification, as they have low
correlation with the NASDAQ and S&P 500
9
CORE STRENGTHS
• Mid-Atlantic Submarket Dominance
• Corporate Credit Tenants
• Value Creating Management
• Strong Earnings Growth
10
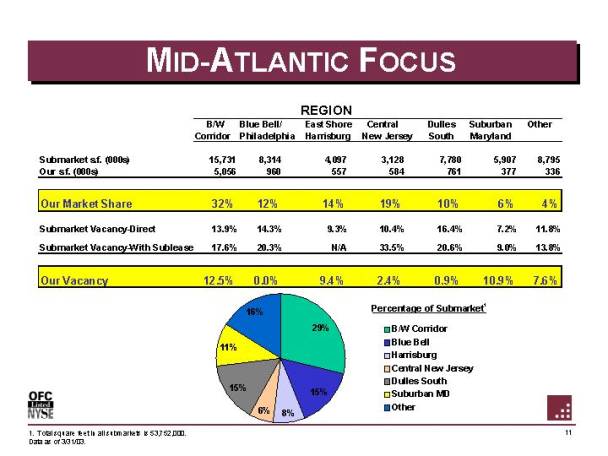
MID-ATLANTIC FOCUS
|
|
|
REGION |
||||||||||||
|
|
|
|
|
|
|
|
|
|
|
|
|
|
|
|
|
|
|
B/W |
|
Blue Bell/ |
|
East Shore |
|
Central |
|
Dulles |
|
Suburban |
|
Other |
|
Submarket s.f. (000s) |
|
15,731 |
|
8,314 |
|
4,097 |
|
3,128 |
|
7,780 |
|
5,907 |
|
8,795 |
|
Our s.f. (000s) |
|
5,056 |
|
960 |
|
557 |
|
584 |
|
761 |
|
377 |
|
336 |
|
|
|
|
|
|
|
|
|
|
|
|
|
|
|
|
|
Our Market Share |
|
32% |
|
12% |
|
14% |
|
19% |
|
10% |
|
6% |
|
4% |
|
|
|
|
|
|
|
|
|
|
|
|
|
|
|
|
|
Submarket Vacancy-Direct |
|
13.9% |
|
14.3% |
|
9.3% |
|
10.4% |
|
16.4% |
|
7.2% |
|
11.8% |
|
|
|
|
|
|
|
|
|
|
|
|
|
|
|
|
|
Submarket Vacancy-With Sublease |
|
17.6% |
|
20.3% |
|
N/A |
|
33.5% |
|
20.6% |
|
9.0% |
|
13.8% |
|
|
|
|
|
|
|
|
|
|
|
|
|
|
|
|
|
Our Vacancy |
|
12.5% |
|
0.0% |
|
9.4% |
|
2.4% |
|
0. 9% |
|
10.9% |
|
7. 6% |
[CHART]
|
|
|
B/W Corridor |
|
Blue Bell/ Philadelphia |
|
East Shore Harrisburg |
|
Central New Jersey |
|
Dulles South |
|
Suburban Maryland |
|
Other |
|
% of Submarket (1) |
|
29% |
|
15% |
|
8% |
|
6% |
|
15% |
|
11% |
|
16% |
1. Total square feet in all submarkets is 53,752,000.
Data as of 3/31/03.
11
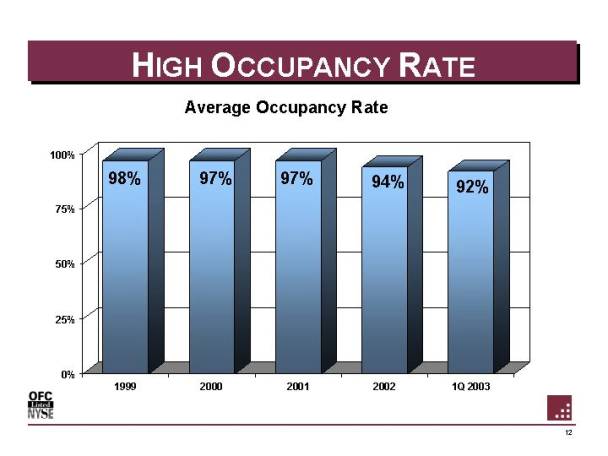
HIGH OCCUPANCY RATE
Average Occupancy Rate
[CHART]
|
|
|
1999 |
|
2000 |
|
2001 |
|
2002 |
|
1Q 2003 |
|
Average Occupancy Rate |
|
98% |
|
97% |
|
97% |
|
94% |
|
92% |
12
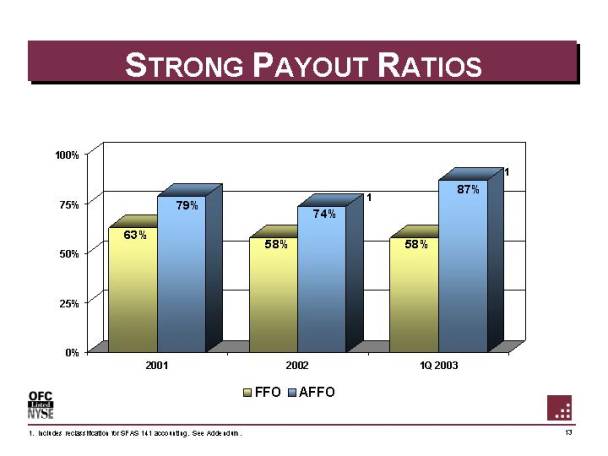
STRONG PAYOUT RATIOS
[CHART]
|
|
|
2001 |
|
2002 |
|
1Q 2003 |
|
|
FFO |
|
63% |
|
58% |
|
58% |
|
|
AFFO |
|
79% |
|
74% |
(1) |
87% |
(1) |
1. Includes reclassification for SFAS 141 accounting. See Addendum.
13
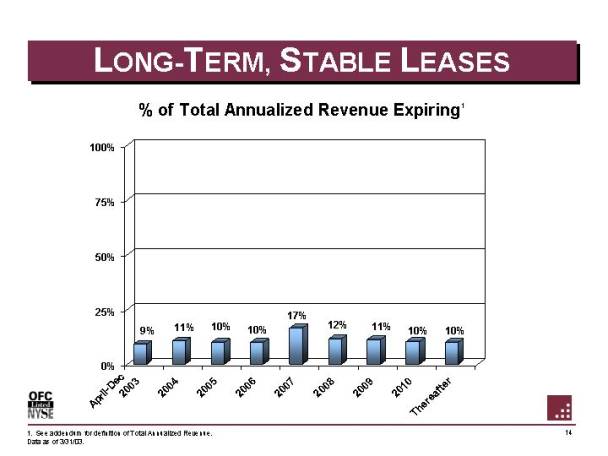
LONG-TERM, STABLE LEASES
% of Total Annualized Revenue Expiring1
[CHART]
|
Apr - Dec |
|
|
|
|
|
|
|
|
|
|
|
|
|
|
|
|
|
2003 |
|
2004 |
|
2005 |
|
2006 |
|
2007 |
|
2008 |
|
2009 |
|
2010 |
|
Thereafter |
|
9% |
|
11% |
|
10% |
|
10% |
|
17% |
|
12% |
|
11% |
|
10% |
|
10% |
1. See addendum for definition of Total Annualized Revenue.
Data as of 3/31/03.
14
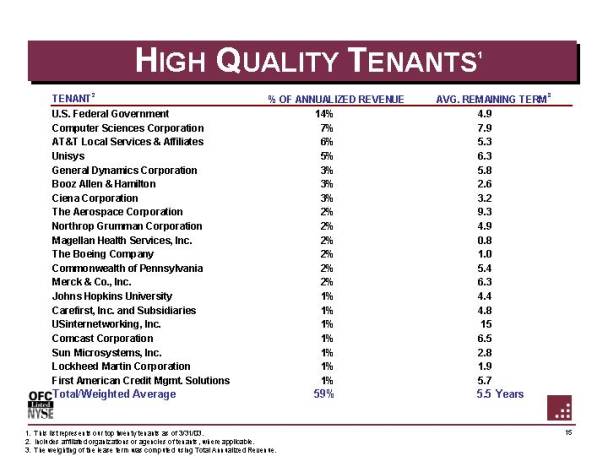
HIGH QUALITY TENANTS1
|
TENANT2 |
|
% OF ANNUALIZED REVENUE |
|
AVG. REMAINING TERM3 |
|||
|
|
|
|
|
|
|
||
|
U.S. Federal Government |
|
14 |
% |
4.9 |
|
||
|
Computer Sciences Corporation |
|
7 |
% |
7.9 |
|
||
|
AT&T Local Services & Affiliates |
|
6 |
% |
5. 3 |
|
||
|
Unisys |
|
5 |
% |
6.3 |
|
||
|
General Dynamics Corporation |
|
3 |
% |
5.8 |
|
||
|
Booz Allen & Hamilton |
|
3 |
% |
2.6 |
|
||
|
Ciena Corporation |
|
3 |
% |
3.2 |
|
||
|
The Aerospace Corporation |
|
2 |
% |
9.3 |
|
||
|
Northrop Grumman Corporation |
|
2 |
% |
4.9 |
|
||
|
Magellan Health Services, Inc. |
|
2 |
% |
0.8 |
|
||
|
The Boeing Company |
|
2 |
% |
1.0 |
|
||
|
Commonwealth of Pennsylvania |
|
2 |
% |
5.4 |
|
||
|
Merck & Co., Inc. |
|
2 |
% |
6.3 |
|
||
|
Johns Hopkins University |
|
1 |
% |
4.4 |
|
||
|
Carefirst, Inc. and Subsidiaries |
|
1 |
% |
4.8 |
|
||
|
USinternetworking, Inc. |
|
1 |
% |
15 |
|
||
|
Comcast Corporation |
|
1 |
% |
6.5 |
|
||
|
Sun Microsystems, Inc. |
|
1 |
% |
2.8 |
|
||
|
Lockheed Martin Corporation |
|
1 |
% |
1.9 |
|
||
|
First American Credit Mgmt. Solutions |
|
1 |
% |
5.7 |
|
||
|
Total/Weighted Average |
|
59 |
% |
5.5 |
Years |
||
1. This list represents our top twenty tenants as of 3/31/03.
2. Includes affiliated organizations or agencies of tenants, where applicable.
3. The weighting of the lease term was computed using Total Annualized Revenue.
15
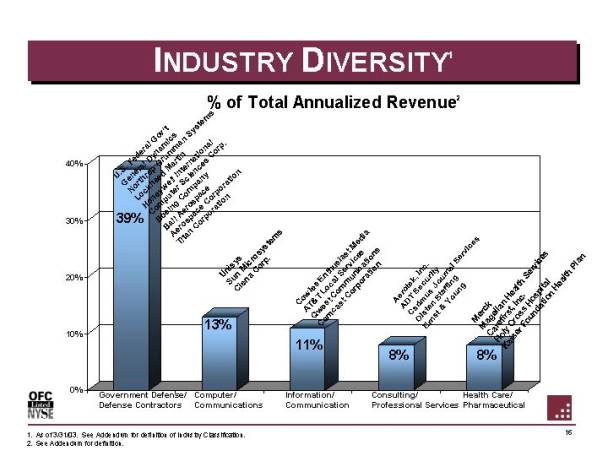
INDUSTRY DIVERSITY1
% of Total Annualized Revenue2
[CHART]
|
|
Government |
|
|
|
|
|
|
|
|
|
% of Total Annualized Revenue (2) |
39% |
|
13% |
|
11% |
|
8% |
|
8% |
|
|
|
|
|
|
|
|
|
|
|
|
|
U.S Federal Gov't |
|
Unisys |
|
Cowles Enthusiast Media |
|
Aerotek, Inc. |
|
Merck |
|
|
General Dynamics |
|
Sun Microsystems |
|
AT&T Local Services |
|
ADT Security |
|
Magellan Health Services |
|
|
Northrop Grumman Systems |
|
Ciena Corp. |
|
Qwest Communications |
|
Cadmus Journal Services |
|
Carefirst, Inc. |
|
|
Lockheed Martin |
|
|
|
Comcast Corporation |
|
Olsten Staffing |
|
Holy Cross Hospital |
|
|
Honeywell International |
|
|
|
|
|
Ernst & Young |
|
Kaiser Foundation Health Plan |
|
|
Computer Sciences Corp. |
|
|
|
|
|
|
|
|
|
|
Boeing Company |
|
|
|
|
|
|
|
|
|
|
Ball Aerospace |
|
|
|
|
|
|
|
|
|
|
Aerospace Corporation |
|
|
|
|
|
|
|
|
|
|
Titan Corporation |
|
|
|
|
|
|
|
|
1. As of 3/31/03. See Addendum for definition of Industry Classification.
2. See Addendum for definition.
16
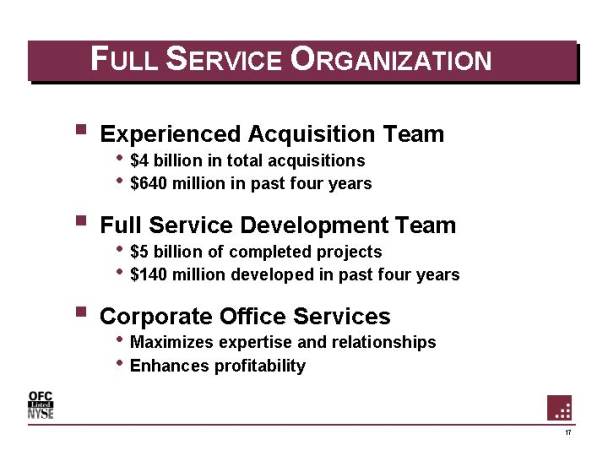
FULL SERVICE ORGANIZATION
• Experienced Acquisition Team
• $4 billion in total acquisitions
• $640 million in past four years
• Full Service Development Team
• $5 billion of completed projects
• $140 million developed in past four years
• Corporate Office Services
• Maximizes expertise and relationships
• Enhances profitability
17
ACQUISITION STRATEGY
• Class A Suburban Office Focus
• Strategic Fit
• Below Replacement Cost
• Opportunity to Create Value
18
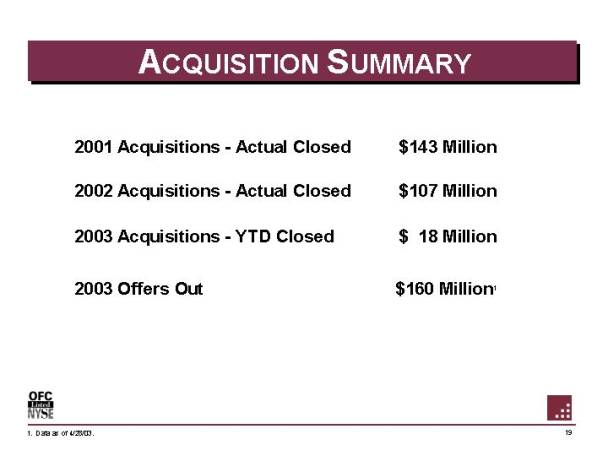
ACQUISITION SUMMARY
|
2001 Acquisitions - Actual Closed |
|
$ |
143 Million |
|
|
2002 Acquisitions - Actual Closed |
|
$ |
107 Million |
|
|
2003 Acquisitions - YTD Closed |
|
$ |
18 Million |
|
|
2003 Offers Out |
|
$ |
160 Million |
1 |
1. Data as of 4/28/03.
19
2002 ACQUISITIONS
• $107.3 Million in 2002
• 9 Properties Totaling 840,000 Square Feet
|
|
|
7000 Columbia Gateway Drive |
|
|
|
|
|
|
|
145,800 square feet |
|
Rivers 95 |
|
Acquired 5/31/02 |
|
|
|
|
|
4 building portfolio |
|
|
|
109,700 square feet |
7320 Parkway Drive |
|
|
Acquired 4/4/02 |
|
|
|
|
57,200 square feet |
|
|
|
Acquired 4/4/02 |
|
20
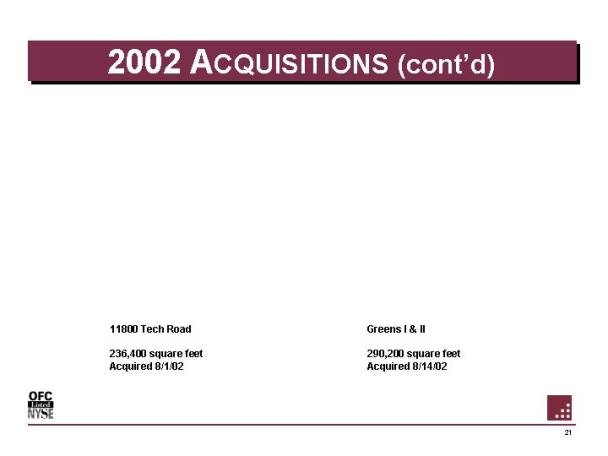
2002 ACQUISITIONS (cont’d)
|
11800 Tech Road |
|
Greens I & II |
|
|
|
|
|
236,400 square feet |
|
290,200 square feet |
|
Acquired 8/1/02 |
|
Acquired 8/14/02 |
21
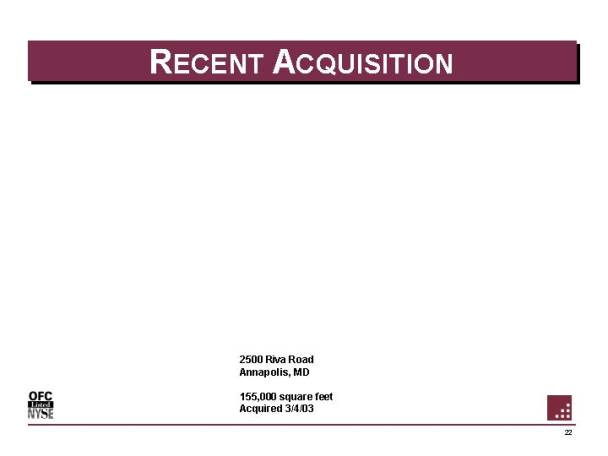
RECENT ACQUISITION
|
|
2500 Riva Road |
|
|
|
Annapolis, MD |
|
|
|
|
|
|
|
155,000 square feet |
|
|
|
Acquired 3/4/03 |
|
22
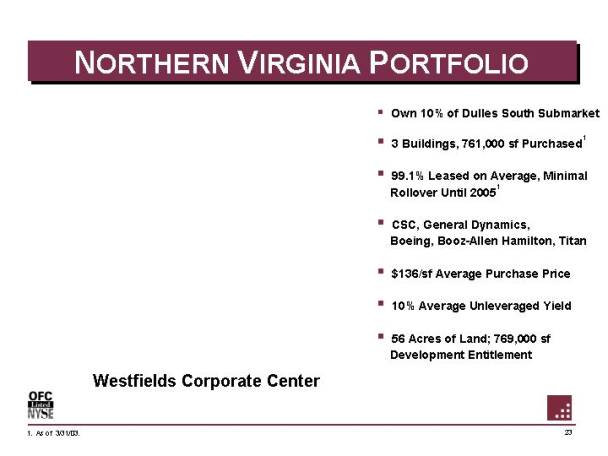
NORTHERN VIRGINIA PORTFOLIO
• Own 10% of Dulles South Submarket
• 3 Buildings, 761,000 sf Purchased1
• 99.1% Leased on Average, Minimal Rollover Until 20051
• CSC, General Dynamics, Boeing, Booz-Allen Hamilton, Titan
• $136/sf Average Purchase Price
• 10% Average Unleveraged Yield
• 56 Acres of Land; 769,000 sf Development Entitlement
Westfields Corporate Center
1. As of 3/31/03.
23
DEVELOPMENT STRATEGY
• Control Land Adjacent to Existing Properties
• Capitalize on Expanding Tenant Base
• Secure Leases Prior to Commitment of Capital
• Target 11+% Unleveraged Cash Yields
24
NATIONAL BUSINESS PARK DEVELOPMENT
• Current Portfolio
• 11 buildings, 1.2 mm s. f.
• 100% leased
• Under Construction
• 1 building, 119,000 s. f.
• Under Development
• 1 building, 157,000 s. f.
• Land Owned/ Controlled
• 121 acres
• 1.3 million s. f.
The National Business Park
Baltimore/ Washington Corridor
• 1.2 million square feet
• 100% owned by OFC
Data as of 3/31/03.
25
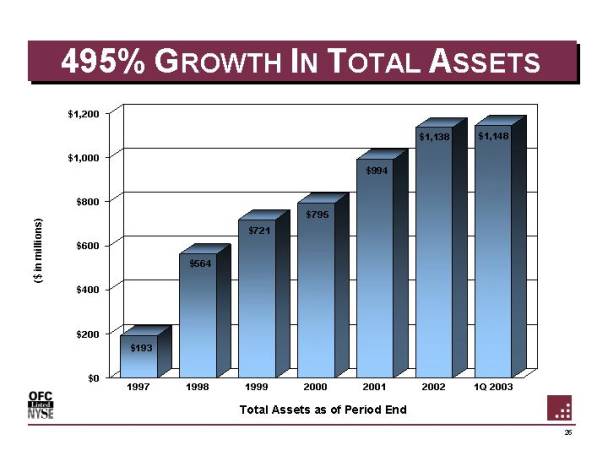
495% GROWTH IN TOTAL ASSETS
[CHART]
|
1997 |
|
1998 |
|
1999 |
|
2000 |
|
2001 |
|
2002 |
|
1Q 2003 |
|||||||
|
$ |
193 |
|
$ |
564 |
|
$ |
721 |
|
$ |
795 |
|
$ |
994 |
|
$ |
1,138 |
|
$ |
1,148 |
Total Assets as of Period End
($ in millions)
26
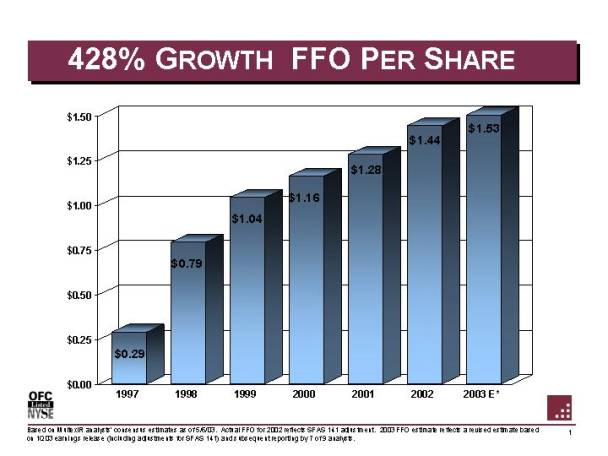
428% GROWTH FFO PER SHARE
[CHART]
|
|
|
1997 |
|
1998 |
|
1999 |
|
2000 |
|
2001 |
|
2002 |
|
2003 E* |
|||||||
|
FFO Per Share |
|
$ |
0.29 |
|
$ |
0.79 |
|
$ |
1.04 |
|
$ |
1.16 |
|
$ |
1.28 |
|
$ |
1.44 |
|
$ |
1.53 |
Based on MultexIR analysts’ consensus estimates as of 5/6/03. Actual FFO for 2002 reflects SFAS 141 adjustment. 2003 FFO estimate reflects a revised estimate based on 1Q03 earnings release (including adjustments for SFAS 141) and subsequent reporting by 7 of 9 analysts.
27
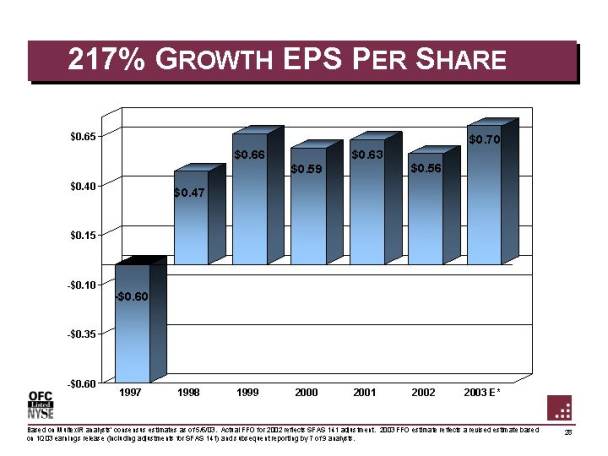
217% GROWTH EPS PER SHARE
[CHART]
|
|
|
1997 |
|
1998 |
|
1999 |
|
2000 |
|
2001 |
|
2002 |
|
2003 E* |
|||||||
|
EPS Per Share |
|
$ |
(0.60 |
) |
$ |
0.47 |
|
$ |
0.66 |
|
$ |
0.59 |
|
$ |
0.63 |
|
$ |
0.56 |
|
$ |
0.70 |
Based on MultexIR analysts’ consensus estimates as of 5/6/03. Actual FFO for 2002 reflects SFAS 141 adjustment. 2003 FFO estimate reflects a revised estimate based on 1Q03 earnings release (including adjustments for SFAS 141) and subsequent reporting by 7 of 9 analysts.
28
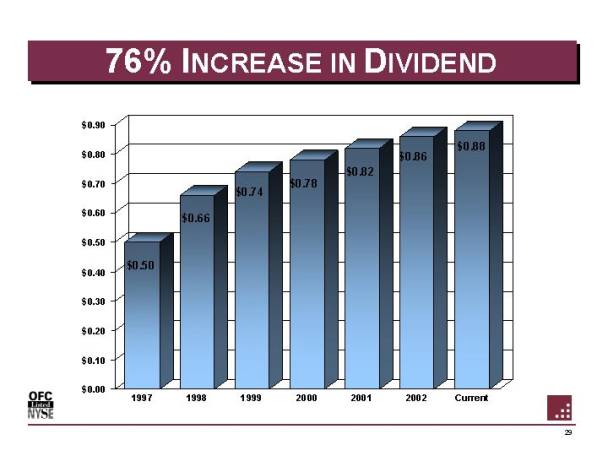
76% INCREASE IN DIVIDEND
[CHART]
|
|
|
1997 |
|
1998 |
|
1999 |
|
2000 |
|
2001 |
|
2002 |
|
Current |
|||||||
|
Dividend per common share |
|
$ |
0.50 |
|
$ |
0.66 |
|
$ |
0.74 |
|
$ |
0.78 |
|
$ |
0.82 |
|
$ |
0.86 |
|
$ |
0.88 |
29
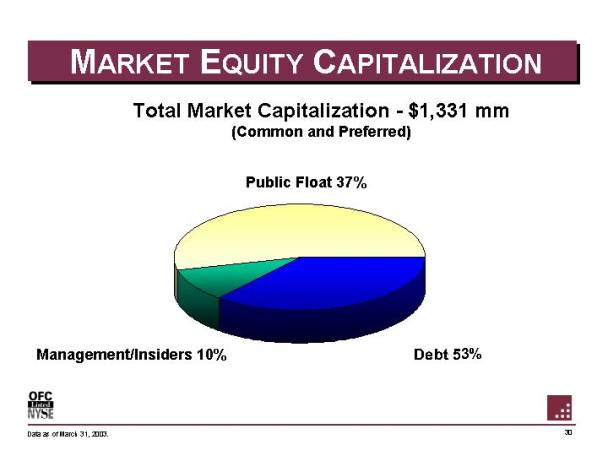
MARKET EQUITY CAPITALIZATION
Total Market Capitalization - $1,331 mm
(Common and Preferred)
[CHART]
|
Debt |
|
Public Float |
|
Management/Insiders |
|
53% |
|
37% |
|
10% |
Data as of March 31, 2003.
30
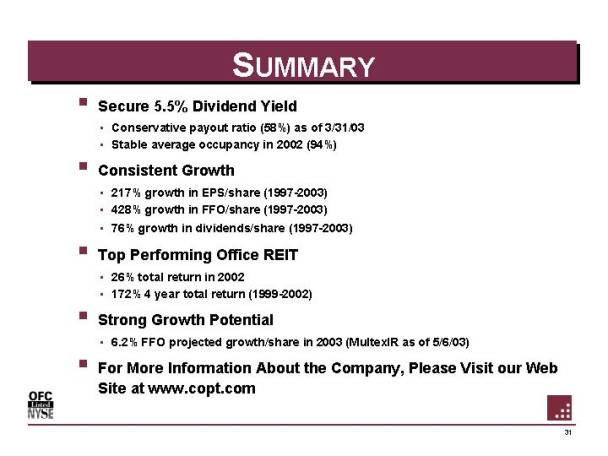
SUMMARY
• Secure 5.5% Dividend Yield
• Conservative payout ratio (58%) as of 3/31/03
• Stable average occupancy in 2002 (94%)
• Consistent Growth
• 217% growth in EPS/ share (1997-2003)
• 428% growth in FFO/ share (1997-2003)
• 76% growth in dividends/ share (1997-2003)
• Top Performing Office REIT
• 26% total return in 2002
• 172% 4 year total return (1999-2002)
• Strong Growth Potential
• 6.2% FFO projected growth/ share in 2003 (MultexIR as of 5/6/03)
• For More Information About the Company, Please Visit our Web Site at www.copt.com
31
DISCLOSURE
Footnote Regarding Reclassification In Connection With SFAS 141 Accounting
SFAS 141 was effective July 1, 2001 for acquisitions of operating real estate initiated after June 30, 2001. The effect of SFAS 141 on the Company’s accounting for in- place operating leases is as follows:
• Value is assigned to in-place operating leases to the extent that the future cash flows under the contractual lease terms are above or below market at the time of acquisition. For example, if the Company acquires a property, and the leases in place for that property carry rents below the market rent for such leases at the time of acquisition, the Company classifies the amount equal to the difference as deferred revenue, and increases the amount of the acquisition classified as investment in real estate. Conversely, if the leases in place for that property carry rents above the market rent, the Company classifies the amount equal to the difference as a deferred asset, and decreases the amount of the acquisition classified as investment in real estate. Deferred revenue or deferred assets recorded in connection with in-place operating leases of acquired properties are amortized into rental revenue over the life of the leases.
• In addition, value is assigned to the deemed cost avoidance of acquiring in-place operating leases. For example, when a new lease is entered into, the lessor typically incurs a number of origination costs in connection with the leases; such costs include tenant improvements and leasing costs. When a property is acquired with in-place leases, the origination costs for such leases were already incurred by the prior owner. Therefore, to recognize the value of these costs in recording a property acquisition, the Company assigns value to the tenant improvements and leasing costs associated with the remaining term of in- place operating leases. The value assigned reduces the amount of the acquisition classified as investment in real estate. The value assigned to the tenant improvements and leasing costs is depreciated or amortized over the life of the leases. Since the depreciation period for tenant improvements and amortization period for leasing costs is less than the depreciation period attributable to an investment in real estate, the effect of SFAS 141 is to increase depreciation and amortization expense until the tenant improvements and leasing costs have been fully depreciated or amortized, and to decrease depreciation and amortization expense afterwards.
32
DISCLOSURE
Footnote Regarding Reclassification In Connection With SFAS 141 Accounting con’t:
The Company reclassified certain items in connection with its accounting under SFAS 141 in the quarter ended March 31, 2003. The primary effects of the reclassification to the Company’s financial statements were as follows:
- since the in-place leases of properties acquired since July 1, 2001 were on average at below market rents, the application of SFAS 141 resulted in the Company recording net deferred revenue; and
- the Company recognized additional rental revenue in 2002 associated with the amortization of the deferred revenue described above and recognized depreciation and amortization expense on tenant improvements and leasing costs associated with in-place leases.
The Company is changing its presentation of the effects of SFAS 141 on the results of operations by reclassifying the depreciation of tenant improvements and amortization of leasing costs associated with in- place operating leases of acquired properties from rental revenue to depreciation and amortization expense. The Company believes that the revised presentation of the results of operations more closely reflects the economic substance of an acquisition transaction. This change in classification increases rental revenues for the periods reported, with an offsetting increase to depreciation and amortization expense.
The reclassification described above changes certain financial statements line items in the Statements of Operations and Statements of Cash Flows, as well as certain presentations of operating results and measures of performance that include rental revenue but exclude depreciation and amortization expense, that appear in the Registrant’s filings and earnings releases pertaining to 2002, including the Company’s FFO for the periods reported. However, such changes do not affect net income, EPS, AFFO, net cash flows and cash flows from operating activities.
33
DISCLOSURE
Definitions — Non GAAP Measure
|
Funds from Operations |
|
Funds from operations means net income (loss) computed using GAAP, excluding gains (or losses) from debt restructuring and sales of real estate, plus real estate- related depreciation and amortization and after adjustments for unconsolidated partnerships and joint ventures, although FFO includes gains (or losses) from sales of real estate to the extent such gains relate to sales of non- operating properties and development services provided on operating properties. Accounting for real estate assets using historical cost accounting under GAAP assumes that the value of real estate assets diminishes predictably over time. The National Association of Real Estate Trusts (“NAREIT”) stated in its April 2002 White Paper on Funds from Operations that “since real estate asset values have historically risen or fallen with market conditions, many industry investors have considered presentations of operating results for real estate companies that use historical cost accounting to be insufficient by themselves.” As a result, the concept of FFO was created by NAREIT for the REIT industry to “address this problem.” |
|
|
|
|
|
|
|
Since the Company agrees with the concept of FFO and appreciates the reason surrounding its creation, it believes that FFO is an important supplemental measure of operating performance. In addition, since most equity REITs provide FFO information to the investment community, the Company believes FFO is a useful supplemental measure for comparing the Company’s results to those of other equity REITs. The Company believes that net income is the GAAP measure most directly comparable to FFO. |
|
|
|
|
|
Adjusted Funds from Operations (AFFO) |
|
FFO adjusted for the following: straight- line rents, SFAS 141 revenues, and recurring capital expenditures. |
34
DISCLOSURE
Definitions — Non GAAP Measure
|
GAAP |
|
Generally accepted accounting principles. |
|
|
|
|
|
Industry Classification |
|
We classify the revenue from our leases into industry groupings based solely on Management’s knowledge of the tenants’ operations in leased space. Occasionally, classifications require subjective and complex judgments. For example, we have a tenant that is considered by many to be in the computer industry; however, since the nature of that tenant’s operations in the space leased from us is focused on providing service to the United State Government’s defense department, we classify the revenue we earn from the lease as Government defense/ defense contractor industry revenue. We do not use independent sources such as Standard Industrial Classification codes for classifying our revenue into industry groupings and if we did, the resulting groupings would be materially different. |
|
|
|
|
|
NAREIT |
|
National Association of Real Estate Investment Trusts |
|
|
|
|
|
Total Annualized Revenue |
|
Annualized rental revenue is a measure that we use to evaluate the source of our rental revenue as of a point-in-time. It is computed by multiplying the sum of monthly contractual base rent and estimated monthly expense reimbursements under active leases as of a point in time by 12. We consider annualized rental revenue to be a useful measure for analyzing revenue sources because, since it is point-in-time based, it would not contain increases and decreases in revenue associated with periods where leases where not in effect; historical GAAP revenue would contain such fluctuations. We find the measure particularly useful for tenant and segment analysis. We consider annualized rental revenue to be a statistical measure rather than a performance measure. Annualized rental revenue cannot be reconciled to GAAP measures since its computation is not derived from historical GAAP measures. |
35
DISCLOSURE
Definitions — Non GAAP Measure
|
FFO Payout Ratios |
|
Total dividends/distributions, exclusive of dividends for perpetual preferred equity which are deducted to calculate FFO and inclusive of dividends on restricted shares for certain periods, divided by FFO. |
|
|
|
|
|
AFFO Payout Ratios |
|
Total dividends/distributions, exclusive of dividends for perpetual preferred equity which are deducted to calculate AFFO and inclusive of dividends on restricted shares for certain periods, divided by AFFO. |
36
DISCLOSURE
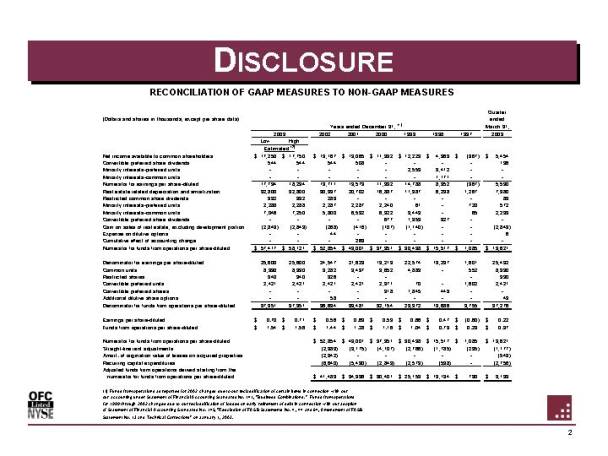
RECONCILIATION OF GAAP MEASURES TO NON-GAAP MEASURES
|
(Dollars and shares in thousands, except per share data) |
|
|
|
|
|
|
|
|
|
|
|
Quarter |
|
|||||||||||||||||||||||
|
|
|
Year ended December 31, (1) |
|
ended ended March 31, |
|
|||||||||||||||||||||||||||||||
|
|
|
2003 |
|
2002 |
|
2001 |
|
2000 |
|
1999 |
|
1998 |
|
1997 |
|
2003 |
|
|||||||||||||||||||
|
|
|
Low |
|
High |
|
|
|
|
|
|
|
|
|
|
|
|
|
|
|
|||||||||||||||||
|
|
|
High Estimated (2) |
|
|
|
|
|
|
|
|
|
|
|
|
|
|
|
|||||||||||||||||||
|
Net income available to common shareholders |
|
$ |
17,250 |
|
$ |
17,750 |
|
$ |
13,167 |
|
$ |
13,065 |
|
$ |
11,332 |
|
$ |
12,229 |
|
$ |
4,369 |
|
$ |
(967 |
) |
$ |
5,454 |
|
||||||||
|
Convertible preferred share dividends |
|
544 |
|
544 |
|
544 |
|
508 |
|
- |
|
- |
|
- |
|
- |
|
136 |
|
|||||||||||||||||
|
Minority interests-preferred units |
|
- |
|
- |
|
- |
|
- |
|
- |
|
2,559 |
|
3,412 |
|
- |
|
- |
|
|||||||||||||||||
|
Minority interests-common units |
|
- |
|
- |
|
- |
|
- |
|
- |
|
- |
|
1,171 |
|
- |
|
- |
|
|||||||||||||||||
|
Numerator for earnings per share-diluted |
|
17,794 |
|
18,294 |
|
13,711 |
|
13,573 |
|
11,332 |
|
14,788 |
|
8,952 |
|
(967 |
) |
5,590 |
|
|||||||||||||||||
|
Real estate related depreciation and amortization |
|
32,800 |
|
32,800 |
|
30,997 |
|
20,702 |
|
16,887 |
|
11,987 |
|
6,238 |
|
1,267 |
|
7,980 |
|
|||||||||||||||||
|
Restricted common share dividends |
|
332 |
|
332 |
|
283 |
|
- |
|
- |
|
- |
|
- |
|
- |
|
83 |
|
|||||||||||||||||
|
Minority interests-preferred units |
|
2,288 |
|
2,288 |
|
2,287 |
|
2,287 |
|
2,240 |
|
61 |
|
- |
|
720 |
|
572 |
|
|||||||||||||||||
|
Minority interests-common units |
|
7,046 |
|
7,250 |
|
5,800 |
|
6,592 |
|
6,322 |
|
3,449 |
|
- |
|
65 |
|
2,233 |
|
|||||||||||||||||
|
Convertible preferred share dividends |
|
- |
|
- |
|
- |
|
- |
|
677 |
|
1,353 |
|
327 |
|
- |
|
- |
|
|||||||||||||||||
|
Gain on sales of real estate, excluding development portion |
|
(2,843 |
) |
(2,843 |
) |
(268 |
) |
(416 |
) |
(107 |
) |
(1,140 |
) |
- |
|
- |
|
(2,843 |
) |
|||||||||||||||||
|
Expense on dilutive options |
|
- |
|
- |
|
44 |
|
- |
|
- |
|
- |
|
- |
|
- |
|
6 |
|
|||||||||||||||||
|
Cumulative effect of accounting change |
|
- |
|
- |
|
- |
|
263 |
|
- |
|
- |
|
- |
|
- |
|
- |
|
|||||||||||||||||
|
Numerator for funds from operations per share-diluted |
|
$ |
57,417 |
|
$ |
58,121 |
|
$ |
52,854 |
|
$ |
43,001 |
|
$ |
37,351 |
|
$ |
30,498 |
|
$ |
15,517 |
|
$ |
1,085 |
|
$ |
13,621 |
|
||||||||
|
|
|
|
|
|
|
|
|
|
|
|
|
|
|
|
|
|
|
|
|
|||||||||||||||||
|
Denominator for earnings per share-diluted |
|
25,600 |
|
25,600 |
|
24,547 |
|
21,623 |
|
19,213 |
|
22,574 |
|
19,237 |
|
1,601 |
|
25,492 |
|
|||||||||||||||||
|
Common units |
|
8,990 |
|
8,990 |
|
9,282 |
|
9,437 |
|
9,652 |
|
4,883 |
|
- |
|
552 |
|
8,990 |
|
|||||||||||||||||
|
Restricted shares |
|
340 |
|
340 |
|
326 |
|
- |
|
- |
|
- |
|
- |
|
- |
|
330 |
|
|||||||||||||||||
|
Convertible preferred units |
|
2,421 |
|
2,421 |
|
2,421 |
|
2,421 |
|
2,371 |
|
70 |
|
- |
|
1,602 |
|
2,421 |
|
|||||||||||||||||
|
Convertible preferred shares |
|
- |
|
- |
|
- |
|
- |
|
918 |
|
1,845 |
|
449 |
|
- |
|
- |
|
|||||||||||||||||
|
Additional dilutive share options |
|
- |
|
- |
|
58 |
|
- |
|
- |
|
- |
|
- |
|
- |
|
43 |
|
|||||||||||||||||
|
Denominator for funds from operations per share-diluted |
|
37,351 |
|
37,351 |
|
36,634 |
|
33,481 |
|
32,154 |
|
29,372 |
|
19,686 |
|
3,755 |
|
37,276 |
|
|||||||||||||||||
|
|
|
|
|
|
|
|
|
|
|
|
|
|
|
|
|
|
|
|
|
|||||||||||||||||
|
Earnings per share-diluted |
|
$ |
0.70 |
|
$ |
0.71 |
|
$ |
0.56 |
|
$ |
0.63 |
|
$ |
0.59 |
|
$ |
0.66 |
|
$ |
0.47 |
|
$ |
(0.60 |
) |
$ |
0.22 |
|
||||||||
|
Funds from operations per share-diluted |
|
$ |
1.54 |
|
$ |
1.56 |
|
$ |
1.44 |
|
$ |
1.28 |
|
$ |
1.16 |
|
$ |
1.04 |
|
$ |
0.79 |
|
$ |
0.29 |
|
$ |
0.37 |
|
||||||||
|
|
|
|
|
|
|
|
|
|
|
|
|
|
|
|
|
|
|
|
|
|||||||||||||||||
|
Numerator for funds from operations per share-diluted |
|
|
|
|
|
$ |
52,854 |
|
$ |
43,001 |
|
$ |
37,351 |
|
$ |
30,498 |
|
$ |
15,517 |
|
$ |
1,085 |
|
$ |
13,621 |
|
||||||||||
|
Straight-line rent adjustments |
|
|
|
|
|
(2,389 |
) |
(3,175 |
) |
(4,107 |
) |
(2,766 |
) |
(1,785 |
) |
(295 |
) |
(1,177 |
) |
|||||||||||||||||
|
Amort. of origination value of leases on acquired properties |
|
|
|
|
|
(2,342 |
) |
- |
|
- |
|
- |
|
- |
|
- |
|
(549 |
) |
|||||||||||||||||
|
Recurring capital expenditures |
|
|
|
|
|
(6,640 |
) |
(5,430 |
) |
(2,843 |
) |
(2,579 |
) |
(538 |
) |
- |
|
(2,756 |
) |
|||||||||||||||||
|
Adjusted funds from operations derived starting from the numerator for funds from operations per share-diluted |
|
|
|
|
|
$ |
41,483 |
|
$ |
34,396 |
|
$ |
30,401 |
|
$ |
25,153 |
|
$ |
13,194 |
|
$ |
790 |
|
$ |
9,139 |
|
||||||||||
(1) Funds from operations as reported for 2002 changed due to our reclassification of certain items in connection with our our accounting under Statement of Financial Accounting Standards No. 141, "Business Combinations." Funds from operations for 1999 through 2002 changed due to our reclassification of losses on early retirement of debt in connection with our adoption of Statement of Financial Accounting Standards No. 145, "Rescission of FASB Statements No. 4 , 44 and 64, Amendment of FASB Statement No. 13 and Technical Corrections" on January 1, 2003.
(2) These estimates are based on Company guidance previously provided.
37