
UNITED STATES SECURITIES AND EXCHANGE COMMISSION
Washington, D.C. 20549
FORM 10-K
ANNUAL REPORT PURSUANT TO SECTIONS 13 OR 15(d) OF THE SECURITIES EXCHANGE ACT OF 1934
| (Mark one) | |
ý |
ANNUAL REPORT PURSUANT TO SECTION 13 OR 15(d) OF THE SECURITIES EXCHANGE ACT OF 1934 |
For the fiscal year ended December 31, 2007 |
|
or |
|
o |
TRANSITION REPORT PURSUANT TO SECTION 13 OR 15(d) OF THE SECURITIES EXCHANGE ACT OF 1934 |
For the transition period from to |
|
Commission file number 1-14023
Corporate Office Properties Trust
(Exact name of registrant as specified in its charter)
| Maryland (State or other jurisdiction of incorporation or organization) |
23-2947217 (IRS Employer Identification No.) |
|
6711 Columbia Gateway Drive, Suite 300 Columbia, MD (Address of principal executive offices) |
21046 (Zip Code) |
Registrant's telephone number, including area code: (443) 285-5400
Securities registered pursuant to Section 12(b) of the Act:
| (Title of Each Class) |
(Name of Exchange on Which Registered) |
|
|---|---|---|
| Common Shares of beneficial interest, $0.01 par value | New York Stock Exchange | |
| Series G Cumulative Redeemable Preferred Shares of beneficial interest, $0.01 par value | New York Stock Exchange | |
| Series H Cumulative Redeemable Preferred Shares of beneficial interest, $0.01 par value | New York Stock Exchange | |
| Series J Cumulative Redeemable Preferred Shares of beneficial interest, $0.01 par value | New York Stock Exchange |
Securities registered pursuant to Section 12(g) of the Act: None
Indicate by check mark if the registrant is a well-known seasoned issuer, as defined in Rule 405 of the Securities Act. ý Yes o No
Indicate by check mark if the registrant is not required to file reports pursuant to Section 13 or Section 15(d) of the Exchange Act. o Yes ý No
Indicate by check mark whether the registrant (1) has filed all reports required to be filed by Section 13 or 15(d) of the Securities Exchange Act of 1934 during the preceding 12 months (or for such shorter period that the registrant was required to file such reports), and (2) has been subject to such filing requirements for the past 90 days. ý Yes o No
Indicate by check mark if disclosure of delinquent filers pursuant to Item 405 of Regulation S-K is not contained herein, and will not be contained, to the best of registrant's knowledge, in definitive proxy or information statements incorporated by reference in Part III of this Form 10-K or any amendment to this Form 10-K. o
Indicate by check mark whether the registrant is a large accelerated filer, an accelerated filer, a non-accelerated filer, or a smaller reporting company. See definition of "large accelerated filer," "accelerated filer" and "smaller reporting company" in Rule 12b-2 of the Exchange Act. (Check One):
| Large accelerated filer ý | Accelerated filer o | Non-accelerated filer o (Do not check if a smaller reporting company) |
Smaller reporting company o |
Indicate by check mark whether the registrant is a shell company (as defined in Rule 12b-2 of the Exchange Act.) o Yes ý No
The aggregate market value of the voting and nonvoting common equity held by non-affiliates of the registrant was approximately $1.9 billion, as calculated using the closing price of the common shares of beneficial interest on the New York Stock Exchange and our outstanding shares as of June 29, 2007; for purposes of calculating this amount only, affiliates are defined as Trustees, executive owners and beneficial owners of more than 10% of the registrant's outstanding common shares of beneficial interest. At January 31, 2008, 47,383,967 of the registrant's common shares of beneficial interest, $0.01 par value, were outstanding.
Portions of the annual shareholder report for the year ended December 31, 2007 are incorporated by reference into Parts I and II of this Form 10-K and portions of the proxy statement of the registrant for its 2008 Annual Meeting of Shareholders to be filed within 120 days after the end of the fiscal year covered by this Form 10-K are incorporated by reference into Part III of this Form 10-K.
| |
|
|
|||
|---|---|---|---|---|---|
| PART I | |||||
ITEM 1. |
BUSINESS |
4 |
|||
| ITEM 1A. | RISK FACTORS | 10 | |||
| ITEM 1B. | UNRESOLVED STAFF COMMENTS | 19 | |||
| ITEM 2. | PROPERTIES | 20 | |||
| ITEM 3. | LEGAL PROCEEDINGS | 34 | |||
| ITEM 4. | SUBMISSION OF MATTERS TO A VOTE OF SECURITY HOLDERS | 35 | |||
PART II |
|||||
ITEM 5. |
MARKET FOR REGISTRANT'S COMMON EQUITY, RELATED STOCKHOLDER MATTERS AND ISSUER PURCHASES OF EQUITY SECURITIES |
35 |
|||
| ITEM 6. | SELECTED FINANCIAL DATA | 37 | |||
| ITEM 7. | MANAGEMENT'S DISCUSSION AND ANALYSIS OF FINANCIAL CONDITION AND RESULTS OF OPERATIONS | 39 | |||
| ITEM 7A. | QUANTITATIVE AND QUALITATIVE DISCLOSURES ABOUT MARKET RISK | 72 | |||
| ITEM 8. | FINANCIAL STATEMENTS AND SUPPLEMENTARY DATA | 73 | |||
| ITEM 9. | CHANGES IN AND DISAGREEMENTS WITH ACCOUNTANTS ON ACCOUNTING AND FINANCIAL DISCLOSURE | 73 | |||
| ITEM 9A. | CONTROLS AND PROCEDURES | 73 | |||
| ITEM 9B. | OTHER INFORMATION | 74 | |||
PART III |
|||||
ITEM 10. |
DIRECTORS, EXECUTIVE OFFICERS AND CORPORATE GOVERNANCE |
74 |
|||
| ITEM 11. | EXECUTIVE COMPENSATION | 74 | |||
| ITEM 12. | SECURITY OWNERSHIP OF CERTAIN BENEFICIAL OWNERS AND MANAGEMENT AND RELATED STOCKHOLDER MATTERS | 74 | |||
| ITEM 13. | CERTAIN RELATIONSHIPS AND RELATED TRANSACTIONS, AND DIRECTOR INDEPENDENCE | 74 | |||
| ITEM 14. | PRINCIPAL ACCOUNTANT FEES AND SERVICES | 74 | |||
PART IV |
|||||
ITEM 15. |
EXHIBITS AND FINANCIAL STATEMENT SCHEDULES |
74 |
|||
2
This Form 10-K contains "forward-looking" statements, as defined in the Private Securities Litigation Reform Act of 1995, that are based on our current expectations, estimates and projections about future events and financial trends affecting the financial condition and operations of our business. Forward-looking statements can be identified by the use of words such as "may," "will," "should," "expect," "estimate" or other comparable terminology. Forward-looking statements are inherently subject to risks and uncertainties, many of which we cannot predict with accuracy and some of which we might not even anticipate. Although we believe that the expectations, estimates and projections reflected in such forward-looking statements are based on reasonable assumptions at the time made, we can give no assurance that these expectations, estimates and projections will be achieved. Future events and actual results may differ materially from those discussed in the forward-looking statements. Important factors that may affect these expectations, estimates and projections include, but are not limited to:
For further information on factors that could affect the company and the statements contained herein, you should refer to the section below entitled "Item 1A. Risk Factors." We undertake no obligation to update or supplement forward-looking statements.
3
OUR COMPANY
General. We are a fully-integrated and self-managed real estate investment trust ("REIT") that focuses on the acquisition, development, ownership, management and leasing of suburban office properties in select markets and submarkets. We also focus on servicing the multi-location requirements of strategic customers and strategic industries in which tenants have specialized product requirements. Our properties are typically concentrated in large office parks located in demographically strong markets and submarkets and/or near demand drivers for strategic customers and industries. As of December 31, 2007, our investments in real estate included the following:
We conduct almost all of our operations through our operating partnership, Corporate Office Properties, L.P. (the "Operating Partnership"), a Delaware limited partnership, of which we are the managing general partner. The Operating Partnership owns real estate both directly and through subsidiary partnerships and limited liability companies ("LLCs"). The Operating Partnership also owns 100% of Corporate Office Management, Inc. ("COMI") and owns, either directly or through COMI, 100% of the following entities that provide real estate services primarily to us but also to third parties (collectively defined as the "Service Companies"): COPT Property Management Services, LLC ("CPM"), COPT Development & Construction Services, LLC ("CDC"), Corporate Development Services, LLC ("CDS") and COPT Environmental Systems, LLC ("CES").
Interests in our Operating Partnership are in the form of common and preferred units. As of December 31, 2007, we owned approximately 84.7% of the outstanding common units and approximately 95.8% of the outstanding preferred units in our Operating Partnership. The remaining common and preferred units in our Operating Partnership were owned by third parties, which included certain of our Trustees.
We believe that we are organized and have operated in a manner that permits us to satisfy the requirements for taxation as a REIT under the Internal Revenue Code of 1986, as amended, and we
4
intend to continue to operate in such a manner. If we qualify for taxation as a REIT, we generally will not be subject to Federal income tax on our taxable income that is distributed to our shareholders. A REIT is subject to a number of organizational and operational requirements, including a requirement that it distribute to its shareholders at least 90% of its annual taxable income (excluding net capital gains).
Our executive offices are located at 6711 Columbia Gateway Drive, Suite 300, Columbia, Maryland 21046 and our telephone number is (443) 285-5400.
Corporate Office Properties Trust's Internet address is www.copt.com. We make available on our Internet website free of charge our annual report on Form 10-K, quarterly reports on Form 10-Q, current reports on Form 8-K and amendments to those reports filed or furnished pursuant to Section 13(a) or 15(d) of the Exchange Act as soon as reasonably possible after we file such material with the Securities and Exchange Commission. In addition, we have made available on our Internet website under the heading "Corporate Governance" the charters for our Board of Trustees' Audit Committee, Nominating and Corporate Governance Committee and Compensation Committee, as well as our Corporate Governance Guidelines, Code of Business Conduct and Ethics and Code of Ethics for Financial Officers. We intend to make available on our website any future amendments or waivers to our Code of Business Conduct and Ethics and Code of Ethics for Financial Officers within four business days after any such amendments or waivers. The information on our Internet site is not part of this report.
The Securities and Exchange Commission (the "SEC") maintains an Internet website that contains reports, proxy and information statements and other information regarding issuers that file electronically with the SEC. This Internet website can be accessed at www.sec.gov. The public may also read and copy paper filings that we have made with the SEC at the SEC's Public Reference Room. Information on the operation of the Public Reference Room may be obtained by calling (800) SEC-0330.
Significant 2007 Developments
During 2007, we:
5
Subsequent Events
Subsequent to December 31, 2007, we:
Corporate Objectives and Strategies
Our primary objectives are to achieve sustainable long-term growth in results of operations and to maximize long-term shareholder value. Important elements of our strategy are set forth below:
Market Strategy. We typically concentrate our operations in markets and submarkets where we believe that we already possess or can achieve the critical mass necessary to maximize management efficiencies, operating synergies and competitive advantages through our acquisition, property management, leasing and development programs. The attributes we look for in selecting markets and submarkets include, among others: (1) proximity to large demand drivers; (2) strong demographics; (3) attractiveness to high quality tenants, including strategic customers and strategic industries; (4) potential for growth and stability in economic down cycles; and (5) future acquisition and development opportunities. When we select a market or submarket, our strategy generally involves establishing an initial presence by acquiring properties in that market or submarket and then increasing our ownership through future acquisitions and development. We typically focus on owning and operating properties in business parks located outside of central business districts. We believe that such parks generally attract long-term, high-quality tenants seeking to attract and retain quality work forces
6
because they are typically situated along major transportation routes with easy access to support services, amenities and residential communities.
Customer Strategy. We focus on establishing, maintaining and expanding strategic customer relationships in multiple locations with tenants that are large, financially sound entities with significant long-term space requirements. We believe that we differentiate ourselves from our competitors through our commitment to outstanding customer service, trust and integrity. We believe that this strategy enables us to establish long-term relationships with quality tenants and enhances our ability to become the landlord of choice in our targeted markets. To enhance the stability of our cash flow, we typically structure our leases with terms ranging from three to ten years. Given the terms of our leases, we monitor the timing of our lease maturities with the goal being that such timing should not be highly concentrated in any given one-year or five-year period.
Industry Strategy. As an outgrowth of our customer strategy, we also focus on strategic industries in which tenants have specialized product requirements. For example, a high concentration of our revenues is generated from tenants in the United States defense industry (comprised of the United States Government and defense contractors), predominantly in defense information technology. These tenants are particularly interested in a number of our property submarkets that are located near government installations. We also enable these tenants to benefit from our significant experience in constructing and operating secure properties and properties that meet the United States Government's Force Protection requirements. We believe that this experience coupled with our existing relationships in the United States defense industry position us well to continue and grow in this industry. We seek to reinforce and expand our relationships with current and prospective tenants in this industry, while monitoring our levels of concentration from a business risk perspective.
Tenant Service Strategy. Another outgrowth of our customer service strategy is our tenant service strategy, in which we seek to capitalize on our geographic focus and critical mass of properties in our core regions by providing high level, comprehensive services to our tenants. We conduct most of our tenant services activities through our subsidiary service companies. We believe that providing quality services is an integral part of our goal to achieve consistently high levels of tenant satisfaction and retention and, again, position ourselves as a landlord of choice.
Acquisition Strategies. We pursue the acquisition of suburban office properties through a three-part acquisition strategy. This strategy includes targeting: (1) entity acquisitions of significant portfolios along with their management to establish prominent ownership positions in new neighboring regions and enhance our management infrastructure; (2) portfolio purchases to enhance our existing submarket positions as well as enter selective new neighboring regions; and (3) opportunistic acquisitions of individual properties in our existing regions. We also pursue acquisition opportunities for properties that meet the multi-location requirements of our strategic customers and strategic industries. We typically seek to make acquisitions at attractive yields and below replacement cost. We also often seek to increase cash flow and enhance the underlying value of acquisitions through repositioning the properties and capitalizing on existing below market leases and expansion opportunities.
Property Development Strategies. We balance our acquisition program through selective development and expansion of suburban office properties as market conditions and leasing opportunities support favorable risk-adjusted returns. We generally develop sites that are located near our existing properties. We believe that developing such sites enhances our ability to effectively meet tenant needs and efficiently provide critical tenant services. We also develop sites acquired in other locations in order to meet the multi-location requirements of our strategic customers and strategic industries.
7
Internal Growth Strategies. We aggressively manage our portfolio to maximize the operating performance of each property through: (1) proactive property management and leasing; (2) achieving operating efficiencies through increasing economies of scale and, where possible, aggregating vendor contracts to achieve volume pricing discounts; (3) renewing tenant leases and re-tenanting at increased rents where market conditions permit; and (4) expanding our tenant and real estate service capabilities.
Financing Policy
Our financing policy is aimed at maintaining a flexible capital structure in order to facilitate consistent growth and performance in the face of differing market conditions in the most cost-effective manner. Key components of our policy are set forth below:
Debt
For information relating to future maturities of our debt, you should refer to the sections of this report entitled "Management's Discussion and Analysis of Financial Condition and Results of Operations" and "Quantitative and Qualitative Disclosures about Market Risk," as well as Note 9 to our Consolidated Financial Statements and notes thereto, which is located in a separate section at the end of this report beginning on page F-1.
8
Industry Segments
We operate in one primary industry: suburban office real estate. At December 31, 2007, our suburban office real estate operations had nine primary geographical segments, as set forth below:
As of December 31, 2007, 138 of our wholly owned properties were located in what is widely known as the Greater Washington, D.C. region, which includes the first four regions set forth above, and 64 were located in neighboring Suburban Baltimore. At December 31, 2007, we also owned 13 wholly owned properties in Colorado Springs and two in San Antonio. In addition, we owned eight properties in total as of December 31, 2007 in the last two locations set forth above that are considered non-core to the Company. For information relating to these geographic segments, you should refer to Note 16 to our Consolidated Financial Statements, which is included in a separate section at the end of this report beginning on page F-1.
Employees
As of December 31, 2007, we had 351 employees. We believe that our relations with our employees are good.
Competition
The commercial real estate market is highly competitive. Numerous commercial properties compete with our properties for tenants. Some of the properties competing with ours may be newer or have more desirable locations, or the competing properties' owners may be willing to accept lower rents than are acceptable to us. In addition, the competitive environment for leasing is affected considerably by a number of factors including, among other things, changes in economic factors and supply and demand of space. These factors may make it difficult for us to lease existing vacant space and space associated with future lease expirations at rental rates that are sufficient to meeting our short-term capital needs.
We also compete for the purchase of commercial property with many entities, including other publicly-traded commercial REITs. Many of our competitors have substantially greater financial resources than ours. In addition, our competitors may be willing to accept lower returns on their
9
investments. If our competitors prevent us from buying properties that we have targeted for acquisition, we may not be able to meet our property acquisition goals.
Set forth below are risks and uncertainties relating to our business and the ownership of our securities. You should carefully consider each of the risks and uncertainties below and all of the information in this Form 10-K and its Exhibits, including our Consolidated Financial Statements and notes thereto for the year ended December 31, 2007, which are included in a separate section at the end of this report beginning on page F-1.
We may suffer adverse consequences as a result of our reliance on rental revenues for our income. We earn revenue from renting our properties. Our operating costs do not necessarily fluctuate in relation to changes in our rental revenue. This means that our costs will not necessarily decline and may increase even if our revenues decline.
For new tenants or upon lease expiration for existing tenants, we generally must make improvements and pay other tenant-related costs for which we may not receive increased rents. We also make building-related capital improvements for which tenants may not reimburse us.
If our properties do not generate revenue sufficient to meeting our operating expenses and capital costs, we may have to borrow additional amounts to cover these costs. In such circumstances, we would likely have lower profits or possibly incur losses. We may also find in such circumstances that we are unable to borrow to cover such costs, in which case our operations could be adversely affected. Moreover, there may be less or no cash available for distributions to our shareholders.
In addition, the competitive environment for leasing is affected considerably by a number of factors including, among other things, changes due to economic factors and supply and demand of space. These factors may make it difficult for us to lease existing vacant space and space associated with future lease expirations at rental rates that are sufficient to meeting our short-term capital needs.
Adverse developments concerning some of our major tenants and industry concentrations could have a negative impact on our revenue. As of December 31, 2007, 20 tenants accounted for 54.8% of the total annualized rental revenue of our wholly owned properties, excluding owner-occupied leasing activity, and our five largest of these tenants accounted for 35.0% of that total. We computed the annualized rental revenue by multiplying by 12 the sum of monthly contractual base rents and estimated monthly expense reimbursements under active leases in our portfolio of wholly owned properties as of December 31, 2007. We consider annualized rental revenue to be a useful measure for analyzing revenue sources because, since it is point-in-time based, it does not contain increases and decreases in revenue associated with periods in which lease terms were not in effect; historical revenue under GAAP does contain such fluctuations. We find the measure particularly useful for leasing, tenant, segment and industry analysis. Information regarding our five largest tenants is set forth below:
| Tenant |
Annualized Rental Revenue at December 31, 2007 |
Percentage of Total Annualized Rental Revenue of Wholly Owned Properties |
Number of Leases |
||||
|---|---|---|---|---|---|---|---|
| |
(in thousands) |
|
|
||||
| United States of America | $ | 57,395 | 16.3 | % | 62 | ||
| Northrop Grumman Corporation(1) | 26,199 | 7.4 | % | 17 | |||
| Booz Allen Hamilton, Inc. | 19,568 | 5.5 | % | 8 | |||
| Computer Sciences Corporation(1) | 11,446 | 3.2 | % | 4 | |||
| Unisys Corporation | 8,843 | 2.5 | % | 4 | |||
10
If any of our five largest tenants fail to make rental payments to us or if the United States Government elects to terminate several of its leases and the space cannot be re-leased on satisfactory terms, there would be an adverse effect on our financial performance and ability to make distributions to our shareholders.
As of December 31, 2007, the United States defense industry (comprising the United States Government and defense contractors) accounted for approximately 47.9% of the total annualized rental revenue of our wholly owned properties. Most of the 16.3% of our total annualized rental revenue that we derived from leases with agencies of the United States Government as of December 31, 2007 is included in the 47.9% of our total annualized revenue from the United States defense industry. We classify the revenue from our leases into industry groupings based solely on management's knowledge of the tenants' operations in leased space. Occasionally, classifications require subjective and complex judgments. For example, we have a tenant that is considered by many to be in the computer industry; however, since the nature of that tenant's operations in the space leased from us is focused on providing service to the United States Government's defense department, we classify the revenue we earn from the lease as United States defense industry revenue. We do not use independent sources such as Standard Industrial Classification codes for classifying our revenue into industry groupings and if we did, the resulting groupings would be materially different.
We have become increasingly reliant on defense industry tenants in recent years due primarily to: (1) increased activity in that industry following the events of September 11, 2001; (2) the strong presence of the industry in a number of our submarkets; and (3) our strategy to form strategic alliances with tenants in that industry. The percentage of our total annualized rental revenue derived from the defense industry could continue to increase. A reduction in government spending for defense could affect the ability of these tenants to fulfill lease obligations or decrease the likelihood that these tenants will renew their leases. In the case of the United States Government, a reduction in government spending could result in the early termination of leases. Such occurrences could have an adverse effect on our results of operations, financial condition, cash flows and ability to make distributions to our shareholders.
We rely on the ability of our tenants to pay rent and would be harmed by their inability to do so. Our performance depends on the ability of our tenants to fulfill their lease obligations by paying their rental payments in a timely manner. In addition, as noted above, we rely on a few major tenants for a large percentage of our total rental revenue. If one of our major tenants, or a number of our smaller tenants, were to experience financial difficulties, including bankruptcy, insolvency or general downturn of business, there could be an adverse effect on our financial performance and ability to make expected distributions to shareholders.
Most of our properties are geographically concentrated in the Mid-Atlantic region, particularly in the Greater Washington, D.C. region and neighboring Suburban Baltimore, or in particular office parks. We may suffer economic harm in the event of a decline in the real estate market or general economic conditions in those regions. Most of our properties are located in the Mid-Atlantic region of the United States and, as of December 31, 2007, our properties located in the Greater Washington, D.C. region and neighboring Suburban Baltimore accounted for a combined 87.5% of our total annualized rental revenue from wholly owned properties. Our properties are also typically concentrated in office parks in which we own most of the properties. Consequently, we do not have a broad geographic distribution of our properties. As a result, a decline in the real estate market or general economic conditions in the Mid-Atlantic region, the Greater Washington, D.C. region or the office parks in which our properties are located could have an adverse effect on our financial position, results of operations, cash flows and ability to make expected distributions to our shareholders.
11
We would suffer economic harm if we were unable to renew our leases on favorable terms. When leases expire for our properties, our tenants may not renew or may renew on terms less favorable to us than the terms of their original leases. If a tenant vacates a property, we can expect to experience a vacancy for some period of time, as well as higher capital costs than if a tenant renews. As a result, our financial performance and ability to make expected distributions to our shareholders could be adversely affected if we experience a high volume of tenant departures at the end of their lease terms. Set forth below are the percentages of total annualized rental revenue from wholly owned properties as of December 31, 2007 that are subject to scheduled lease expirations in each of the next five years:
| 2008 | 11.2 | % | |
| 2009 | 14.3 | % | |
| 2010 | 13.3 | % | |
| 2011 | 8.7 | % | |
| 2012 | 14.7 | % |
Most of the leases with our largest tenant, the United States Government, which account for 16.3% of our total annualized rental revenue in wholly owned properties at December 31, 2007, provide for consecutive one-year terms or provide for early termination rights. All of the leasing statistics set forth above assume that the United States Government will remain in the space that it leases through the end of the respective arrangements, without ending consecutive one-year leases prematurely or exercising early termination rights. We report the statistics in this manner since we manage our leasing activities using these same assumptions and believe these assumptions to be probable.
We may not be able to compete successfully with other entities that operate in our industry. The commercial real estate market is highly competitive. We compete for the purchase of commercial property with many entities, including other publicly traded commercial REITs. Many of our competitors have substantially greater financial resources than we do. If our competitors prevent us from buying properties that we target for acquisition, we may not be able to meet our property acquisition and development goals. Moreover, numerous commercial properties compete for tenants with our properties. Some of the properties competing with ours may have newer or more desirable locations, or the competing properties' owners may be willing to accept lower rates than are acceptable to us. Competition for property acquisitions, or for tenants in properties that we own, could have an adverse effect on our financial performance and distributions to our shareholders.
We may be unable to successfully execute our plans to acquire existing commercial real estate properties. We intend to acquire existing commercial real estate properties to the extent that suitable acquisitions can be made on advantageous terms. Acquisitions of commercial properties entail risks, such as the risks that we may not be in a position, or have the opportunity in the future, to make suitable property acquisitions on advantageous terms and that such acquisitions will fail to perform as expected. The failure of our acquisitions to perform as expected could adversely affect our financial performance and our ability to make distributions to our shareholders.
We may suffer economic harm as a result of making unsuccessful acquisitions in new markets. We expect to pursue selective acquisitions of properties in regions where we have not previously owned properties. These acquisitions may entail risks in addition to those we face in other acquisitions where we are familiar with the regions, such as the risk that we do not correctly anticipate conditions or trends in a new region and are therefore not able to operate the acquired property profitably. If this occurs, it could adversely affect our financial performance and our ability to make distributions to our shareholders.
We may be unable to execute our plans to develop and construct additional properties. Although the majority of our investments are in currently leased properties, we also develop, construct and
12
renovate properties, including some that are not fully pre-leased. When we develop, construct and renovate properties, we assume the risk that actual costs will exceed our budgets, that we will experience delays and that projected leasing will not occur, any of which could adversely affect our financial performance and our ability to make distributions to our shareholders. In addition, we generally do not obtain construction financing commitments until the development stage of a project is complete and construction is about to commence. We may find that we are unable to obtain financing needed to continue with the construction activities for such projects.
Certain of our properties containing data centers contain space not suitable for lease other than as data centers, which could make it difficult to reposition them for alternative use. Certain of our properties contain data center space, which is highly specialized space containing extensive electrical and mechanical systems that are designed uniquely to run and maintain banks of computer servers. As a result, in the event we needed to reposition such data center space to being office or industrial rental space, major renovations and expenditures would be required in order for us to prepare the space for re-lease or for us to sell to a buyer for use other than as data center space.
We may suffer economic harm as a result of the actions of our joint venture partners. We invest in certain entities in which we are not the exclusive investor or principal decision maker. As of December 31, 2007, we owned 17 fully operational properties and four properties under construction or redevelopment, and control land for future development, through joint ventures. We also continue to pursue new investments in real estate through joint ventures. Aside from our inability to unilaterally control the operations of joint ventures, our investments in joint ventures entail the additional risks that (1) the other parties to these investments may not fulfill their financial obligations as investors, in which case we may need to fund such parties' share of additional capital requirements and (2) the other parties to these investments may take actions that are inconsistent with our objectives, either of which could have an adverse effect on our financial condition, results of operations, cash flows and ability to make expected distributions to our shareholders.
We are subject to possible environmental liabilities. We are subject to various Federal, state and local environmental laws. These laws can impose liability on property owners or operators for the costs of removal or remediation of hazardous substances released on a property, even if the property owner was not responsible for the release of the hazardous substances. Costs resulting from environmental liability could be substantial. The presence of hazardous substances on our properties may also adversely affect occupancy and our ability to sell or borrow against those properties. In addition to the costs of government claims under environmental laws, private plaintiffs may bring claims for personal injury or other reasons. Additionally, various laws impose liability for the costs of removal or remediation of hazardous substances at the disposal or treatment facility. Anyone who arranges for the disposal or treatment of hazardous substances at such a facility is potentially liable under such laws. These laws often impose liability on an entity even if the facility was not owned or operated by the entity.
Real estate investments are illiquid, and we may not be able to sell our properties on a timely basis when we determine it is appropriate to do so. Real estate investments can be difficult to sell and convert to cash quickly, especially if market conditions are depressed. Such illiquidity will tend to limit our ability to vary our portfolio of properties promptly in response to changes in economic or other conditions. Moreover, under certain circumstances, the Internal Revenue Code imposes certain penalties on a REIT that sells property held for less than four years. In addition, for certain of our properties that we acquired by issuing units in our Operating Partnership, we are restricted by agreements with the sellers of the properties for a certain period of time from entering into transactions (such as the sale or refinancing of the acquired property) that will result in a taxable gain to the sellers without the seller's consent. Due to all of these factors, we may be unable to sell a property at an advantageous time.
13
We are subject to other possible liabilities that would adversely affect our financial position and cash flows. Our properties may be subject to other risks related to current or future laws, including laws benefiting disabled persons, and state or local laws relating to zoning, construction and other matters. These laws may require significant property modifications in the future for which we may not have budgeted and could result in the levy of fines against us. In addition, although we believe that we adequately insure our properties, we are subject to the risk that our insurance may not cover all of the costs to restore a property that is damaged by a fire or other catastrophic events, including acts of war or terrorism. The occurrence of any of these events could have an adverse effect on our financial condition, results of operations, cash flows and ability to make expected distributions to our shareholders.
We may be subject to increased costs of insurance and limitations on coverage regarding acts of terrorism. Our portfolio of properties is insured for losses under our property, casualty and umbrella insurance policies through September 30, 2008. These policies include coverage for acts of terrorism. Future changes in the insurance industry's risk assessment approach and pricing structure may increase the cost of insuring our properties and decrease the scope of insurance coverage, either of which could adversely affect our financial position and operating results.
We may suffer adverse effects as a result of the indebtedness that we carry and the terms and covenants that relate to this debt. We have in the past operated with slightly higher debt levels than other REITs. Operating with higher debt levels could make it difficult to obtain additional financing when required and could also make us more vulnerable to an economic downturn. The majority of our properties are either collateralized or identified by us to support repayment on indebtedness. In addition, we rely on borrowings to fund some or all of the costs of new property acquisitions, construction and development activities and other items. Our organizational documents do not limit the amount of indebtedness that we may incur. As of December 31, 2007, our total outstanding debt was $1.8 billion and our debt to total assets (defined as (1) the sum of mortgage and other loans and exchangeable senior notes divided by (2) total assets) was 62.3%.
Payments of principal and interest on our debt may leave us with insufficient cash to operate our properties or pay distributions to our shareholders required to maintain our qualification as a REIT. We are also subject to the risks that:
Some of our debt is secured by not just one property but, rather, a group of properties. Some of our debt is cross-defaulted, which means that failure to pay interest or principal on a loan above a threshold value will create a default on certain of our other loans. In addition, some of our debt that is cross-defaulted also contains cross-collateralization provisions. Any foreclosure of our properties would result in loss of income and asset value that would negatively affect our financial condition, results of operations, cash flows and ability to make expected distributions to our shareholders. In addition, in certain circumstances, if we are in default and the value of the properties securing a loan is less than the loan balance, we may be required to pay the resulting shortfall to the lender using other assets.
14
As of December 31, 2007, 19.1% of our total debt had variable interest rates, including the effect of interest rate swaps. If short-term interest rates were to rise, our debt service payments on adjustable rate debt would increase, which would lower our net income and could decrease our distributions to our shareholders. We use interest rate swap agreements from time to time to reduce the impact of changes in interest rates. Decreases in interest rates would result in increased interest payments due under interest rate swap agreements in place and, in the event we decided to unwind such agreements, could result in us recognizing a loss and remitting a payment.
We must refinance our debt in the future. As of December 31, 2007, our scheduled debt payments over the next five years, including maturities, were as follows:
| Year |
Amount(1) |
|||
|---|---|---|---|---|
| |
(in thousands) |
|||
| 2008 | $ | 297,120 | (2) | |
| 2009 | 62,643 | |||
| 2010 | 74,033 | |||
| 2011 | 470,814 | (3) | ||
| 2012 | 42,200 | |||
Our operations likely will not generate enough cash flow to repay some or all of this debt without additional borrowings or new equity issuances. If we cannot refinance our debt, extend the repayment dates, or raise additional equity prior to the date when our debt matures, we would default on our existing debt, which would have an adverse effect on our financial position, results of operations, cash flows and ability to make expected distributions to our shareholders.
We may be unable to continue to make shareholder distributions at expected levels. We intend to make regular quarterly cash distributions to our shareholders. However, distribution levels depend on a number of factors, some of which are beyond our control.
Our loan agreements contain provisions that could restrict future distributions. Our ability to sustain our current distribution level will also be dependent, in part, on other matters, including:
15
In addition, we can make distributions to the holders of our common shares only after we make preferential distributions to holders of our preferred shares.
Our ownership limits are important factors. Our Declaration of Trust limits ownership of our common shares by any single shareholder to 9.8% of the number of the outstanding common shares or 9.8% of the value of the outstanding common shares, whichever is more restrictive. Our Declaration of Trust also limits ownership by any single shareholder of our common and preferred shares in the aggregate to 9.8% of the aggregate value of the outstanding common and preferred shares. We call these restrictions the "Ownership Limit." Our Declaration of Trust allows our Board of Trustees to exempt shareholders from the Ownership Limit, and our Board of Trustees previously has exempted one entity from the Ownership Limit.
Our Declaration of Trust includes other provisions that may prevent or delay a change of control. Subject to the requirements of the New York Stock Exchange, our Board of Trustees has the authority, without shareholder approval, to issue additional securities on terms that could delay or prevent a change in control. In addition, our Board of Trustees has the authority to reclassify any of our unissued common shares into preferred shares. Our Board of Trustees may issue preferred shares with such preferences, rights, powers and restrictions as our Board of Trustees may determine, which could also delay or prevent a change in control.
Our Board of Trustees is divided into three classes of Trustees, which could delay a change of control. Our Declaration of Trust divides our Board of Trustees into three classes. The term of one class of the Trustees expires each year, at which time a successor class is elected for a term ending at the third succeeding annual meeting of shareholders. Such staggered terms make it more difficult for a third party to acquire control of us. On November 19, 2007, the Board of Trustees approved an amendment to the Declaration of Trust, subject to shareholder approval at the annual meeting of shareholders to be held on May 22, 2008, to eliminate the separate classes of Trustees and, instead, have all Trustees elected at each annual meeting of shareholders; if approved by the shareholders, all Trustees would be subject to re-election for a one-year term at the annual meeting of shareholders to be held in May 2009.
The Maryland business statutes also impose potential restrictions on a change of control of our company. Various Maryland laws may have the effect of discouraging offers to acquire us, even if the acquisition would be advantageous to shareholders. Resolutions adopted by our Board of Trustees and/or provisions of our bylaws exempt us from such laws, but our Board of Trustees can alter its resolutions or change our bylaws at any time to make these provisions applicable to us.
Our failure to qualify as a REIT would have adverse tax consequences. We believe that since 1992 we have qualified for taxation as a REIT for Federal income tax purposes. We plan to continue to meet the requirements for taxation as a REIT. Many of these requirements, however, are highly technical and complex. The determination that we are a REIT requires an analysis of various factual matters and circumstances that may not be totally within our control. For example, to qualify as a REIT, at least 95% of our gross income must come from certain sources that are itemized in the REIT tax laws. We are also required to distribute to shareholders at least 90% of our REIT taxable income (excluding capital gains). The fact that we hold most of our assets through our Operating Partnership and its subsidiaries further complicates the application of the REIT requirements. Even a technical or inadvertent mistake could jeopardize our REIT status. Furthermore, Congress and the Internal Revenue Service might make changes to the tax laws and regulations and the courts might issue new rulings that make it more difficult or impossible for us to remain qualified as a REIT.
If we fail to qualify as a REIT, we would be subject to Federal income tax at regular corporate rates. Also, unless the Internal Revenue Service granted us relief under certain statutory provisions, we would remain disqualified as a REIT for four years following the year we first fail to qualify. If we fail
16
to qualify as a REIT, we would have to pay significant income taxes and would therefore have less money available for investments or for distributions to our shareholders. This would likely have a significant adverse effect on the value of our securities. In addition, we would no longer be required to make any distributions to our shareholders.
We have certain distribution requirements that reduce cash available for other business purposes. As a REIT, we must distribute at least 90% of our annual taxable income (excluding capital gains), which limits the amount of cash we have available for other business purposes, including amounts to fund our growth. Also, it is possible that because of the differences between the time we actually receive revenue or pay expenses and the period during which we report those items for distribution purposes, we may have to borrow funds to meet the 90% distribution requirement. We may also become subject to tax liabilities that adversely affect our operating cash flow and available cash for distribution to shareholders.
A number of factors could cause our security prices to decline. As is the case with any publicly-traded securities, certain factors outside of our control could influence the value of our common and preferred shares. These conditions include, but are not limited to:
Generally, REITs are tax-advantaged relative to C corporations because they generally are not subject to corporate-level Federal income tax on income that they distribute to shareholders. However, Congress made changes to the tax laws and regulations that could make it less advantageous for investors to invest in REITs. The Jobs and Growth Tax Relief Reconciliation Act of 2003, or the 2003 Act, provides that generally for taxable years beginning after December 31, 2002 and before December 31, 2008, certain dividends received by domestic individual shareholders from certain C corporations are subject to a reduced rate of tax of up to 15%. Prior to the 2003 Act, such dividends received by domestic individual shareholders were generally subject to tax at ordinary income rates, which were as high as 38.6%. In general, the provisions of the 2003 Act do not benefit individual shareholders of REITs and could make an investment in a C corporation that is not a REIT more attractive than an investment in a REIT.
The average daily trading volume of our common shares during the year ended December 31, 2007 was approximately 453,000 shares, and the average trading volume of our publicly-traded preferred shares is generally insignificant. As a result, relatively small volumes of transactions could have a pronounced effect on the market price of such shares.
Our ability to pay dividends may be limited, and we cannot assure you that we will be able to pay dividends regularly. Because we conduct substantially all of our operations through our Operating Partnership, our ability to pay dividends on any series of preferred shares will depend almost entirely on payments and dividends received on our interests in our Operating Partnership, the payment of which depends in turn on our ability to operate profitably and generate cash flow from our operations. We cannot guarantee that we will be able to pay dividends on a regular quarterly basis in the future. Additionally, the terms of some of the debt to which our Operating Partnership is a party limit its ability to make some types of payments and other dividends to us. This in turn limits our ability to make some types of payments, including payment of dividends on common or preferred shares, unless
17
we meet certain financial tests or such payments or dividends are required to maintain our qualification as a REIT. As a result, if we are unable to meet the applicable financial tests, we may not be able to pay dividends on our shares in one or more periods. Furthermore, any new shares of beneficial interest issued will substantially increase the cash required to continue to pay cash dividends at current levels. Any common or preferred shares of beneficial interest that may in the future be issued to finance acquisitions, upon exercise of options or otherwise, would have a similar effect.
Our ability to pay dividends is further limited by the requirements of Maryland law. Our ability to pay dividends on any series of preferred shares is further limited by the laws of Maryland. Under applicable Maryland law, a Maryland REIT may not make a distribution if, after giving effect to the distribution, the REIT would not be able to pay its debts as the debts become due in the usual course of business, or the REIT's total assets would be less than the sum of its total liabilities plus the amount that would be needed, if the REIT were dissolved at the time of the distribution, to satisfy the preferential rights upon dissolution of shareholders whose preferential rights are superior to those receiving the distribution. Accordingly, we may not make a distribution on any series of preferred shares if, after giving effect to the distribution, we would not be able to pay our debts as they become due in the usual course of business or our total assets would be less than the sum of our total liabilities plus the amount that would be needed to satisfy the preferential rights upon dissolution of the holders of shares of any series of preferred shares then outstanding, if any, with preferences senior to those of any such series of preferred shares.
We may incur additional indebtedness, which may harm our financial position and cash flow and potentially impact our ability to pay dividends on any series of preferred shares. Our governing documents do not limit us from incurring additional indebtedness and other liabilities. As of December 31, 2007, we had $1.8 billion of consolidated indebtedness outstanding. We may incur additional indebtedness and become more highly leveraged, which could harm our financial position and potentially limit our cash available to pay dividends. As a result, we may not have sufficient funds remaining to satisfy our dividend obligations relating to any series of preferred shares if we incur additional indebtedness.
We are dependent on external sources of capital for future growth. As noted above, because we are a REIT, we must distribute at least 90% of our annual taxable income to our shareholders. Due to this requirement, we will not be able to fund our acquisition, construction and development activities using cash flow from operations. Therefore, our ability to fund these activities is dependent on our ability to access capital funded by third parties. Such capital could be in the form of new debt, equity issuances of common shares, preferred shares, common and preferred units in our Operating Partnership or joint venture funding. Such capital may not be available on favorable terms or at all. Moreover, additional debt financing may substantially increase our leverage and subject us to covenants that restrict management's flexibility in directing our operations, and additional equity offerings may result in substantial dilution of our shareholders' interests. Our inability to obtain capital when needed could have a material adverse effect on our ability to expand our business and fund other cash requirements.
Our business and operations would suffer in the event of system failures. Despite system redundancy, the implementation of security measures and the existence of a disaster recovery plan for our internal information technology systems, our systems are vulnerable to damages from computer viruses, unauthorized access, energy blackouts, natural disasters, terrorism, war and telecommunication failures. Any system failure or accident that causes interruptions in our operations could result in a material disruption to our business. We may also incur additional costs to remedy damages caused by such disruptions.
Certain of our officers and Trustees have potential conflicts of interest. Certain of our officers and members of our Board of Trustees own partnership units in our Operating Partnership. These
18
individuals may have personal interests that conflict with the interests of our shareholders. For example, if our Operating Partnership sells or refinances certain of the properties that these officers or Trustees contributed to the Operating Partnership, the officers or Trustees could suffer adverse tax consequences. Their personal interests could conflict with our interests if such a sale or refinancing would be advantageous to us. We have certain policies in place that are designed to minimize conflicts of interest. We cannot, however, assure you that these policies will be successful in eliminating the influence of such conflicts, and if they are not successful, decisions could be made that might fail to reflect fully the interests of all of our shareholders.
We are dependent on our key personnel, and the loss of any key personnel could have an adverse effect on our operations. We are dependent on the efforts of our executive officers. The loss of any of their services could have an adverse effect on our operations. Although certain of our officers have entered into employment agreements with us, we cannot assure you that they will remain employed with us.
We may change our policies without shareholder approval, which could adversely affect our financial condition, results of operations, market price of our common shares or ability to pay distributions. Our Board of Trustees determines all of our policies, including our investment, financing and distribution policies. Although our Board of Trustees has no current plans to do so, it may amend or revise these policies at any time without a vote of our shareholders. Policy changes could adversely affect our financial condition, results of operations, the market price of our securities or distributions.
Compliance with changing regulation of corporate governance and public disclosure may result in additional expenses, affect our operations and affect our reputation. Changing laws, regulations and standards relating to corporate governance and public disclosure, including the Sarbanes-Oxley Act of 2002 and new SEC regulations and New York Stock Exchange rules, continue to create uncertainty for public companies. These new or changed laws, regulations and standards are subject to varying interpretations in many cases due to their lack of specificity, and as a result, their application in practice is evolving over time as new guidance is provided by regulatory and governing bodies, which could result in continuing uncertainty regarding compliance matters and higher costs necessitated by ongoing revisions to disclosure and governance practices. We are committed to maintaining high standards of corporate governance and public disclosure. As a result, our efforts to comply with evolving laws, regulations and standards have resulted in, and are likely to continue to result in, increased general and administrative expenses and a diversion of management time and attention from revenue-generating activities to compliance activities. In particular, our efforts to comply with Section 404 of the Sarbanes-Oxley Act of 2002 and the related regulations regarding our required assessment of our internal controls over financial reporting has required the commitment of significant financial and managerial resources. In addition, it has become more expensive for us to obtain director and officer liability insurance. We expect these efforts to require the continued commitment of significant resources. Further, our Trustees, Chief Executive Officer and Chief Financial Officer could face an increased risk of personal liability in connection with the performance of their duties. As a result, we may have difficulty attracting and retaining qualified Trustees and executive officers, which could harm our business. If our efforts to comply with new or changed laws, regulations and standards differ from the activities intended by regulatory or governing bodies due to ambiguities related to practice, our reputation may be harmed.
Item 1B. Unresolved Staff Comments
None
19
The following table provides certain information about our wholly owned office properties as of December 31, 2007:
| Property and Location |
Submarket |
Year Built/ Renovated |
Rentable Square Feet |
Occupancy(1) |
Annualized Rental Revenue(2) |
Annualized Revenue per Occupied Square Foot(2)(3) |
|||||||||
|---|---|---|---|---|---|---|---|---|---|---|---|---|---|---|---|
| Baltimore/Washington Corridor: | |||||||||||||||
| 2730 Hercules Road Annapolis Junction, MD |
BWI Airport | 1990 | 240,336 | 100.0 | % | $ | 5,719,779 | $ | 23.80 | ||||||
| 304 Sentinel Drive Annapolis Junction, MD |
BWI Airport | 2005 | 162,498 | 100.0 | % | 4,462,970 | 27.46 | ||||||||
| 306 Sentinel Drive Annapolis Junction, MD |
BWI Airport | 2006 | 157,896 | 100.0 | % | 4,317,201 | 27.34 | ||||||||
| 2720 Technology Drive Annapolis Junction, MD |
BWI Airport | 2004 | 156,730 | 100.0 | % | 7,016,377 | 44.77 | ||||||||
| 2711 Technology Drive Annapolis Junction, MD |
BWI Airport | 2002 | 152,000 | 100.0 | % | 4,353,608 | 28.64 | ||||||||
| 320 Sentinel Way Annapolis Junction, MD |
BWI Airport | 2007 | 125,681 | 100.0 | % | 3,160,877 | 25.15 | ||||||||
| 318 Sentinel Way Annapolis Junction, MD |
BWI Airport | 2005 | 125,681 | 100.0 | % | 3,159,856 | 25.14 | ||||||||
| 322 Sentinel Way Annapolis Junction, MD |
BWI Airport | 2006 | 125,568 | 100.0 | % | 3,023,364 | 24.08 | ||||||||
| 140 National Business Parkway Annapolis Junction, MD |
BWI Airport | 2003 | 119,904 | 100.0 | % | 3,683,231 | 30.72 | ||||||||
| 132 National Business Parkway Annapolis Junction, MD |
BWI Airport | 2000 | 118,598 | 100.0 | % | 3,231,822 | 27.25 | ||||||||
| 2721 Technology Drive Annapolis Junction, MD |
BWI Airport | 2000 | 118,093 | 100.0 | % | 3,390,056 | 28.71 | ||||||||
| 2701 Technology Drive Annapolis Junction, MD |
BWI Airport | 2001 | 117,450 | 100.0 | % | 3,579,456 | 30.48 | ||||||||
| 1306 Concourse Drive Linthicum, MD |
BWI Airport | 1990 | 114,046 | 94.8 | % | 2,586,891 | 23.92 | ||||||||
| 870-880 Elkridge Landing Road Linthicum, MD |
BWI Airport | 1981 | 105,151 | 100.0 | % | 2,287,214 | 21.75 | ||||||||
| 2691 Technology Drive Annapolis Junction, MD |
BWI Airport | 2005 | 103,683 | 100.0 | % | 2,750,721 | 26.53 | ||||||||
| 1304 Concourse Drive Linthicum, MD |
BWI Airport | 2002 | 101,710 | 76.7 | % | 2,031,932 | 26.05 | ||||||||
| 900 Elkridge Landing Road Linthicum, MD |
BWI Airport | 1982 | 97,261 | 91.5 | % | 2,199,342 | 24.71 | ||||||||
| 1199 Winterson Road Linthicum, MD |
BWI Airport | 1988 | 96,636 | 100.0 | % | 2,454,431 | 25.40 | ||||||||
| 920 Elkridge Landing Road Linthicum, MD |
BWI Airport | 1982 | 96,566 | 100.0 | % | 1,762,329 | 18.25 | ||||||||
| 134 National Business Parkway Annapolis Junction, MD |
BWI Airport | 1999 | 93,482 | 100.0 | % | 2,571,315 | 27.51 | ||||||||
| 135 National Business Parkway Annapolis Junction, MD |
BWI Airport | 1998 | 87,655 | 100.0 | % | 2,491,462 | 28.42 | ||||||||
| 133 National Business Parkway Annapolis Junction, MD |
BWI Airport | 1997 | 87,401 | 66.3 | % | 1,676,398 | 28.92 | ||||||||
| 141 National Business Parkway Annapolis Junction, MD |
BWI Airport | 1990 | 87,247 | 97.5 | % | 2,172,909 | 25.54 | ||||||||
| 1302 Concourse Drive Linthicum, MD |
BWI Airport | 1996 | 84,406 | 73.1 | % | 1,500,457 | 24.31 | ||||||||
| 7467 Ridge Road Hanover, MD |
BWI Airport | 1990 | 74,326 | 100.0 | % | 1,773,426 | 23.86 | ||||||||
20
| Property and Location |
Submarket |
Year Built/ Renovated |
Rentable Square Feet |
Occupancy(1) |
Annualized Rental Revenue(2) |
Annualized Revenue per Occupied Square Foot(2)(3) |
|||||||
|---|---|---|---|---|---|---|---|---|---|---|---|---|---|
| 7240 Parkway Drive Hanover, MD |
BWI Airport | 1985 | 73,970 | 76.3 | % | 1,275,642 | 22.60 | ||||||
| 881 Elkridge Landing Road Linthicum, MD |
BWI Airport | 1986 | 73,572 | 100.0 | % | 1,686,270 | 22.92 | ||||||
| 1099 Winterson Road Linthicum, MD |
BWI Airport | 1988 | 70,569 | 27.9 | % | 460,109 | 23.39 | ||||||
| 1190 Winterson Road Linthicum, MD |
BWI Airport | 1987 | 69,127 | 83.6 | % | 1,591,007 | 27.52 | ||||||
| 131 National Business Parkway Annapolis Junction, MD |
BWI Airport | 1990 | 69,039 | 90.5 | % | 1,737,422 | 27.80 | ||||||
| 849 International Drive Linthicum, MD |
BWI Airport | 1988 | 68,758 | 78.1 | % | 1,383,777 | 25.78 | ||||||
| 911 Elkridge Landing Road Linthicum, MD |
BWI Airport | 1985 | 68,296 | 100.0 | % | 1,463,145 | 21.42 | ||||||
| 1201 Winterson Road Linthicum, MD |
BWI Airport | 1985 | 67,903 | 100.0 | % | 1,018,545 | 15.00 | ||||||
| 999 Corporate Boulevard Linthicum, MD |
BWI Airport | 2000 | 67,455 | 91.8 | % | 1,863,299 | 30.09 | ||||||
| 7272 Park Circle Drive Hanover, MD |
BWI Airport | 1991/1996 | 59,397 | 74.4 | % | 964,031 | 21.83 | ||||||
| 7318 Parkway Drive Hanover, MD |
BWI Airport | 1984 | 59,204 | 100.0 | % | 1,131,240 | 19.11 | ||||||
| 891 Elkridge Landing Road Linthicum, MD |
BWI Airport | 1984 | 58,454 | 97.4 | % | 1,245,500 | 21.89 | ||||||
| 7320 Parkway Drive Hanover, MD |
BWI Airport | 1983 | 58,453 | 95.9 | % | 893,054 | 15.94 | ||||||
| 901 Elkridge Landing Road Linthicum, MD |
BWI Airport | 1984 | 57,593 | 100.0 | % | 1,236,781 | 21.47 | ||||||
| 930 International Drive Linthicum, MD |
BWI Airport | 1986 | 57,409 | 40.5 | % | 459,038 | 19.73 | ||||||
| 800 International Drive Linthicum, MD |
BWI Airport | 1988 | 57,379 | 100.0 | % | 1,192,555 | 20.78 | ||||||
| 900 International Drive Linthicum, MD |
BWI Airport | 1986 | 57,140 | 100.0 | % | 893,897 | 15.64 | ||||||
| 921 Elkridge Landing Road Linthicum, MD |
BWI Airport | 1983 | 54,175 | 100.0 | % | 1,083,500 | 20.00 | ||||||
| 939 Elkridge Landing Road Linthicum, MD |
BWI Airport | 1983 | 53,031 | 92.3 | % | 1,156,356 | 23.61 | ||||||
| 938 Elkridge Landing Road Linthicum, MD |
BWI Airport | 1984 | 52,988 | 100.0 | % | 1,244,390 | 23.48 | ||||||
| 302 Sentinel Drive Annapolis Junction, MD |
BWI Airport | 2007 | 48,377 | 100.0 | % | 1,745,545 | 36.08 | ||||||
| 1340 Ashton Road Hanover, MD |
BWI Airport | 1989 | 46,400 | 100.0 | % | 994,434 | 21.43 | ||||||
| 1334 Ashton Road Hanover, MD |
BWI Airport | 1989 | 37,565 | 36.7 | % | 258,159 | 18.72 | ||||||
| 1331 Ashton Road Hanover, MD |
BWI Airport | 1989 | 29,153 | 100.0 | % | 610,632 | 20.95 | ||||||
| 5522 Research Park Drive Catonsville, MD |
BWI Airport | 2007 | 23,500 | 100.0 | % | 599,250 | 25.50 | ||||||
| 1350 Dorsey Road Hanover, MD |
BWI Airport | 1989 | 19,992 | 52.9 | % | 187,923 | 17.77 | ||||||
| 1344 Ashton Road Hanover, MD |
BWI Airport | 1989 | 17,062 | 100.0 | % | 453,664 | 26.59 | ||||||
| 1341 Ashton Road Hanover, MD |
BWI Airport | 1989 | 15,841 | 100.0 | % | 300,103 | 18.94 | ||||||
21
| Property and Location |
Submarket |
Year Built/ Renovated |
Rentable Square Feet |
Occupancy(1) |
Annualized Rental Revenue(2) |
Annualized Revenue per Occupied Square Foot(2)(3) |
|||||||
|---|---|---|---|---|---|---|---|---|---|---|---|---|---|
| 1343 Ashton Road Hanover, MD |
BWI Airport | 1989 | 9,962 | 100.0 | % | 202,484 | 20.33 | ||||||
| 114 National Business Parkway Annapolis Junction, MD |
BWI Airport | 2002 | 9,908 | 100.0 | % | 210,523 | 21.25 | ||||||
| 1348 Ashton Road Hanover, MD |
BWI Airport | 1988 | 3,108 | 100.0 | % | 74,856 | 24.08 | ||||||
| 7125 Columbia Gateway Drive Columbia, MD |
Howard County Perimeter |
1973/1999 | 611,379 | 97.5 | % | 8,247,531 | 13.84 | ||||||
| Old Annapolis Road Columbia, MD |
Howard County Perimeter |
1974/1985 | 171,436 | 100.0 | % | 5,306,078 | 30.95 | ||||||
| 7200 Riverwood Drive Columbia, MD |
Howard County Perimeter |
1986 | 160,000 | 100.0 | % | 3,516,124 | 21.98 | ||||||
| 7000 Columbia Gateway Drive Columbia, MD |
Howard County Perimeter |
1999 | 145,806 | 100.0 | % | 1,539,347 | 10.56 | ||||||
| 6731 Columbia Gateway Drive Columbia, MD |
Howard County Perimeter |
2002 | 123,911 | 84.8 | % | 2,768,112 | 26.35 | ||||||
| 6711 Columbia Gateway Drive Columbia, MD |
Howard County Perimeter |
2006/2007 | 123,410 | 83.1 | % | 2,710,744 | 26.44 | ||||||
| 6940 Columbia Gateway Drive Columbia, MD |
Howard County Perimeter |
1999 | 109,003 | 73.9 | % | 1,941,628 | 24.11 | ||||||
| 6950 Columbia Gateway Drive Columbia, MD |
Howard County Perimeter |
1998 | 107,778 | 100.0 | % | 2,364,513 | 21.94 | ||||||
| 8621 Robert Fulton Drive Columbia, MD |
Howard County Perimeter |
2005/2006 | 86,032 | 96.1 | % | 1,672,423 | 20.23 | ||||||
| 7067 Columbia Gateway Drive Columbia, MD |
Howard County Perimeter |
2001 | 82,953 | 41.0 | % | 748,110 | 22.00 | ||||||
| 6750 Alexander Bell Drive Columbia, MD |
Howard County Perimeter |
2001 | 78,460 | 64.5 | % | 1,270,882 | 25.12 | ||||||
| 6700 Alexander Bell Drive Columbia, MD |
Howard County Perimeter |
1988 | 74,859 | 91.8 | % | 1,609,776 | 23.43 | ||||||
| 6740 Alexander Bell Drive Columbia, MD |
Howard County Perimeter |
1992 | 63,480 | 100.0 | % | 1,561,837 | 24.60 | ||||||
| 7160 Riverwood Drive Columbia, MD |
Howard County Perimeter |
2000 | 62,084 | 86.7 | % | 1,131,734 | 21.03 | ||||||
| 7015 Albert Einstein Drive Columbia, MD |
Howard County Perimeter |
1999 | 61,203 | 100.0 | % | 906,700 | 14.81 | ||||||
| 8671 Robert Fulton Drive Columbia, MD |
Howard County Perimeter |
2002 | 56,350 | 100.0 | % | 1,066,614 | 18.93 | ||||||
| 6716 Alexander Bell Drive Columbia, MD |
Howard County Perimeter |
1990 | 52,005 | 74.9 | % | 884,281 | 22.70 | ||||||
| 8661 Robert Fulton Drive Columbia, MD |
Howard County Perimeter |
2002 | 49,307 | 100.0 | % | 857,364 | 17.39 | ||||||
| 9020 Mendenhall Court Columbia, MD |
Howard County Perimeter |
1982/2005 | 49,259 | 82.4 | % | 509,208 | 12.54 | ||||||
| 7130 Columbia Gateway Drive Columbia, MD |
Howard County Perimeter |
1989 | 46,840 | 99.2 | % | 764,439 | 16.45 | ||||||
| 7142 Columbia Gateway Drive Columbia, MD |
Howard County Perimeter |
1994 | 45,951 | 0.0 | % | — | — | ||||||
| 9140 Guilford Road Columbia, MD |
Howard County Perimeter |
1983 | 41,704 | 72.7 | % | 553,930 | 18.28 | ||||||
| 7150 Riverwood Drive Columbia, MD |
Howard County Perimeter |
2000 | 41,382 | 100.0 | % | 661,518 | 15.99 | ||||||
| 9720 Patuxent Woods Drive Columbia, MD |
Howard County Perimeter |
1986/2001 | 40,004 | 84.8 | % | 503,905 | 14.85 | ||||||
| 6708 Alexander Bell Drive Columbia, MD |
Howard County Perimeter |
1988 | 39,203 | 100.0 | % | 831,809 | 21.22 | ||||||
22
| Property and Location |
Submarket |
Year Built/ Renovated |
Rentable Square Feet |
Occupancy(1) |
Annualized Rental Revenue(2) |
Annualized Revenue per Occupied Square Foot(2)(3) |
|||||||||
|---|---|---|---|---|---|---|---|---|---|---|---|---|---|---|---|
| 7065 Columbia Gateway Drive Columbia, MD |
Howard County Perimeter |
2000 | 38,560 | 100.0 | % | 869,579 | 22.55 | ||||||||
| 9740 Patuxent Woods Drive Columbia, MD |
Howard County Perimeter |
1986/2001 | 38,292 | 100.0 | % | 390,958 | 10.21 | ||||||||
| 7138 Columbia Gateway Drive Columbia, MD |
Howard County Perimeter |
1990 | 38,225 | 100.0 | % | 821,278 | 21.49 | ||||||||
| 9160 Guilford Road Columbia, MD |
Howard County Perimeter |
1984 | 37,034 | 100.0 | % | 745,983 | 20.14 | ||||||||
| 7063 Columbia Gateway Drive Columbia, MD |
Howard County Perimeter |
2000 | 36,813 | 100.0 | % | 824,102 | 22.39 | ||||||||
| 6760 Alexander Bell Drive Columbia, MD |
Howard County Perimeter |
1991 | 36,440 | 96.3 | % | 810,647 | 23.10 | ||||||||
| 7150 Columbia Gateway Drive Columbia, MD |
Howard County Perimeter |
1991 | 35,812 | 100.0 | % | 646,989 | 18.07 | ||||||||
| 9700 Patuxent Woods Drive Columbia, MD |
Howard County Perimeter |
1986/2001 | 31,261 | 81.4 | % | 551,740 | 21.69 | ||||||||
| 9730 Patuxent Woods Drive Columbia, MD |
Howard County Perimeter |
1986/2001 | 30,986 | 100.0 | % | 448,791 | 14.48 | ||||||||
| 7061 Columbia Gateway Drive Columbia, MD |
Howard County Perimeter |
2000 | 29,910 | 100.0 | % | 633,445 | 21.18 | ||||||||
| 7170 Riverwood Drive Columbia, MD |
Howard County Perimeter |
2000 | 29,162 | 87.9 | % | 465,828 | 18.18 | ||||||||
| 6724 Alexander Bell Drive Columbia, MD |
Howard County Perimeter |
2001 | 28,420 | 100.0 | % | 704,234 | 24.78 | ||||||||
| 7134 Columbia Gateway Drive Columbia, MD |
Howard County Perimeter |
1990 | 21,991 | 100.0 | % | 396,899 | 18.05 | ||||||||
| 9150 Guilford Drive Columbia, MD |
Howard County Perimeter |
1984 | 18,592 | 100.0 | % | 367,941 | 19.79 | ||||||||
| 10280 Old Columbia Road Columbia, MD |
Howard County Perimeter |
1988/2001 | 16,796 | 100.0 | % | 249,544 | 14.86 | ||||||||
| 10270 Old Columbia Road Columbia, MD |
Howard County Perimeter |
1988/2001 | 16,686 | 100.0 | % | 242,830 | 14.55 | ||||||||
| 9710 Patuxent Woods Drive Columbia, MD |
Howard County Perimeter |
1986/2001 | 15,229 | 100.0 | % | 317,357 | 20.84 | ||||||||
| 9130 Guilford Drive Columbia, MD |
Howard County Perimeter |
1984 | 13,700 | 100.0 | % | 263,734 | 19.25 | ||||||||
| 10290 Old Columbia Road Columbia, MD |
Howard County Perimeter |
1988/2001 | 10,890 | 60.4 | % | 102,629 | 15.59 | ||||||||
| 2500 Riva Road Annapolis Junction, MD |
Annapolis | 2000 | 155,000 | 100.0 | % | 2,089,800 | 13.48 | ||||||||
| Subtotal/Average | 7,668,383 | 92.6 | % | $ | 162,847,470 | $ | 22.94 | ||||||||
Suburban Maryland: |
|||||||||||||||
| 11800 Tech Road Silver Spring, MD |
North Silver Spring | 1969/1989 | 228,179 | 100.0 | % | $ | 4,033,725 | $ | 17.68 | ||||||
| 400 Professional Drive Gaithersburg, MD |
Gaithersburg | 2000 | 129,311 | 100.0 | % | 3,785,763 | 29.28 | ||||||||
| 110 Thomas Johnson Drive Frederick, MD |
Frederick | 1987/1999 | 117,803 | 87.1 | % | 2,508,702 | 24.45 | ||||||||
| 45 West Gude Drive Rockville, MD |
Rockville | 1987 | 108,588 | 100.0 | % | 2,135,904 | 19.67 | ||||||||
| 15 West Gude Drive Rockville, MD |
Rockville | 1986 | 106,694 | 100.0 | % | 2,506,625 | 23.49 | ||||||||
| Subtotal/Average | 690,575 | 97.8 | % | $ | 14,970,719 | $ | 22.17 | ||||||||
23
| Property and Location |
Submarket |
Year Built/ Renovated |
Rentable Square Feet |
Occupancy(1) |
Annualized Rental Revenue(2) |
Annualized Revenue per Occupied Square Foot(2)(3) |
|||||||||
|---|---|---|---|---|---|---|---|---|---|---|---|---|---|---|---|
Suburban Baltimore: |
|||||||||||||||
| 11311 McCormick Road Hunt Valley, MD |
Hunt Valley/Rte 83 Corridor |
1984/1994 | 212,691 | 52.0 | % | $ | 2,541,792 | $ | 23.00 | ||||||
| 10150 York Road Hunt Valley, MD |
Hunt Valley/Rte 83 Corridor |
1985 | 178,286 | 100.0 | % | 3,407,468 | 19.11 | ||||||||
| 9690 Deereco Road Timonium, MD |
Hunt Valley/Rte 83 Corridor |
1988 | 134,167 | 100.0 | % | 3,391,213 | 25.28 | ||||||||
| 200 International Circle Hunt Valley, MD |
Hunt Valley/Rte 83 Corridor |
1987 | 128,658 | 56.9 | % | 1,729,796 | 23.64 | ||||||||
| 375 W. Padonia Road Timonium, MD |
Hunt Valley/Rte 83 Corridor |
1986 | 110,328 | 91.5 | % | 1,631,943 | 16.17 | ||||||||
| 226 Schilling Circle Hunt Valley, MD |
Hunt Valley/Rte 83 Corridor |
1980 | 98,640 | 100.0 | % | 2,219,102 | 22.50 | ||||||||
| 201 International Circle Hunt Valley, MD |
Hunt Valley/Rte 83 Corridor |
1982 | 78,634 | 79.7 | % | 1,543,079 | 24.63 | ||||||||
| 11011 McCormick Road Hunt Valley, MD |
Hunt Valley/Rte 83 Corridor |
1974 | 56,512 | 54.5 | % | 515,191 | 16.73 | ||||||||
| 216 Schilling Circle Hunt Valley, MD |
Hunt Valley/Rte 83 Corridor |
1988/2001 | 36,003 | 89.4 | % | 656,811 | 20.40 | ||||||||
| 222 Schilling Circle Hunt Valley, MD |
Hunt Valley/Rte 83 Corridor |
1978/1997 | 28,003 | 93.1 | % | 546,709 | 20.97 | ||||||||
| 224 Schilling Circle Hunt Valley, MD |
Hunt Valley/Rte 83 Corridor |
1978/1997 | 27,372 | 96.7 | % | 484,681 | 18.31 | ||||||||
| 11101 McCormick Road Hunt Valley, MD |
Hunt Valley/Rte 83 Corridor |
1976 | 24,232 | 88.4 | % | 428,668 | 20.01 | ||||||||
| 7210 Ambassador Road Woodlawn, MD |
Baltimore County Westside |
1972 | 83,435 | 100.0 | % | 899,161 | 10.78 | ||||||||
| 7152 Windsor Boulevard Woodlawn, MD |
Baltimore County Westside |
1986 | 57,855 | 100.0 | % | 818,814 | 14.15 | ||||||||
| 21 Governor's Court Woodlawn, MD |
Baltimore County Westside |
1981/1995 | 56,063 | 64.6 | % | 615,935 | 17.01 | ||||||||
| 7125 Ambassador Road Woodlawn, MD |
Baltimore County Westside |
1985 | 50,488 | 100.0 | % | 935,564 | 18.53 | ||||||||
| 7253 Ambassador Road Woodlawn, MD |
Baltimore County Westside |
1988 | 38,930 | 100.0 | % | 517,197 | 13.29 | ||||||||
| 7104 Ambassador Road Woodlawn, MD |
Baltimore County Westside |
1988 | 30,257 | 100.0 | % | 511,693 | 16.91 | ||||||||
| 17 Governor's Court Woodlawn, MD |
Baltimore County Westside |
1981 | 14,619 | 100.0 | % | 256,355 | 17.54 | ||||||||
| 15 Governor's Court Woodlawn, MD |
Baltimore County Westside |
1981 | 14,568 | 100.0 | % | 213,725 | 14.67 | ||||||||
| 7127 Ambassador Road Woodlawn, MD |
Baltimore County Westside |
1985 | 11,144 | 64.9 | % | 130,230 | 18.00 | ||||||||
| 7129 Ambassador Road Woodlawn, MD |
Baltimore County Westside |
1985 | 11,075 | 100.0 | % | 171,663 | 15.50 | ||||||||
| 7108 Ambassador Road Woodlawn, MD |
Baltimore County Westside |
1988 | 9,018 | 47.1 | % | 81,517 | 19.21 | ||||||||
| 7102 Ambassador Road Woodlawn, MD |
Baltimore County Westside |
1988 | 8,879 | 100.0 | % | 169,282 | 19.07 | ||||||||
| 7106 Ambassador Road Woodlawn, MD |
Baltimore County Westside |
1988 | 8,820 | 100.0 | % | 162,077 | 18.38 | ||||||||
| 7131 Ambassador Road Woodlawn, MD |
Baltimore County Westside |
1985 | 7,453 | 100.0 | % | 128,931 | 17.30 | ||||||||
| 502 Washington Avenue Towson, MD |
Towson | 1984 | 91,188 | 90.9 | % | 1,731,588 | 20.89 | ||||||||
| 102 West Pennsylvania Avenue Towson, MD |
Towson | 1968/2001 | 49,497 | 85.1 | % | 797,253 | 18.92 | ||||||||
24
| Property and Location |
Submarket |
Year Built/ Renovated |
Rentable Square Feet |
Occupancy(1) |
Annualized Rental Revenue(2) |
Annualized Revenue per Occupied Square Foot(2)(3) |
|||||||
|---|---|---|---|---|---|---|---|---|---|---|---|---|---|
| 100 West Pennsylvania Avenue Towson, MD |
Towson | 1952/1989 | 18,451 | 34.5 | % | 107,748 | 16.91 | ||||||
| 109-111 Allegheny Avenue Towson, MD |
Towson | 1971 | 18,431 | 100.0 | % | 244,885 | 13.29 | ||||||
| 10001 Franklin Square Drive White Marsh, MD |
White Marsh | 1997 | 216,000 | 83.7 | % | 1,475,910 | 8.16 | ||||||
| 8140 Corporate Drive White Marsh, MD |
White Marsh | 2003 | 75,687 | 85.6 | % | 1,575,287 | 24.32 | ||||||
| 8110 Corporate Drive White Marsh, MD |
White Marsh | 2001 | 75,687 | 100.0 | % | 1,571,524 | 20.76 | ||||||
| 8031 Corporate Drive White Marsh, MD |
White Marsh | 1988/2004 | 66,000 | 100.0 | % | 1,005,010 | 15.23 | ||||||
| 7941-7949 Corporate Drive White Marsh, MD |
White Marsh | 1996 | 57,600 | 100.0 | % | 589,722 | 10.24 | ||||||
| 9910 Franklin Square Drive White Marsh, MD |
White Marsh | 2005 | 56,271 | 100.0 | % | 1,073,023 | 19.07 | ||||||
| 8020 Corporate Drive White Marsh, MD |
White Marsh | 1997 | 51,600 | 100.0 | % | 834,741 | 16.18 | ||||||
| 8094 Sandpiper Circle White Marsh, MD |
White Marsh | 1998 | 50,812 | 100.0 | % | 979,868 | 19.28 | ||||||
| 4979 Mercantile Road White Marsh, MD |
White Marsh | 1985 | 50,498 | 100.0 | % | 662,607 | 13.12 | ||||||
| 4940 Campbell Boulevard White Marsh, MD |
White Marsh | 1990 | 49,813 | 90.6 | % | 966,910 | 21.43 | ||||||
| 8098 Sandpiper Circle White Marsh, MD |
White Marsh | 1998 | 47,680 | 100.0 | % | 761,422 | 15.97 | ||||||
| 4969 Mercantile Road White Marsh, MD |
White Marsh | 1983 | 47,574 | 100.0 | % | 740,651 | 15.57 | ||||||
| 8114 Sandpiper Circle White Marsh, MD |
White Marsh | 1986 | 45,399 | 87.1 | % | 966,522 | 24.45 | ||||||
| 5020 Campbell Boulevard White Marsh, MD |
White Marsh | 1986/1988 | 44,701 | 76.0 | % | 469,755 | 13.82 | ||||||
| 9920 Franklin Square Drive White Marsh, MD |
White Marsh | 2006 | 44,566 | 23.6 | % | 248,958 | 23.69 | ||||||
| 8007 Corporate Drive White Marsh, MD |
White Marsh | 1995 | 43,197 | 85.0 | % | 646,849 | 17.62 | ||||||
| 9930 Franklin Square Drive White Marsh, MD |
White Marsh | 2001 | 39,750 | 100.0 | % | 770,327 | 19.38 | ||||||
| 8010 Corporate Drive White Marsh, MD |
White Marsh | 1998 | 39,351 | 57.0 | % | 435,495 | 19.41 | ||||||
| 8013 Corporate Drive White Marsh, MD |
White Marsh | 1990 | 38,618 | 0.0 | % | — | — | ||||||
| 8615 Ridgely's Choice Drive White Marsh, MD |
White Marsh | 2005 | 37,797 | 52.3 | % | 383,971 | 19.42 | ||||||
| 5325 Nottingham Ridge Road White Marsh, MD |
White Marsh | 2002 | 37,322 | 75.5 | % | 559,322 | 19.85 | ||||||
| 9900 Franklin Square Drive White Marsh, MD |
White Marsh | 1999 | 33,912 | 100.0 | % | 624,525 | 18.42 | ||||||
| 5024 Campbell Boulevard White Marsh, MD |
White Marsh | 1986/1988 | 33,858 | 100.0 | % | 483,234 | 14.27 | ||||||
| 9940 Franklin Square Drive White Marsh, MD |
White Marsh | 2000 | 33,134 | 63.5 | % | 325,654 | 15.48 | ||||||
| 5026 Campbell Boulevard White Marsh, MD |
White Marsh | 1986/1988 | 30,868 | 73.6 | % | 425,472 | 18.72 | ||||||
| 7939 Honeygo Boulevard White Marsh, MD |
White Marsh | 1984 | 28,081 | 100.0 | % | 610,650 | 21.75 | ||||||
25
| Property and Location |
Submarket |
Year Built/ Renovated |
Rentable Square Feet |
Occupancy(1) |
Annualized Rental Revenue(2) |
Annualized Revenue per Occupied Square Foot(2)(3) |
|||||||||
|---|---|---|---|---|---|---|---|---|---|---|---|---|---|---|---|
| 8133 Perry Hall Boulevard White Marsh, MD |
White Marsh | 1988 | 27,803 | 94.9 | % | 518,194 | 19.64 | ||||||||
| 5022 Campbell Boulevard White Marsh, MD |
White Marsh | 1986/1988 | 27,601 | 73.6 | % | 299,812 | 14.76 | ||||||||
| 8019 Corporate Drive White Marsh, MD |
White Marsh | 1990 | 25,461 | 100.0 | % | 444,641 | 17.46 | ||||||||
| 8029 Corporate Drive White Marsh, MD |
White Marsh | 1988/2004 | 25,000 | 100.0 | % | 387,548 | 15.50 | ||||||||
| 7923 Honeygo Boulevard White Marsh, MD |
White Marsh | 1985 | 24,053 | 100.0 | % | 473,343 | 19.68 | ||||||||
| 8003 Corporate Drive White Marsh, MD |
White Marsh | 1999 | 18,327 | 100.0 | % | 345,209 | 18.84 | ||||||||
| 8015 Corporate Drive White Marsh, MD |
White Marsh | 1990 | 16,610 | 100.0 | % | 281,699 | 16.96 | ||||||||
| 8023 Corporate Drive White Marsh, MD |
White Marsh | 1990 | 9,486 | 100.0 | % | 147,087 | 15.51 | ||||||||
| Subtotal/Average | 3,243,814 | 84.8 | % | $ | 49,675,013 | $ | 18.06 | ||||||||
Greater Philadelphia: |
|||||||||||||||
| 753 Jolly Road Blue Bell, PA |
Blue Bell | 1960/92-94 | 419,472 | 100.0 | % | $ | 4,189,907 | $ | 9.99 | ||||||
| 785 Jolly Road Blue Bell, PA |
Blue Bell | 1970/1996 | 219,065 | 100.0 | % | 2,515,223 | 11.48 | ||||||||
| 760 Jolly Road Blue Bell, PA |
Blue Bell | 1974/1994 | 208,854 | 100.0 | % | 3,068,118 | 14.69 | ||||||||
| 751 Jolly Road Blue Bell, PA |
Blue Bell | 1966/1991 | 112,958 | 100.0 | % | 1,128,284 | 9.99 | ||||||||
| Subtotal/Average | 960,349 | 100.0 | % | $ | 10,901,532 | $ | 11.35 | ||||||||
Central New Jersey: |
|||||||||||||||
| 431 Ridge Road Dayton, NJ |
Exit 8A—Cranbury | 1958/1998 | 171,200 | 100.0 | % | $ | 1,959,932 | $ | 11.45 | ||||||
| 429 Ridge Road Dayton, NJ |
Exit 8A—Cranbury | 1966/1996 | 142,385 | 21.1 | % | 741,216 | 24.65 | ||||||||
| 47 Commerce Cranbury, NJ |
Exit 8A—Cranbury | 1992/1998 | 41,398 | 100.0 | % | 547,600 | 13.23 | ||||||||
| 437 Ridge Road Dayton, NJ |
Exit 8A—Cranbury | 1962/1996 | 30,000 | 100.0 | % | 291,300 | 9.71 | ||||||||
| Subtotal/Average | 384,983 | 70.8 | % | $ | 3,540,048 | $ | 12.98 | ||||||||
Northern Virginia: |
|||||||||||||||
| 15000 Conference Center Drive Chantilly, VA |
Dulles South | 1989 | 470,406 | 99.8 | % | $ | 11,083,480 | $ | 23.61 | ||||||
| 15010 Conference Center Drive Chantilly, VA |
Dulles South | 2006 | 223,610 | 100.0 | % | 5,994,549 | 26.81 | ||||||||
| 15059 Conference Center Drive Chantilly, VA |
Dulles South | 2000 | 145,192 | 100.0 | % | 4,408,801 | 30.37 | ||||||||
| 15049 Conference Center Drive Chantilly, VA |
Dulles South | 1997 | 145,053 | 100.0 | % | 4,202,340 | 28.97 | ||||||||
| 14900 Conference Center Drive Chantilly, VA |
Dulles South | 1999 | 127,115 | 81.3 | % | 2,818,381 | 27.27 | ||||||||
| 14280 Park Meadow Drive Chantilly, VA |
Dulles South | 1999 | 114,126 | 100.0 | % | 3,266,499 | 28.62 | ||||||||
| 4851 Stonecroft Boulevard Chantilly, VA |
Dulles South | 2004 | 88,094 | 100.0 | % | 2,664,207 | 30.24 | ||||||||
26
| Property and Location |
Submarket |
Year Built/ Renovated |
Rentable Square Feet |
Occupancy(1) |
Annualized Rental Revenue(2) |
Annualized Revenue per Occupied Square Foot(2)(3) |
|||||||||
|---|---|---|---|---|---|---|---|---|---|---|---|---|---|---|---|
| 14850 Conference Center Drive Chantilly, VA |
Dulles South | 2000 | 69,711 | 100.0 | % | 2,168,704 | 31.11 | ||||||||
| 14840 Conference Center Drive Chantilly, VA |
Dulles South | 2000 | 69,710 | 100.0 | % | 1,962,922 | 28.16 | ||||||||
| 13200 Woodland Park Drive Herndon, VA |
Herndon | 2002 | 404,665 | 100.0 | % | 11,279,746 | 27.87 | ||||||||
| 13454 Sunrise Valley Road Herndon, VA |
Herndon | 1998 | 112,633 | 100.0 | % | 2,744,755 | 24.37 | ||||||||
| 13450 Sunrise Valley Road Herndon, VA |
Herndon | 1998 | 53,728 | 98.6 | % | 1,270,169 | 23.98 | ||||||||
| 1751 Pinnacle Drive McLean, VA |
Tysons Corner | 1989/1995 | 260,469 | 96.5 | % | 8,205,927 | 32.65 | ||||||||
| 1753 Pinnacle Drive McLean, VA |
Tysons Corner | 1976/2004 | 181,637 | 100.0 | % | 6,399,128 | 35.23 | ||||||||
| Subtotal/Average | 2,466,149 | 98.6 | % | $ | 68,469,608 | $ | 28.16 | ||||||||
St. Mary's & King George Counties: |
|||||||||||||||
| 22309 Exploration Drive Lexington Park, MD |
St. Mary's County | 1984/1997 | 98,860 | 100.0 | % | $ | 1,442,239 | $ | 14.59 | ||||||
| 46579 Expedition Drive Lexington Park, MD |
St. Mary's County | 2002 | 61,156 | 87.3 | % | 1,155,492 | 21.65 | ||||||||
| 22289 Exploration Drive Lexington Park, MD |
St. Mary's County | 2000 | 61,059 | 94.9 | % | 1,151,274 | 19.86 | ||||||||
| 46591 Expedition Drive Lexington Park, MD |
St. Mary's County | 2005/2006 | 60,029 | 44.6 | % | 537,242 | 20.05 | ||||||||
| 44425 Pecan Court California, MD |
St. Mary's County | 1997 | 59,055 | 76.3 | % | 878,010 | 19.48 | ||||||||
| 22299 Exploration Drive Lexington Park, MD |
St. Mary's County | 1998 | 58,231 | 100.0 | % | 1,313,856 | 22.56 | ||||||||
| 44408 Pecan Court California, MD |
St. Mary's County | 1986 | 50,532 | 100.0 | % | 585,573 | 11.59 | ||||||||
| 23535 Cottonwood Parkway California, MD |
St. Mary's County | 1984 | 46,656 | 100.0 | % | 527,349 | 11.30 | ||||||||
| 22300 Exploration Drive Lexington Park, MD |
St. Mary's County | 1997 | 44,830 | 100.0 | % | 697,884 | 15.57 | ||||||||
| 44417 Pecan Court California, MD |
St. Mary's County | 1989 | 29,053 | 100.0 | % | 278,900 | 9.60 | ||||||||
| 44414 Pecan Court California, MD |
St. Mary's County | 1986 | 25,444 | 100.0 | % | 243,557 | 9.57 | ||||||||
| 44420 Pecan Court California, MD |
St. Mary's County | 1989 | 25,200 | 100.0 | % | 173,148 | 6.87 | ||||||||
| 16480 Commerce Drive Dahlgren, VA |
King George County |
2000 | 70,728 | 100.0 | % | 1,239,066 | 17.52 | ||||||||
| 16541 Commerce Drive King George, VA |
King George County |
1996 | 36,053 | 100.0 | % | 523,144 | 14.51 | ||||||||
| 16539 Commerce Drive King George, VA |
King George County |
1990 | 32,076 | 70.9 | % | 335,736 | 14.76 | ||||||||
| 16442 Commerce Drive Dahlgren, VA |
King George County | 2002 | 25,518 | 100.0 | % | 508,464 | 19.93 | ||||||||
| 16501 Commerce Drive Dahlgren, VA |
King George County |
2002 | 22,833 | 100.0 | % | 519,304 | 22.74 | ||||||||
| 16543 Commerce Drive Dahlgren, VA |
King George County |
2002 | 17,370 | 87.0 | % | 374,150 | 24.75 | ||||||||
Subtotal/Average |
824,683 |
91.6 |
% |
$ |
12,484,388 |
$ |
16.54 |
||||||||
27
| Property and Location |
Submarket |
Year Built/ Renovated |
Rentable Square Feet |
Occupancy(1) |
Annualized Rental Revenue(2) |
Annualized Revenue per Occupied Square Foot(2)(3) |
||||||||||
|---|---|---|---|---|---|---|---|---|---|---|---|---|---|---|---|---|
| 8611 Military Drive | San Antonio | 1982/1985 | 468,994 | 100.0 | % | $ | 7,231,868 | $ | 15.42 | |||||||
| San Antonio, TX | ||||||||||||||||
| Colorado Springs: | ||||||||||||||||
| 985 Space Center Drive Colorado Springs, CO |
Colorado Springs East |
1989 | 102,717 | 98.9 | % | $ | 2,119,195 | $ | 20.86 | |||||||
| 1670 North Newport Road Colorado Springs, CO |
Colorado Springs East |
1986/1987 | 67,500 | 100.0 | % | 1,428,696 | 21.17 | |||||||||
| 745 Space Center Drive Colorado Springs, CO |
Colorado Springs East |
2006 | 51,500 | 100.0 | % | 1,231,055 | 23.90 | |||||||||
| 1915 Aerotech Drive Colorado Springs, CO |
Colorado Springs East |
1985 | 37,946 | 85.8 | % | 554,635 | 17.03 | |||||||||
| 1925 Aerotech Drive Colorado Springs, CO |
Colorado Springs East |
1985 | 37,946 | 100.0 | % | 690,300 | 18.19 | |||||||||
| 980 Technology Court Colorado Springs, CO | Colorado Springs East |
1995 | 33,190 | 100.0 | % | 561,343 | 16.91 | |||||||||
| 525 Babcock Road Colorado Springs, CO |
Colorado Springs East | 1967 | 14,000 | 100.0 | % | 130,194 | 9.30 | |||||||||
| 9950 Federal Drive Colorado Springs, CO |
I-25 North Corridor | 2001 | 66,222 | 83.6 | % | 663,691 | 11.99 | |||||||||
| 9960 Federal Drive Colorado Springs, CO |
I-25 North Corridor | 2001 | 46,948 | 100.0 | % | 844,841 | 18.00 | |||||||||
| 9965 Federal Drive Colorado Springs, CO |
I-25 North Corridor | 1983/2007 | 41,120 | 100.0 | % | 624,084 | 15.18 | |||||||||
| 5775 Mark Dabling Boulevard Colorado Springs, CO |
Colorado Springs Northwest |
1984 | 109,678 | 100.0 | % | 1,673,613 | 15.26 | |||||||||
| 5725 Mark Dabling Boulevard Colorado Springs, CO |
Colorado Springs Northwest |
1984 | 108,976 | 100.0 | % | 2,050,233 | 18.81 | |||||||||
| 5755 Mark Dabling Boulevard Colorado Springs, CO |
Colorado Springs Northwest |
1989 | 105,210 | 90.4 | % | 1,689,478 | 17.76 | |||||||||
| Subtotal/Average | 822,953 | 96.7 | % | $ | 14,261,358 | $ | 17.93 | |||||||||
Other: |
||||||||||||||||
| 11751 Meadowville Lane Chester, VA |
Richmond Southwest |
2007 | 193,000 | 100.0 | % | $ | 5,133,615 | $ | 26.60 | |||||||
| 201 Technology Park Drive Lebanon, VA |
Southwest Virginia | 2007 | 102,842 | 100.0 | % | 3,014,657 | 29.31 | |||||||||
| 607 Lakeside Drive Cascade, MD |
Fort Ritchie | 1990/2007 | 4,904 | 100.0 | % | 78,464 | 16.00 | |||||||||
| Subtotal/Average | 300,746 | 100.0 | % | $ | 8,226,736 | $ | 27.35 | |||||||||
| Total/Average | 17,831,629 | 92.6 | % | $ | 352,608,740 | $ | 21.36 | |||||||||
28
The following table provides certain information about our wholly owned properties that are under construction, development and redevelopment as of December 31, 2007:
| Property and Location |
Submarket |
Estimated Rentable Square Feet Upon Completion |
Percentage Leased/ Committed |
|||||
|---|---|---|---|---|---|---|---|---|
| Under Construction | ||||||||
Baltimore/Washington Corridor: |
||||||||
| 302 Sentinel Drive (302 NBP) Annapolis Junction, MD |
BWI Airport | 157,146 | 51.33 | % | ||||
| 5520 Research Park Drive (UMBC) Baltimore, MD |
BWI Airport | 110,400 | 0.00 | % | ||||
| 1362 Mellon Road Hanover, MD |
BWI Airport | 44,134 | 0.00 | % | ||||
| Subtotal/Average | 311,680 | 25.88 | % | |||||
| Colorado Springs: | ||||||||
| 655 Space Center Drive (Patriot Park 6) Colorado Springs, CO |
Colorado Springs East | 103,970 | 72.14 | % | ||||
| 1055 North Newport Road Colorado Springs, CO |
Colorado Springs East | 59,763 | 100.00 | % | ||||
| 9945 Federal Drive (Hybrid I) Colorado Springs, CO |
I-25 North Corridor | 73,940 | 0.00 | % | ||||
| 9925 Federal Drive (Hybrid II) Colorado Springs, CO |
I-25 North Corridor | 53,845 | 0.00 | % | ||||
| Subtotal/Average | 291,518 | 46.23 | % | |||||
| San Antonio: | ||||||||
| 8611 Military Drive, Building HI San Antonio, TX |
San Antonio | 52,352 | 100.00 | % | ||||
| 8611 Military Drive, Building C San Antonio, TX |
San Antonio | 38,255 | 100.00 | % | ||||
| Subtotal/Average | 90,607 | 100.00 | % | |||||
| Total Under Construction | 693,805 | 44.11 | % | |||||
| Under Development | ||||||||
Baltimore/Washington Corridor: |
||||||||
| 300 Sentinel Drive (300 NBP) Annapolis Junction, MD |
BWI Airport | 190,000 | N/A | |||||
| 324 Sentinel Drive (324 NBP) Annapolis Junction, MD |
BWI Airport | 125,000 | N/A | |||||
| 6721 Columbia Gateway Drive Columbia, MD |
Howard Co. Perimeter | 125,000 | N/A | |||||
| Riverwood I & II Columbia, MD |
Howard Co. Perimeter | 70,000 | N/A | |||||
| Subtotal/Average | 510,000 | N/A | ||||||
| Suburban Maryland: | ||||||||
| 110 Thomas Johnson Drive, Bldg #2 Frederick, MD |
Frederick | 85,000 | N/A | |||||
| Suburban Baltimore: | ||||||||
| 8130 Corporate Drive White Marsh, MD |
White Marsh | 125,000 | N/A | |||||
| Northgate Business Park (Lot A) Aberdeen, MD |
Harford County | 80,000 | N/A | |||||
| Subtotal/Average | 205,000 | N/A | ||||||
| St. Mary's & King George Counties: | ||||||||
| 16444 Commerce Drive Dahlgren, VA |
King George County | 57,000 | N/A | |||||
29
| Property and Location |
Submarket |
Estimated Rentable Square Feet Upon Completion |
Percentage Leased/ Committed |
|||||
|---|---|---|---|---|---|---|---|---|
Colorado Springs: |
||||||||
| 10807 New Allegiance Drive (Epic One) Colorado Springs, Colorado |
I-25 North Corridor | 145,723 | N/A | |||||
| 565 Space Center Drive (Patriot Park 7) Colorado Springs, Colorado |
Colorado Springs East | 89,773 | N/A | |||||
| Subtotal/Average | 235,496 | N/A | ||||||
| Total Under Development | 1,092,496 | N/A | ||||||
| Under Redevelopment | ||||||||
Colorado Springs: |
||||||||
9965 Federal Drive Colorado Springs, CO |
I-25 North Corridor |
74,749 |
100.00 |
% |
||||
| Total Under Redevelopment | 74,749 | 100.00 | % | |||||
The following table provides certain information about our wholly owned developable land holdings not under construction or development as of December 31, 2007:
| Land Location |
Submarket |
Acres |
Estimated Developable Square Feet |
||||
|---|---|---|---|---|---|---|---|
| Baltimore/Washington Corridor: | |||||||
| National Business Park (Phase III) Annapolis Junction, MD |
BWI Airport | 194 | 1,125,000 | ||||
| National Business Park (Phase II) Annapolis Junction, MD |
BWI Airport | 30 | 730,165 | ||||
| 1460 Dorsey Road Hanover, MD |
BWI Airport | 6 | 60,000 | ||||
| 940 Elkridge Landing Road (AS 7) Linthicum, MD |
BWI Airport | 3 | 53,941 | ||||
| 1243 Winterson Road (AS 22) Linthicum, MD |
BWI Airport | 2 | 30,000 | ||||
| Columbia Gateway Parcel T-11 Columbia, MD |
Howard Co. Perimeter | 14 | 220,000 | ||||
| 7125 Columbia Gateway Drive Columbia, MD |
Howard Co. Perimeter | 5 | 120,000 | ||||
| Subtotal | 254 | 2,339,106 | |||||
| Northern Virginia: | |||||||
| Westfields Corporate Center Chantilly, VA |
Dulles South | 32 | 674,200 | ||||
| Westfields Corporate Center Chantilly, VA |
Dulles South | 17 | 377,300 | ||||
| Westfields Corporate Center Chantilly, VA |
Dulles South | 19 | 246,800 | ||||
| Woodland Park Herndon, VA |
Herndon | 5 | 225,000 | ||||
| Subtotal | 73 | 1,523,300 | |||||
30
| Land Location |
Submarket |
Acres |
Estimated Developable Square Feet |
||||
|---|---|---|---|---|---|---|---|
| Suburban Maryland: | |||||||
| 110 Thomas Johnson Drive Frederick, MD |
Frederick | 3 | 85,000 | ||||
| Rockville Corporate Center Rockville, MD |
Rockville | 10 | 220,000 | ||||
| Subtotal | 13 | 305,000 | |||||
Suburban Baltimore: |
|||||||
| White Marsh White Marsh, MD |
White Marsh | 145 | 1,567,000 | ||||
| 37 Allegheny Avenue(1) Towson, MD |
Towson | — | 40,000 | ||||
| Northgate Business Park Aberdeen, MD |
Harford County | 51 | 720,000 | ||||
| Subtotal | 196 | 2,327,000 | |||||
St. Mary's & King George Counties: |
|||||||
| Dahlgren Technology Center Dahlgren, MD |
King George County | 32 | 65,000 | ||||
| Expedition Park Lexington Park, MD |
St. Mary's County | 6 | 60,000 | ||||
| Subtotal | 38 | 125,000 | |||||
Colorado Springs: |
|||||||
| InterQuest Colorado Springs, CO |
I-25 North Corridor | 111 | 1,626,492 | ||||
| 9965 Federal Drive Colorado Springs, CO |
I-25 North Corridor | 4 | 30,000 | ||||
| Patriot Park Colorado Springs, CO |
Colorado Springs East | 71 | 770,000 | ||||
| Aerotech Commerce Colorado Springs, CO |
Colorado Springs East | 6 | 90,000 | ||||
| Subtotal | 192 | 2,516,492 | |||||
San Antonio: |
|||||||
| San Antonio San Antonio, TX |
San Antonio | 31 | 375,000 | ||||
| San Antonio San Antonio, TX |
San Antonio | 27 | 350,000 | ||||
Subtotal |
58 |
725,000 |
|||||
Greater Philadelphia: |
|||||||
| Unisys Campus Blue Bell, PA |
Blue Bell | 45 | 600,000 | ||||
Northern/Central New Jersey: |
|||||||
| Princeton Technology Center Cranbury, NJ |
Exit 8A—Cranbury | 19 | 250,000 | ||||
Other: |
|||||||
| Fort Ritchie(2) Cascade, MD |
Cascade, MD | 591 | 1,700,000 | ||||
| Total Land | 1,479 | 12,410,898 | |||||
31
The following table provides certain information about our office properties owned through joint ventures as of December 31, 2007:
| Property and Location |
Submarket |
Year Built/ Renovated |
Rentable Square Feet |
Occupancy(1) |
Annualized Rental Revenue(2) |
Annualized Rental Revenue per Occupied Square Foot(2)(3) |
|||||||||
|---|---|---|---|---|---|---|---|---|---|---|---|---|---|---|---|
| Suburban Maryland: | |||||||||||||||
| 4230 Forbes Boulevard Prince Georges, MD |
Lanham | 2003 | 55,866 | 76.2 | % | $ | 671,487 | $ | 15.78 | ||||||
Northern Virginia: |
|||||||||||||||
| 2900 Towerview Road(4) Herndon, VA |
Route 28 South | 1982 | 78,171 | 100.0 | % | $ | 1,005,389 | $ | 12.86 | ||||||
Greater Harrisburg, Pennsylvania: |
|||||||||||||||
| 2605 Interstate Drive Harrisburg, PA |
East Shore | 1990 | 79,456 | 100.0 | % | $ | 1,451,661 | $ | 18.27 | ||||||
| 6345 Flank Drive Harrisburg, PA |
East Shore | 1989 | 69,443 | 88.5 | % | 856,251 | 13.93 | ||||||||
| 6340 Flank Drive Harrisburg, PA |
East Shore | 1988 | 68,200 | 100.0 | % | 785,559 | 11.52 | ||||||||
| 2601 Market Place Harrisburg, PA |
East Shore | 1989 | 65,411 | 87.1 | % | 1,077,893 | 18.92 | ||||||||
| 6400 Flank Drive Harrisburg, PA |
East Shore | 1992 | 52,439 | 77.8 | % | 577,743 | 14.17 | ||||||||
| 6360 Flank Drive Harrisburg, PA |
East Shore | 1988 | 46,500 | 86.0 | % | 525,349 | 13.14 | ||||||||
| 6385 Flank Drive Harrisburg, PA |
East Shore | 1995 | 32,921 | 20.6 | % | 93,070 | 13.75 | ||||||||
| 6380 Flank Drive Harrisburg, PA |
East Shore | 1991 | 32,668 | 100.0 | % | 457,072 | 13.99 | ||||||||
| 6405 Flank Drive Harrisburg, PA |
East Shore | 1991 | 32,000 | 100.0 | % | 401,634 | 12.55 | ||||||||
| 95 Shannon Road Harrisburg, PA |
East Shore | 1999 | 21,976 | 100.0 | % | 394,919 | 17.97 | ||||||||
| 75 Shannon Road Harrisburg, PA |
East Shore | 1999 | 20,887 | 100.0 | % | 416,917 | 19.96 | ||||||||
| 6375 Flank Drive Harrisburg, PA |
East Shore | 2000 | 19,783 | 100.0 | % | 347,398 | 17.56 | ||||||||
| 85 Shannon Road Harrisburg, PA |
East Shore | 1999 | 12,863 | 100.0 | % | 231,154 | 17.97 | ||||||||
| 5035 Ritter Road Mechanicsburg, PA |
West Shore | 1988 | 56,556 | 100.0 | % | 908,500 | 16.06 | ||||||||
| 5070 Ritter Road—Building A Mechanicsburg, PA |
West Shore | 1989 | 32,309 | 89.6 | % | 407,249 | 14.06 | ||||||||
| 5070 Ritter Road—Building B Mechanicsburg, PA |
West Shore | 1989 | 28,347 | 100.0 | % | 409,525 | 14.45 | ||||||||
| Subtotal/Average | 671,759 | 90.5 | % | $ | 9,341,894 | $ | 15.37 | ||||||||
Total/Average |
805,796 |
90.4 |
% |
$ |
11,018,770 |
$ |
15.13 |
||||||||
32
The following table provides certain information about our office properties owned through joint ventures that were under construction or redevelopment as of December 31, 2007:
| Property and Location |
Submarket |
Estimated Rentable Square Feet Upon Completion |
Percentage Leased/Committed |
|||||
|---|---|---|---|---|---|---|---|---|
| Under Construction | ||||||||
Baltimore/Washington Corridor: |
||||||||
| 7740 Milestone Parkway Hanover, MD |
BWI Airport | 151,800 | 0.00 | % | ||||
| Total Under Construction | 151,800 | 0.00 | % | |||||
Under Redevelopment |
||||||||
Baltimore/Washington Corridor: |
||||||||
| 7468 Candlewood Road Hanover, MD |
BWI Airport | 356,000 | 0.00 | % | ||||
Northern Virginia: |
||||||||
| 2900 Towerview Road(1) Herndon, VA |
Route 28 South | 58,866 | 0.00 | % | ||||
| 13849 Park Center Road Herndon, VA |
Route 28 South | 57,000 | N/A(2 | ) | ||||
| Subtotal/Average | 115,866 | 0.00 | % | |||||
| Total Under Redevelopment | 471,866 | 0.00 | % | |||||
The following table provides certain information about our developable land holdings owned through joint ventures that were not under construction or redevelopment as of December 31, 2007:
| Land Location |
Submarket |
Acres |
Estimated Developable Square Feet |
||||
|---|---|---|---|---|---|---|---|
| Baltimore/Washington Corridor: | |||||||
| Arundel Preserve Hanover, MD |
BWI Airport | 56 | 1,648,200 | ||||
Other: |
|||||||
| Indian Head Charles County, MD |
Charles County MD | 169 | 827,250 | ||||
Total Land |
225 |
2,475,450 |
|||||
33
Lease Expirations
The following table provides a summary schedule of the lease expirations for leases in place for our wholly owned properties as of December 31, 2007, assuming that none of the tenants exercise renewal options:
| Year of Lease Expiration(1) |
Number of Leases Expiring |
Square Footage of Leases Expiring |
Percentage of Total Occupied Square Feet |
Annualized Rental Revenue of Expiring Leases(2) |
Percentage of Total Annualized Rental Revenue Expiring(2) |
Total Annualized Rental Revenue of Expiring Leases per Occupied Square Foot |
||||||||
|---|---|---|---|---|---|---|---|---|---|---|---|---|---|---|
| |
(in thousands) |
|||||||||||||
| 2008 | 184 | 1,936,220 | 11.7 | % | $ | 39,323 | 11.2 | % | $ | 20.31 | ||||
| 2009 | 163 | 2,969,784 | 18.0 | % | 50,387 | 14.3 | % | 16.97 | ||||||
| 2010 | 160 | 2,056,484 | 12.5 | % | 46,978 | 13.3 | % | 22.84 | ||||||
| 2011 | 125 | 1,534,448 | 9.3 | % | 30,644 | 8.7 | % | 19.97 | ||||||
| 2012 | 126 | 2,447,463 | 14.8 | % | 51,997 | 14.7 | % | 21.25 | ||||||
| 2013 | 39 | 992,272 | 6.0 | % | 22,824 | 6.5 | % | 23.00 | ||||||
| 2014 | 27 | 727,776 | 4.4 | % | 20,769 | 5.9 | % | 28.54 | ||||||
| 2015 | 28 | 1,298,810 | 7.9 | % | 30,784 | 8.7 | % | 23.70 | ||||||
| 2016 | 20 | 485,182 | 2.9 | % | 12,054 | 3.4 | % | 24.84 | ||||||
| 2017 | 29 | 740,028 | 4.5 | % | 18,595 | 5.3 | % | 25.13 | ||||||
| 2018 | 5 | 333,455 | 2.0 | % | 8,566 | 2.4 | % | 25.69 | ||||||
| 2019 | 2 | 38,292 | 0.2 | % | 391 | 0.1 | % | 10.21 | ||||||
| 2020 | — | — | 0.0 | % | — | 0.0 | % | 0.00 | ||||||
| 2021 | 1 | 104,695 | 0.6 | % | 2,454 | 0.7 | % | 23.44 | ||||||
| 2022 | 2 | 295,842 | 1.8 | % | 8,148 | 2.3 | % | 27.54 | ||||||
| 2023 | — | — | 0.0 | % | — | 0.0 | % | 0.00 | ||||||
| 2024 | — | — | 0.0 | % | — | 0.0 | % | 0.00 | ||||||
| 2025 | 2 | 468,994 | 2.9 | % | 7,232 | 2.1 | % | 15.42 | ||||||
| Other(3) | 22 | 80,222 | 0.5 | % | 1,463 | 0.4 | % | 18.24 | ||||||
| Total/Weighted Average | 935 | 16,509,967 | 100.0 | % | $ | 352,609 | 100.0 | % | $ | 21.36 | ||||
Jim Lemon and Robin Biser, as plaintiffs, initiated a suit on May 12, 2005, in The United States District Court for the District of Columbia (Case No. 1:05CV00949), against The Secretary of the
34
United States Army, PenMar Development Corporation ("PMDC") and the Company, as defendants, in connection with the then pending acquisition by the Company of the former army base known as Fort Ritchie located in Cascade, Washington County, Maryland. The case was dismissed by the United States District Court on September 28, 2006, due to the plaintiffs' lack of standing. The plaintiffs filed an appeal in the case in the United States Court of Appeals for the District of Columbia Circuit and the Court of Appeals reversed the findings of the District Court and remanded the case to the District Court for further proceedings. The plaintiffs were unsuccessful in their request for an emergency injunction pending appeal. The Company acquired from PMDC fee simple title to 500 acres of the 591 acres comprising Fort Ritchie on October 5, 2006 and the remaining 91 acres on November 29, 2007.
We are not currently involved in any other material litigation nor, to our knowledge, is any material litigation currently threatened against the Company (other than routine litigation arising in the ordinary course of business, substantially all of which is expected to be covered by liability insurance).
Item 4. Submission of Matters to a Vote of Security Holders
Not applicable.
Item 5. Market for Registrant's Common Equity, Related Stockholder Matters and Issuer Repurchases of Equity Securities
Market Information
Our common shares trade on the New York Stock Exchange ("NYSE") under the symbol "OFC." The table below shows the range of the high and low sale prices for our common shares as reported on the NYSE, as well as the quarterly common share dividends per share declared:
| |
Price Range |
|
|||||||
|---|---|---|---|---|---|---|---|---|---|
| |
Dividends Per Share |
||||||||
| |
Low |
High |
|||||||
| 2006 | |||||||||
| First Quarter | $ | 34.91 | $ | 46.12 | $ | 0.280 | |||
| Second Quarter | $ | 37.32 | $ | 45.74 | $ | 0.280 | |||
| Third Quarter | $ | 40.65 | $ | 47.54 | $ | 0.310 | |||
| Fourth Quarter | $ | 44.21 | $ | 51.45 | $ | 0.310 | |||
| |
Price Range |
|
|||||||
|---|---|---|---|---|---|---|---|---|---|
| |
Dividends Per Share |
||||||||
| |
Low |
High |
|||||||
| 2007 | |||||||||
| First Quarter | $ | 44.85 | $ | 56.45 | $ | 0.310 | |||
| Second Quarter | $ | 40.47 | $ | 48.81 | $ | 0.310 | |||
| Third Quarter | $ | 35.21 | $ | 44.63 | $ | 0.340 | |||
| Fourth Quarter | $ | 30.81 | $ | 45.39 | $ | 0.340 | |||
The number of holders of record of our common shares was 401 as of December 31, 2007. This number does not include shareholders whose shares are held of record by a brokerage house or clearing agency, but does include any such brokerage house or clearing agency as one record holder.
We will pay future dividends at the discretion of our Board of Trustees. Our ability to pay cash dividends in the future will be dependent upon: (i) the income and cash flow generated from our operations; (ii) cash generated or used by our financing and investing activities; and (iii) the annual distribution requirements under the REIT provisions of the Code described above and such other factors as the Board of Trustees deems relevant. Our ability to make cash dividends will also be limited
35
by the terms of our Operating Partnership Agreement and our financing arrangements, as well as limitations imposed by state law and the agreements governing any future indebtedness.
Unregistered Sales of Equity Securities and Use of Proceeds
During the three months ended December 31, 2007, 1,200 of the Operating Partnership's common units were exchanged for 1,200 common shares in accordance with the Operating Partnership's Second Amended and Restated Limited Partnership Agreement, as amended. The issuance of these common shares was effected in reliance upon the exemption from registration under Section 4(2) of the Securities Act of 1933, as amended.
Common Shares Performance Graph
The graph and the table set forth below assume $100 was invested on December 31, 2002 in the common shares of Corporate Office Properties Trust. The graph and the table compare the cumulative return (assuming reinvestment of dividends) of this investment with a $100 investment at that time in the S&P 500 Index or the All Equity REIT Index of the National Association of Real Estate Investment Trusts ("NAREIT"):
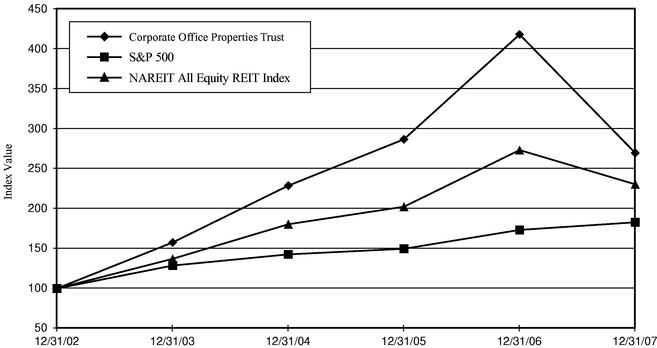
| |
Value at |
|||||||||||||||||
|---|---|---|---|---|---|---|---|---|---|---|---|---|---|---|---|---|---|---|
| Index |
||||||||||||||||||
| 12/31/02 |
12/31/03 |
12/31/04 |
12/31/05 |
12/31/06 |
12/31/07 |
|||||||||||||
| Corporate Office Properties Trust | $ | 100.00 | $ | 157.63 | $ | 228.82 | $ | 286.84 | $ | 418.15 | $ | 269.75 | ||||||
| S&P 500 | 100.00 | 128.68 | 142.69 | 149.70 | 173.34 | 182.86 | ||||||||||||
| NAREIT All Equity REIT Index | 100.00 | 137.13 | 180.44 | 202.38 | 273.34 | 230.45 | ||||||||||||
36
Item 6. Selected Financial Data
The following table sets forth summary financial data as of and for each of the years ended December 31, 2003 through 2007. The table illustrates the significant growth our Company experienced over the periods reported. Most of this growth, particularly pertaining to revenues, operating income and total assets, was attributable to our addition of properties through acquisition and development activities. We financed most of the acquisition and development activities by incurring debt and issuing preferred and common equity, as indicated by the growth in our interest expense, preferred share dividends and weighted average common shares outstanding. The growth in our general and administrative expenses reflects, in large part, the growth in management resources required to support the increased size of our portfolio. Since this information is only a summary, you should refer to our Consolidated Financial Statements and notes thereto and the section of this report entitled "Management's Discussion and Analysis of Financial Condition and Results of Operations" for additional information.
Corporate Office Properties Trust and Subsidiaries
(in thousands, except per share data and number of properties)
| |
2007 |
2006 |
2005 |
2004 |
2003 |
|||||||||||||
|---|---|---|---|---|---|---|---|---|---|---|---|---|---|---|---|---|---|---|
| Revenues | ||||||||||||||||||
| Revenues from real estate operations(1) | $ | 368,949 | $ | 293,578 | $ | 236,809 | $ | 199,501 | $ | 159,767 | ||||||||
| Construction contract and other service operations revenues | 41,225 | 60,084 | 79,234 | 28,903 | 31,740 | |||||||||||||
| Total revenues | 410,174 | 353,662 | 316,043 | 228,404 | 191,507 | |||||||||||||
| Expenses | ||||||||||||||||||
| Property operating expenses(1) | 123,282 | 92,907 | 70,337 | 57,888 | 46,513 | |||||||||||||
| Depreciation and other amortization associated with real estate operations(1) | 106,331 | 78,054 | 60,427 | 48,708 | 34,019 | |||||||||||||
| Construction contract and other service operations expenses | 39,793 | 57,345 | 77,287 | 26,996 | 30,933 | |||||||||||||
| General and administrative expenses | 20,523 | 16,936 | 13,533 | 10,938 | 7,893 | |||||||||||||
| Total operating expenses | 289,929 | 245,242 | 221,584 | 144,530 | 119,358 | |||||||||||||
| Operating income | 120,245 | 108,420 | 94,459 | 83,874 | 72,149 | |||||||||||||
| Interest expense and amortization of deferred financing costs(1) | (85,708 | ) | (73,107 | ) | (56,135 | ) | (43,843 | ) | (40,662 | ) | ||||||||
| Gain on sale of non-real estate investment | 1,033 | — | — | — | — | |||||||||||||
| Income from continuing operations before equity in loss of unconsolidated entities, income taxes and minority interests | 35,570 | 35,313 | 38,324 | 40,031 | 31,487 | |||||||||||||
| Equity in loss of unconsolidated entities | (224 | ) | (92 | ) | (88 | ) | (88 | ) | (98 | ) | ||||||||
| Income tax (expense) benefit | (569 | ) | (887 | ) | (668 | ) | (795 | ) | 169 | |||||||||
| Income from continuing operations before minority interests | 34,777 | 34,334 | 37,568 | 39,148 | 31,558 | |||||||||||||
| Minority interests in income from continuing operations(1) | (3,398 | ) | (3,826 | ) | (4,901 | ) | (5,029 | ) | (5,776 | ) | ||||||||
| Income from continuing operations | 31,379 | 30,508 | 32,667 | 34,119 | 25,782 | |||||||||||||
| Income from discontinued operations, net of minority interests(1)(2) | 1,845 | 17,987 | 6,096 | 3,026 | 4,759 | |||||||||||||
| Gain (loss) on sales of real estate, net(1)(3) | 1,560 | 732 | 268 | (113 | ) | 336 | ||||||||||||
| Net income | 34,784 | 49,227 | 39,031 | 37,032 | 30,877 | |||||||||||||
| Preferred share dividends | (16,068 | ) | (15,404 | ) | (14,615 | ) | (16,329 | ) | (12,003 | ) | ||||||||
| Issuance costs associated with redeemed preferred shares(4) | — | (3,896 | ) | — | (1,813 | ) | — | |||||||||||
| Repurchase of preferred units in excess of recorded book value(5) | — | — | — | — | (11,224 | ) | ||||||||||||
| Net income available to common shareholders | $ | 18,716 | $ | 29,927 | $ | 24,416 | $ | 18,890 | $ | 7,650 | ||||||||
37
| |
2007 |
2006 |
2005 |
2004 |
2003 |
||||||||||||
|---|---|---|---|---|---|---|---|---|---|---|---|---|---|---|---|---|---|
| Basic earnings per common share | |||||||||||||||||
| Income from continuing operations | $ | 0.36 | $ | 0.29 | $ | 0.49 | $ | 0.48 | $ | 0.11 | |||||||
| Net income available to common shareholders | $ | 0.40 | $ | 0.72 | $ | 0.65 | $ | 0.57 | $ | 0.29 | |||||||
| Diluted earnings per common share | |||||||||||||||||
| Income from continuing operations | $ | 0.35 | $ | 0.28 | $ | 0.47 | $ | 0.45 | $ | 0.10 | |||||||
| Net income available to common shareholders | $ | 0.39 | $ | 0.69 | $ | 0.63 | $ | 0.54 | $ | 0.27 | |||||||
| Weighted average common shares outstanding—basic | 46,527 | 41,463 | 37,371 | 33,173 | 26,659 | ||||||||||||
| Weighted average common shares outstanding—diluted | 47,630 | 43,262 | 38,997 | 34,982 | 28,021 | ||||||||||||
| Balance Sheet Data (as of year end): | |||||||||||||||||
| Investment in real estate | $ | 2,603,472 | $ | 2,111,310 | $ | 1,888,106 | $ | 1,544,501 | $ | 1,189,258 | |||||||
| Total assets | $ | 2,931,853 | $ | 2,419,601 | $ | 2,129,759 | $ | 1,732,026 | $ | 1,332,076 | |||||||
| Debt | $ | 1,825,842 | $ | 1,498,537 | $ | 1,348,351 | $ | 1,022,688 | $ | 738,698 | |||||||
| Total liabilities | $ | 1,979,116 | $ | 1,629,111 | $ | 1,442,036 | $ | 1,111,224 | $ | 801,899 | |||||||
| Minority interests | $ | 130,095 | $ | 116,187 | $ | 105,210 | $ | 98,878 | $ | 79,796 | |||||||
| Shareholders' equity | $ | 822,642 | $ | 674,303 | $ | 582,513 | $ | 521,924 | $ | 450,381 | |||||||
| Other Financial Data (for the year ended): | |||||||||||||||||
| Cash flows provided by (used in): | |||||||||||||||||
| Operating activities | $ | 137,701 | $ | 113,151 | $ | 95,944 | $ | 84,494 | $ | 67,783 | |||||||
| Investing activities | $ | (327,714 | ) | $ | (253,834 | ) | $ | (420,301 | ) | $ | (268,720 | ) | $ | (172,949 | ) | ||
| Financing activities | $ | 206,728 | $ | 137,822 | $ | 321,320 | $ | 188,566 | $ | 108,656 | |||||||
| Numerator for diluted EPS | $ | 18,716 | $ | 29,927 | $ | 24,416 | $ | 18,911 | $ | 7,650 | |||||||
| Diluted funds from operations(6) | $ | 125,309 | $ | 98,937 | $ | 88,801 | $ | 76,248 | $ | 61,268 | |||||||
| Diluted funds from operations per share(6) | $ | 2.24 | $ | 1.91 | $ | 1.86 | $ | 1.74 | $ | 1.56 | |||||||
| Cash dividends declared per common share | $ | 1.30 | $ | 1.18 | $ | 1.07 | $ | 0.98 | $ | 0.91 | |||||||
| Property Data (as of year end): | |||||||||||||||||
| Number of properties owned(1)(7) | 228 | 170 | 165 | 143 | 118 | ||||||||||||
| Total rentable square feet owned(1)(7) | 17,832 | 15,050 | 13,708 | 11,765 | 9,876 | ||||||||||||
38
Item 7. Management's Discussion and Analysis of Financial Condition and Results of Operations
You should refer to our Consolidated Financial Statements and the notes thereto and our Selected Financial Data table as you read this section.
This section contains "forward-looking" statements, as defined in the Private Securities Litigation Reform Act of 1995, that are based on our current expectations, estimates and projections about future events and financial trends affecting the financial condition and operations of our business. Forward-looking statements can be identified by the use of words such as "may," "will," "should," "expect," "estimate" or other comparable terminology. Forward-looking statements are inherently subject to risks and uncertainties, many of which we cannot predict with accuracy and some of which we might not even anticipate. Although we believe that the expectations, estimates and projections reflected in such forward-looking statements are based on reasonable assumptions at the time made, we can give no assurance that these expectations, estimates and projections will be achieved. Future events and actual results may differ materially from those discussed in the forward-looking statements. Important factors that may affect these expectations, estimates and projections include, but are not limited to:
We undertake no obligation to update or supplement forward-looking statements.
Overview
We are a real estate investment trust ("REIT") that focuses on the acquisition, development, ownership, management and leasing of suburban office properties in select markets and submarkets. We also focus on servicing the multi-location requirements of strategic customers and strategic industries in which tenants have specialized product requirements. Our properties are typically concentrated in large office parks located in demographically strong markets and submarkets where we believe we can achieve critical mass, operating synergies and key competitive advantages, including attracting high quality tenants and securing acquisition and development opportunities, and/or located near demand drivers for strategic customers and industries. As of December 31, 2007, our investments in real estate included the following:
39
REITs were created by the United States Congress in order to provide large numbers of investors with the ability to make investments into entities that own large scale commercial real estate. One unique aspect of a REIT is that the entity typically does not pay corporate income tax, provided that the entity distributes 100% of its taxable income to its shareholders and meets a number of other specific requirements of the Internal Revenue Code of 1986, as amended (it is noteworthy that REITs are required to distribute a minimum of only 90% of taxable income to maintain their tax status as a REIT, although any differential between the 90% and 100% would be taxable). Most of our revenues relating to our real estate operations are derived from rents and property operating expense reimbursements earned from tenants leasing space in our properties. Most of our expenses relating to our real estate operations take the form of: (1) property operating costs, such as real estate taxes, utilities and repairs and maintenance; (2) financing costs, such as interest and loan costs; and (3) depreciation and amortization associated with our operating properties.
Of the 228 wholly owned operating properties in our portfolio, 213 were located in the Mid-Atlantic region of the United States. Our primary regions as of December 31, 2007 are set forth below:
As of December 31, 2007, 138 of our properties were located in what is widely known as the Greater Washington, D.C. region, which includes the first four regions set forth above, and 64 were located in neighboring Suburban Baltimore. At December 31, 2007, we also owned 13 wholly owned properties in Colorado Springs and two in San Antonio. In addition, we owned eight properties in total as of December 31, 2007 in the last two locations set forth above that are considered non-core to the Company. The most significant change in our geographical concentration in 2007 occurred as a result of our completion of the Nottingham Acquisition (discussed below), which approximately doubled our concentration in the Suburban Baltimore region. We discuss further the geographic concentrations of our property ownership in the section below entitled "Concentration of Operations."
Part of our strategy for operations and growth focuses on establishing, maintaining and expanding strategic customer relationships in multiple locations to make us the landlord of choice for such customers. As a result of this strategy, a large concentration of our revenue is derived from several large tenants. Our largest tenants are also heavily concentrated with the United States defense industry,
40
with such tenants predominantly concentrated in the area of defense information technology. Several noteworthy statistics that demonstrate our tenant and industry concentrations are set forth below:
| |
Percentage of Annualized Rental Revenue(1) of Wholly Owned Properties at December 31, 2007 |
||
|---|---|---|---|
| Largest tenant, United States Government | 16.3 | % | |
| Five largest tenants | 35.0 | % | |
| Twenty largest tenants | 54.8 | % | |
| Tenants in the United States defense industry | 47.9 | % |
We discuss further our lease concentrations in the section below entitled "Concentration of Operations."
In order to maximize the revenue potential of our properties, we try to maintain high levels of occupancy; as a result, we consider occupancy rates to be an important measure of the productivity of our properties. One way that we attempt to maximize occupancy rates is by renewing a high percentage of our existing tenants; accordingly, tenant renewal rates are important to us in monitoring our leasing activities and tenant relationships. In managing the effect of our leasing activities on our financial position and future operating performance stability, we also monitor the timing of our lease maturities with the objective that the timing of such maturities not be highly concentrated in a given one-year or five-year period. The table below sets forth certain occupancy and leasing information as of or for the year ended December 31, 2007 for our portfolio of wholly owned properties:
| Occupancy | 92.6 | % | ||
| Renewal rate of square footage for scheduled lease expirations during year | 69.1 | % | ||
| Average contractual annual rental rate per square foot(1) | $ | 21.36 | ||
| Weighted average lease term (in years)(2) | 5.0 |
We discuss further in the section below entitled "Results of Operations," in the subsection entitled "Occupancy and Leasing."
Achieving optimal performance from our properties is highly important to us. We evaluate the performance of our properties by focusing on changes in revenues from real estate operations (comprised of (1) rental revenue and (2) tenant recoveries and other real estate operations revenue) and property operating expenses. However, since we have experienced significant growth in a number of operating properties, assessing performance from our growth in revenues from real estate operations and property operating expenses without further analysis of the components of such growth can be misleading. Therefore, we evaluate (1) changes in revenues from real estate operations and property operating expenses attributable to property additions separately from (2) the changes attributable to properties that were owned and 100% operational throughout any two periods being compared (properties that we collectively refer to as the Same-Office Properties). During 2007, we:
41
We discuss these changes further in the section below entitled "Results of Operations," in the subsection entitled "Revenues from Real Estate Operations and Property Operating Expenses."
In addition to owning real estate properties, we provide real estate-related services that include: (1) property management; (2) construction and development management; and (3) heating and air conditioning services and controls. The gross revenue and costs associated with these services generally bear little relationship to the level of our activity from these operations since a substantial portion of the costs are subcontracted costs that are reimbursed to us by the customer at no mark up. As a result, the operating margins from these operations are small relative to the revenue. We use the net of such revenues and expenses to evaluate the performance of our service operations. For 2007, the operating margins of our service operations decreased $1.3 million compared to 2006 due primarily to: (1) a slow down in activity on certain third party constructions jobs; and (2) a decrease in third party work for heating and air conditioning controls and plumbing services. These operations are discussed further in the section below entitled "Results of Operations," in the subsection entitled "Construction Contract and Other Service Revenue and Expenses."
Our 2007 net income available to common shareholders decreased 37.5% and our diluted earnings per share decreased 43.5% compared to 2006. We discuss significant factors contributing to these changes within subsections of the section below entitled "Results of Operations."
The investment portion of our growth strategy focuses primarily on two activities: acquisitions and property development. These activities typically target suburban office properties in our existing geographic regions, neighboring regions or new regions meeting our investment criteria, but they may also target other properties that meet the multi-location requirements of our strategic customers and strategic industries. Since we take an opportunistic yet disciplined approach to our investment activities, the volume of these activities and allocation between acquisitions versus development naturally change from year to year. Highlights of our 2007 acquisition and development activities are set forth below:
42
While we generally do not acquire properties with the intent of selling them, we do sell properties from time to time when we believe that most of the earnings growth potential in those properties have been realized, or determine that the property no longer fits within our strategic plans due to its type and/or location. During 2007, we sold four operating properties totaling 128,000 square feet (including two from one of our non-core regions and one acquired in the Nottingham Acquisition) and three parcels of land acquired in the Nottingham Acquisition totaling approximately 16 acres and developable into approximately 230,000 square feet for a total of $26.5 million, resulting in recognized gains before minority interest and taxes on gain on sale of real estate totaling $6.9 million (we incurred $1.1 million in income tax expense on these sales due primarily to built in gains that existed for certain of these properties).
Our financing policy is aimed at maintaining a flexible capital structure in order to facilitate consistent growth and performance in the face of differing market conditions in the most cost-effective manner. As part of this policy, we monitor: (1) levels of debt relative to our overall capital structure; (2) the relationship of certain measures of earnings to certain financing cost requirements (coverage ratios); (3) the relationship of our total variable-rate debt to our total debt; and (4) the timing of our debt maturities to ensure that the maximum maturities of debt in any year do not exceed a defined percentage of total assets. We also pursue opportunities, when we believe market conditions to be favorable, to: (1) reduce financing costs by refinancing existing debt or redeeming existing preferred equity; (2) issue common and preferred shares of beneficial interest ("common shares" and "preferred shares"); (3) issue equity units in our Operating Partnership; and (4) reduce our equity investment requirements in certain properties through the use of joint venture structures. Highlights of our 2007 financing activities are set forth below:
We discuss our 2007 investing and financing activities further in the section below entitled "Liquidity and Capital Resources," along with discussions of, among other things, the following:
43
Critical Accounting Policies and Estimates
Our Consolidated Financial Statements are prepared in accordance with generally accepted accounting principles in the United States of America ("GAAP"), which require us to make certain estimates and assumptions. A summary of our significant accounting policies is provided in Note 2 to our Consolidated Financial Statements. The following section is a summary of certain aspects of those accounting policies involving estimates and assumptions that (1) require our most difficult, subjective or complex judgments in accounting for highly uncertain matters or matters that are susceptible to change and (2) materially affect our reported operating performance or financial condition. It is possible that the use of different reasonable estimates or assumptions in making these judgments could result in materially different amounts being reported in our Consolidated Financial Statements. While reviewing this section, you should refer to Note 2 to our Consolidated Financial Statements, including terms defined therein.
44
based on our estimates of how long we expect the respective tenants to remain in the properties; establishing these lives requires estimates and assumptions that are very subjective.
45
a fair amount of judgment. As a result, these estimates and assumptions can affect the amount of expense that we recognize in our Consolidated Financial Statements for options and restricted shares.
Concentration of Operations
One measure that we refer to in various sections of the Management's Discussion and Analysis of Financial Condition and Results of Operations section of this Annual Report on Form 10-K is annualized rental revenue. Annualized rental revenue is a measure that we use to evaluate the source of our rental revenue as of a point in time. It is computed by multiplying by 12 the sum of monthly contractual base rents and estimated monthly expense reimbursements under active leases as of a point in time. We consider annualized rental revenue to be a useful measure for analyzing revenue sources because, since it is point-in-time based, it does not contain increases and decreases in revenue associated with periods in which lease terms were not in effect; historical revenue under GAAP does contain such fluctuations. We find the measure particularly useful for leasing, tenant, segment and industry analysis.
Geographic Concentration of Property Operations
Our market strategy is to concentrate our operations in select markets and submarkets where we believe we already possess or can achieve the critical mass necessary to maximize management efficiencies, operating synergies and competitive advantages through our acquisition, property management, leasing and development programs. A result of this strategy is that our property positions and operations are highly concentrated in a small number of geographic regions. The table below sets forth the regional allocation of our annualized rental revenue as of the end of the last three calendar years:
| |
Percentage of Annualized Rental Revenue of Wholly Owned Properties as of December 31, |
Number of Wholly Owned Properties as of December 31, |
||||||||||
|---|---|---|---|---|---|---|---|---|---|---|---|---|
| Region |
||||||||||||
| 2007 |
2006 |
2005 |
2007 |
2006 |
2005 |
|||||||
| Baltimore/Washington Corridor | 46.2 | % | 51.2 | % | 47.8 | % | 101 | 87 | 82 | |||
| Northern Virginia | 19.4 | % | 20.5 | % | 21.5 | % | 14 | 14 | 13 | |||
| Suburban Baltimore | 14.1 | % | 7.5 | % | 10.1 | % | 64 | 23 | 25 | |||
| Suburban Maryland | 4.3 | % | 4.1 | % | 5.2 | % | 5 | 5 | 7 | |||
| Colorado Springs | 4.0 | % | 4.2 | % | 1.7 | % | 13 | 11 | 5 | |||
| St. Mary's and King George Counties | 3.5 | % | 4.2 | % | 4.3 | % | 18 | 18 | 18 | |||
| Greater Philadelphia | 3.1 | % | 3.7 | % | 4.0 | % | 4 | 4 | 4 | |||
| San Antonio | 2.1 | % | 2.4 | % | 1.5 | % | 2 | 2 | 2 | |||
| Northern/Central New Jersey | 1.0 | % | 2.2 | % | 3.9 | % | 4 | 6 | 9 | |||
| Other | 2.3 | % | N/A | N/A | 3 | N/A | N/A | |||||
| 100.0 | % | 100.0 | % | 100.0 | % | 228 | 170 | 165 | ||||
The most significant change in the regional allocation from December 31, 2006 to December 31, 2007 occurred as a result of the Nottingham Acquisition which, due to the large number of properties located in Suburban Baltimore, significantly increased that region's allocation and had a decreasing effect on the other regions, although the resulting decrease in the Baltimore/Washington Corridor was offset slightly by the effects in that region of (1) the properties acquired in that region in the Nottingham Acquisition and (2) newly-constructed properties placed into service in 2007. The most significant changes in the regional allocation from December 31, 2005 to December 31, 2006 occurred as a result of property acquisitions in the Baltimore/Washington Corridor and Colorado Springs and the sale of properties in Suburban Baltimore and Suburban Maryland. It is also noteworthy that our
46
allocation in Northern/Central New Jersey has decreased over the last two years due primarily to our sale of properties in that region.
As of December 31, 2007, we had construction underway on four wholly owned properties in Colorado Springs, three wholly owned properties in the Baltimore/Washington Corridor and two wholly owned properties in San Antonio; we expect that these properties will be completed and begin generating rental revenue between 2008 and 2009. We also have redevelopment activities underway on one wholly owned property in Colorado Springs that we expect to be completed and to begin generating rental revenue between 2008 and 2009.
Concentration of Leases With Certain Tenants
Our customer strategy focuses on establishing, maintaining and expanding strategic customer relationships in multiple locations. A result of this strategy is that the source of our revenue is highly concentrated with certain tenants. The following schedule lists our 20 largest tenants in our portfolio of wholly owned properties based on percentage of annualized rental revenue:
| |
Percentage of Annualized Rental Revenue of Wholly Owned Properties for 20 Largest Tenants as of December 31, |
||||||
|---|---|---|---|---|---|---|---|
| Tenant |
|||||||
| 2007 |
2006 |
2005 |
|||||
| United States Government | 16.3 | % | 16.3 | % | 15.2 | % | |
| Northrop Grumman Corporation(1) | 7.4 | % | 4.2 | % | 4.5 | % | |
| Booz Allen Hamilton, Inc. | 5.6 | % | 6.9 | % | 5.0 | % | |
| Computer Sciences Corporation(1) | 3.2 | % | 3.8 | % | 4.1 | % | |
| Unisys Corporation(2) | 2.5 | % | 3.0 | % | 3.1 | % | |
| L-3 Communications Holdings, Inc.(1) | 2.5 | % | 3.0 | % | 3.4 | % | |
| General Dynamics Corporation | 2.1 | % | 2.4 | % | 2.6 | % | |
| The Aerospace Corporation | 1.9 | % | 2.1 | % | 2.2 | % | |
| Wachovia Corporation(1) | 1.9 | % | 2.1 | % | 2.1 | % | |
| Comcast Corporation | 1.7 | % | N/A | N/A | |||
| AT&T Corporation(1) | 1.7 | % | 3.0 | % | 2.7 | % | |
| The Boeing Company(1) | 1.2 | % | 1.4 | % | 1.6 | % | |
| ITT Corporation(1) | 1.1 | % | 0.8 | % | N/A | ||
| Ciena Corporation | 1.0 | % | 1.2 | % | 1.3 | % | |
| Science Applications International Corporation | 0.9 | % | 1.1 | % | N/A | ||
| BAE Systems PLC(1) | 0.8 | % | 1.0 | % | N/A | ||
| Johns Hopkins University | 0.8 | % | N/A | 1.0 | % | ||
| Merck & Co., Inc.(2) | 0.8 | % | 0.8 | % | 0.9 | % | |
| Magellan Health Services, Inc. | 0.7 | % | 1.0 | % | 1.1 | % | |
| Wyle Laboratories, Inc. | 0.7 | % | 0.8 | % | 0.9 | % | |
| Lockheed Martin Corporation | N/A | 1.0 | % | 1.0 | % | ||
| Harris Corporation | N/A | 0.8 | % | N/A | |||
| VeriSign, Inc. | N/A | N/A | 1.3 | % | |||
| PricewaterhouseCoopers LLP | N/A | N/A | 1.0 | % | |||
| Carefirst, Inc. and Subsidiaries(1) | N/A | N/A | 0.9 | % | |||
| Subtotal of 20 largest tenants | 54.8 | % | 56.7 | % | 55.9 | % | |
| All remaining tenants | 45.2 | % | 43.3 | % | 44.1 | % | |
| Total | 100.0 | % | 100.0 | % | 100.0 | % | |
Most of the changes in our tenant concentration over the last two years occurred as a result of development, acquisition and leasing activities. From a development perspective in 2007, we had
47
548,614 square feet in newly-constructed properties become operational, of which 295,842 square feet were leased to Northrop Grumman Corporation and 166,179 to the United States Government. From an acquisition perspective in 2007, the Nottingham Acquisition was our only significant acquisition of properties; since none of our 20 largest tenants as of December 31, 2006 had significant leasing positions in the properties acquired in that transaction, the transaction: (1) had a decreasing effect on the level of concentration with those tenants; and (2) led to the addition of Comcast Corporation and Johns Hopkins University as being among our 20 largest tenants.
Most of our leases with the United States Government provide for a series of one-year terms or provide for early termination rights. The government may terminate its leases if, among other reasons, the United States Congress fails to provide funding.
Industry Concentration of Tenants
Under our industry strategy, we focus on strategic industries in which tenants have specialized product requirements. A high concentration of our revenues is generated from the United States defense industry (comprised of the United States Government and defense contractors), of which substantially all is associated with defense information technology activities. These tenants are particularly interested in a number of our property markets and submarkets that are located near government installations. We also enable these tenants to benefit from our significant experience in constructing and operating secure properties and properties that meet the United States Government's Force Protection requirements. The table below sets forth the percentage of annualized rental revenue in our portfolio of wholly owned properties derived from that industry:
| |
Percentage of Annualized Rental Revenue of Wholly Owned Properties from Defense Industry Tenants as of December 31, |
||||||
|---|---|---|---|---|---|---|---|
| |
2007 |
2006 |
2005 |
||||
| Total Portfolio | 47.9 | % | 54.4 | % | 49.7 | % | |
| Baltimore/Washington Corridor | 65.3 | % | 66.7 | % | 65.7 | % | |
| Northern Virginia | 50.3 | % | 54.5 | % | 50.4 | % | |
| Suburban Baltimore | 5.3 | % | 9.8 | % | 6.8 | % | |
| Suburban Maryland | 11.2 | % | 13.3 | % | 2.2 | % | |
| Colorado Springs | 37.8 | % | 39.4 | % | 74.1 | % | |
| St. Mary's and King George Counties | 90.0 | % | 89.8 | % | 90.7 | % | |
| San Antonio | 100.0 | % | 100.0 | % | 100.0 | % | |
With the exception of 2007, the percentage of our annualized rental revenue in our wholly owned properties derived from the United States defense industry has generally increased in recent years due in large part to the continuing expansion trend of the industry in the Greater Washington, D.C. region and, in particular, in our submarkets since the events of September 11, 2001. This percentage did decrease for the total portfolio and in the Suburban Baltimore and Baltimore/Washington Corridor regions in 2007 due primarily to the Nottingham Acquisition, since the properties included in the transaction had an insignificant number of tenants in that industry. This decreasing effect overall and in the Baltimore/Washington Corridor was offset to a certain extent by new leasing in 2007 to tenants in that industry which included, among other things, the effect of the delivery of 166,179 square feet in newly constructed properties in the Baltimore/Washington Corridor. The increase in 2006 for the total portfolio included the effect of certain properties that we acquired or constructed and placed in service in 2006 having leases with the United States Government and defense contractors.
48
We classify the revenue from our leases into industry groupings based solely on our knowledge of the tenants' operations in leased space. Occasionally, classifications require subjective and complex judgments. For example, we have a tenant that is considered by many to be in the computer industry; however, since the nature of that tenant's operations in the space leased from us is focused on providing service to the United States Government's defense department, we classify the revenue we earn from the lease as United States defense industry revenue. We do not use independent sources such as Standard Industrial Classification codes for classifying our revenue into industry groupings and if we did, the resulting groupings would be materially different.
In 2007, leases commenced for two newly constructed properties totaling 295,842 square feet that will function as data centers. These properties, when added to a number of data centers already existing in our portfolio, represent a growing concentration in that industry/property type.
Results of Operations
While reviewing this section, you should refer to the tables in the section entitled "Selected Financial Data." You should also refer to the section below entitled "Liquidity and Capital Resources" for certain factors that could negatively affect various aspects of our operations.
Occupancy and Leasing
The table below sets forth leasing information pertaining to our portfolio of wholly owned operating properties:
| |
December 31, |
||||||||||
|---|---|---|---|---|---|---|---|---|---|---|---|
| |
2007 |
2006 |
2005 |
||||||||
| Occupancy rates at year end | |||||||||||
| Total | 92.6 | % | 92.8 | % | 94.0 | % | |||||
| Baltimore/Washington Corridor | 92.6 | % | 95.1 | % | 96.2 | % | |||||
| Northern Virginia | 98.6 | % | 90.9 | % | 96.4 | % | |||||
| Suburban Baltimore | 84.8 | % | 81.1 | % | 84.7 | % | |||||
| Suburban Maryland | 97.8 | % | 83.2 | % | 79.8 | % | |||||
| Colorado Springs | 96.7 | % | 92.8 | % | 85.8 | % | |||||
| St. Mary's and King George Counties | 91.6 | % | 92.1 | % | 95.4 | % | |||||
| Greater Philadelphia | 100.0 | % | 100.0 | % | 100.0 | % | |||||
| San Antonio | 100.0 | % | 100.0 | % | 100.0 | % | |||||
| Northern/Central New Jersey | 70.8 | % | 97.2 | % | 96.4 | % | |||||
| Other | 100.0 | % | N/A | N/A | |||||||
| Renewal rate of square footage for scheduled lease expirations during year(1) | 69.1 | % | 55.4 | % | 66.6 | % | |||||
| Average contractual annual rental rate per square foot at year end(2) | $ | 21.36 | $ | 20.90 | $ | 20.28 | |||||
As shown in the above table, the total year end occupancy rate for our portfolio of wholly owned properties did not change significantly from 2006 to 2007. The 2007 year end occupancy was negatively affected by the operating properties included in the Nottingham Acquisition, which were 85.7% occupied at the time the transaction was completed and 86.5% occupied at December 31, 2007. We also had a decrease in occupancy in our Northern/Central New Jersey region that was attributable primarily to a lease termination at our 429 Ridge Road property in Dayton, New Jersey (we sold the 429 Ridge Road property on January 31, 2008). However, we had a net increase in occupancy in our other properties that significantly offset the decreasing effects of the Nottingham Acquisition and the
49
429 Ridge Road property. The significant increase in the year end occupancy rate of our Northern Virginia region from 2006 to 2007 was attributable to two large building spaces that had leases commence in early 2007. The significant increase in the year end occupancy rate of our Suburban Maryland region from 2006 to 2007 was due primarily to significant leasing activity in two properties in that region.
The decrease in our total year end occupancy rate from 2005 to 2006 for our portfolio of wholly owned properties reflected the adverse impact of the two large building spaces in Northern Virginia discussed above that were vacant at December 31, 2006 and leased in early 2007. The 2006 year end occupancy rates were positively impacted by acquisitions of wholly owned properties completed in 2006, with such properties carrying a weighted average occupancy rate of 95.1% at December 31, 2006.
Our renewal rates of square footage for scheduled lease expirations decreased in 2006 but increased in 2007; the 2006 rate in particular was low in comparison to the other calendar years within the 2000 through 2007 timeframe, when the annual renewal rate ranged from 66% to 76% and averaged 70% (when excluding the 2006 calendar year). The 2006 renewal rate was adversely affected by large amounts of space in newly acquired properties that we knew were not going to be renewed when we acquired such properties, including 197,000 square feet in two properties; our renewal rates would have been in the low to mid 60% range without the effect of this space. We believe if we are successful in implementing our customer strategy that we should be able to post renewal rates that approximate our historical average in the future.
Our average contractual annual rent per square foot increased 2.2% from December 31, 2006 to December 31, 2007 despite the fact that such rate was negatively affected by the operating properties included in the Nottingham Acquisition, the rate per square foot of which was $16.98 at December 31, 2007, or 21% below our wholly owned portfolio rate. Our average contractual annual rent per square foot increased 3.0% from December 31, 2005 to December 31, 2006 despite the fact that such rate was negatively affected by acquisitions completed during 2006, the rate per square foot of which was $14.12 at December 31, 2006, or 32% below our wholly owned portfolio rate. The year end average contractual rental rate per square foot increased from 2006 to 2007 and from 2005 to 2006 despite being negatively affected by these acquisitions due primarily to the effect of new leases entered into at a higher rate during each of those years and scheduled increases that took place at leases remaining in place. The lower average contractual annual rent per square foot on operating properties included in the Nottingham Acquisition and the acquisitions completed in 2006 can be attributed primarily to the following: (1) lower rents in geographic areas where certain of these acquisitions took place; (2) lower costs for operating expenses and tenant improvements associated with underlying leases in certain of these acquisitions; and (3) lower rents associated with lower grade space in certain of these acquisitions.
We believe that there is a fair amount of uncertainty surrounding the outlook for leasing activity for our overall portfolio in 2008 and 2009. Certain national key economic indicators such as employment growth, gross domestic product and housing starts, combined with turmoil in the financial markets brought about in large part in response to the sub-prime mortgage market decline, have caused disruption to the United States economy and capital markets. While we do not believe that the effects of these developments in the economy significantly impacted our 2007 leasing performance, we believe that it could impact our performance in 2008 and 2009, and possibly beyond, as we believe that there is generally a lag in time before economic developments affect the office real estate market. We do believe that our overall portfolio from a leasing and occupancy perspective may not be affected to the same extent as some of our peers in the office real estate industry due in large part to: (1) the quality of our tenant base from a credit risk perspective and our ability to retain such tenants; (2) our concentration of tenants in the United States defense industry, particularly in the area of defense information technology, the need for which we do not believe will diminish in the foreseeable future; and (3) higher than average likelihood for stability in our markets and submarkets due to their proximity to large demand drivers (such as government installations), strong demographics and
50
attractiveness to high quality tenants. We believe that reporting by the Base Realignment and Closure Commission of the United States Congress ("BRAC"), which is charged with reallocating personnel between government installations, favors the reallocation of additional personnel to many of the regions in which our properties are located, although there is some uncertainty over the level and timing of such reallocations.
We believe that market level occupancy rates in many of our markets may have peaked or started to decline during 2007 from a quarter to quarter trending perspective, although we believe that the occupancy rate in our properties was generally higher than the market level occupancy rate in most of our markets. In our largest geographic region concentration, the Baltimore/Washington Corridor, we are facing a higher level of competition than we have historically due to new firms entering the market with additional new space to a large extent in anticipation of the expansion brought about by the BRAC activities. In our second largest regional concentration, Northern Virginia, market level occupancy rates are trending downwards and speculative construction of additional space in the market is nearing completion and, as a result, could further decrease occupancy rates; however, we believe that we are somewhat protected in the short run in the Northern Virginia region since, with the exception of calendar year 2010 (when 20.6% of our annualized rental revenues at December 31, 2007 from that region were scheduled to expire), no more than 7.0% of the annualized rental revenues at December 31, 2007 from that region were scheduled to expire in any one calendar year between 2008 and 2013. All of our properties in the Greater Philadelphia region are concentrated under three leases with Unisys that expire in June 2009 (although Unisys subleases approximately 20% of this space to Merck), and we believe that Unisys does not intend to renew the majority of the space; we have commenced activities to re-lease this space.
We did experience increased delays in 2007 in the leasing of certain projects under construction that were not pre-leased. These delays resulted in the delay of some square footage under construction from becoming operational and also led to our deferral of certain projects under development on which we were about to commence construction. We do believe that we need to continue to commence construction on properties that are not pre-leased to a certain extent in certain of our markets to enable us to meet the demand of tenants that require space meeting their needs in a short timeframe.
Despite the continued uncertainty regarding our 2008 leasing outlook, we believe that we are somewhat protected in the short run from a slow down in leasing activity since the weighted average lease term for our wholly owned properties at December 31, 2007 was five years. In addition, only 11.2% of our annualized rental revenues at December 31, 2007 were from leases scheduled to expire by the end of 2008. Looking longer term, 62.2% of our annualized rental revenues on leases in place as of December 31, 2007 were from leases scheduled to expire by the end of 2012, with no more than 15% scheduled to expire in any one calendar year between 2008 and 2012.
As noted above, most of the leases with our largest tenant, the United States Government, provide for consecutive one-year terms or provide for early termination rights; all of the leasing statistics set forth above assume that the United States Government will remain in the space that they lease through the end of the respective arrangements, without ending consecutive one-year leases prematurely or exercising early termination rights. We report the statistics in this manner since we manage our leasing activities using these same assumptions and believe these assumptions to be probable. Please refer to the section entitled "Liquidity and Capital Resources" where we further discuss our leases with the United States Government and the underlying risks.
51
The table below sets forth occupancy information pertaining to operating properties in which we have a partial ownership interest:
| |
|
Occupancy Rates at December 31, |
|||||||
|---|---|---|---|---|---|---|---|---|---|
| Geographic Region |
Ownership Interest |
||||||||
| 2007 |
2006 |
2005 |
|||||||
| Suburban Maryland | 50.0 | % | 76.2 | % | 47.9 | % | 47.9 | % | |
| Northern Virginia(1) | 92.5 | % | 100.0 | % | 100.0 | % | 100.0 | % | |
| Greater Harrisburg | 20.0 | % | 90.5 | % | 91.2 | % | 89.4 | % | |
| Northern/Central New Jersey(2) | 20.0 | % | N/A | N/A | 80.9 | % | |||
Revenues from Real Estate Operations and Property Operating Expenses
We typically view our changes in revenues from real estate operations and property operating expenses as being comprised of three main components:
The tables below set forth the components of our changes in revenues from real estate operations and property operating expenses (dollars in thousands). The tables and the discussion that follows in this section include results and information pertaining to properties included in continuing operations:
| |
Changes from 2006 to 2007 |
|||||||||||||||
|---|---|---|---|---|---|---|---|---|---|---|---|---|---|---|---|---|
| |
|
Same-Office Properties |
|
|
||||||||||||
| |
Property Additions Dollar Change(1) |
|
|
|||||||||||||
| |
Dollar Change |
Percentage Change |
Other Dollar Change(2) |
Total |
||||||||||||
| Revenues from real estate operations | ||||||||||||||||
| Rental revenue | $ | 56,257 | $ | 5,092 | 2.1 | % | $ | 326 | $ | 61,675 | ||||||
| Tenant recoveries and other real estate operations revenue | 8,880 | 4,221 | 11.9 | % | 595 | 13,696 | ||||||||||
| Total | $ | 65,137 | $ | 9,313 | 3.4 | % | $ | 921 | $ | 75,371 | ||||||
| Property operating expenses | $ | 21,488 | $ | 6,854 | 7.8 | % | $ | 2,033 | $ | 30,375 | ||||||
| Straight-line rental revenue adjustments included in rental revenue | $ | 3,574 | $ | (1,765 | ) | N/A | $ | 81 | $ | 1,890 | ||||||
| Amortization of deferred market rental revenue | $ | 28 | $ | 372 | N/A | $ | — | $ | 400 | |||||||
| Number of operating properties included in component category | 76 | 153 | N/A | — | 229 | |||||||||||
52
| |
Changes from 2005 to 2006 |
||||||||||||||||||
|---|---|---|---|---|---|---|---|---|---|---|---|---|---|---|---|---|---|---|---|
| |
|
Same-Office Properties |
|
|
|
||||||||||||||
| |
Property Additions Dollar Change(1) |
Sold Properties Dollar Change(2) |
|
|
|||||||||||||||
| |
Dollar Change |
Percentage Change |
Other Dollar Change(3) |
Total |
|||||||||||||||
| Revenues from real estate operations | |||||||||||||||||||
| Rental revenue | $ | 51,645 | $ | 1,086 | 0.6 | % | $ | (5,586 | ) | $ | (1,376 | ) | $ | 45,769 | |||||
| Tenant recoveries and other real estate operations revenue | 8,232 | 2,933 | 11.4 | % | (1,025 | ) | 860 | 11,000 | |||||||||||
| Total | $ | 59,877 | $ | 4,019 | 1.8 | % | $ | (6,611 | ) | $ | (516 | ) | $ | 56,769 | |||||
| Property operating expenses | $ | 20,022 | $ | 5,025 | 7.5 | % | $ | (2,259 | ) | $ | (218 | ) | $ | 22,570 | |||||
| Straight-line rental revenue adjustments included in rental revenue | $ | 5,194 | $ | (1,824 | ) | N/A | $ | (56 | ) | $ | (826 | ) | $ | 2,488 | |||||
| Amortization of deferred market rental revenue | $ | 1,272 | $ | 27 | N/A | $ | — | $ | (27 | ) | $ | 1,272 | |||||||
| Number of operating properties included in component category | 53 | 114 | N/A | 16 | 1 | 184 | |||||||||||||
As the tables above indicate, our total increase in revenues from real estate operations and property operating expenses from 2006 to 2007 and from 2005 to 2006 was attributable primarily to the Property Additions. The increase from 2005 to 2006 in revenues from real estate operations associated with the Property Additions included the effect of certain of our 2005 acquisitions carrying occupancy rates that were lower than the average occupancy rate of our previously existing properties. Acquisitions in 2005 with particularly low occupancy rates upon acquisition included the following: (1) a 1.1 million square foot portfolio acquired in December 2005 that had an occupancy rate averaging approximately 80% in 2005 and 2006; (2) a 118,000 square foot property acquired in October 2005 that was 58% occupied from the date of its acquisition until December 2006; and (3) a 113,000 square foot property acquired in April 2005 that was 23% occupied from its acquisition until December 2005, when it became 100% operational. We occasionally acquire lower occupancy properties such as these for what we view to be the potential for particularly high rates of return on our investment in these properties if we are successful in stabilizing their operations.
With regard to changes in the Same-Office Properties' revenues from real estate operations:
53
such revenue any (1) deferred rents receivable and (2) deferred revenue and deferred assets that are amortizable into rental revenue associated with the leases; the resulting net amount is the net revenue from the early termination of the leases.
With regard to changes in the Same-Office Properties' property operating expenses:
54
The $2.0 million increase in property operating expenses from 2006 to 2007 that was not attributable to Property Additions or Same-Office Properties included a $1.3 million increase associated with the former Fort Ritchie United States Army base in Cascade, Washington County, Maryland, of which we acquired 500 acres on October 5, 2006 and 91 acres on November 29, 2007. While we had development activities underway at the Fort Ritchie project in 2007, the $1.3 million in operating expenses was associated with the portions of the project held for future lease or development.
Construction Contract and Other Service Revenues and Expenses
The table below sets forth changes in our construction contract and other service revenues and expenses (dollars in thousands):
| |
Changes from 2006 to 2007 |
Changes from 2005 to 2006 |
||||||||||||||||||
|---|---|---|---|---|---|---|---|---|---|---|---|---|---|---|---|---|---|---|---|---|
| |
Construction Contract Dollar Change |
Other Service Operations Dollar Change |
Total Dollar Change |
Construction Contract Dollar Change |
Other Service Operations Dollar Change |
Total Dollar Change |
||||||||||||||
| Service operations | ||||||||||||||||||||
| Revenues | $ | (15,108 | ) | $ | (3,751 | ) | $ | (18,859 | ) | $ | (22,175 | ) | $ | 3,025 | $ | (19,150 | ) | |||
| Expenses | (14,238 | ) | (3,314 | ) | (17,552 | ) | (22,573 | ) | 2,631 | (19,942 | ) | |||||||||
| Income from service operations | $ | (870 | ) | $ | (437 | ) | $ | (1,307 | ) | $ | 398 | $ | 394 | $ | 792 | |||||
The gross revenues and costs associated with these services generally bear little relationship to the level of activity from these operations since a substantial portion of the costs are subcontracted costs that are reimbursed to us by the customer at no mark up. As a result, the operating margins from these operations are small relative to the revenue. We use the net of service operations revenues and expenses to evaluate performance. Income from service operations decreased from 2006 to 2007 due primarily to: (1) a slow down in activity on certain third party constructions jobs; and (2) a decrease in third party work for heating and air conditioning controls and plumbing services. While we believe that the change in third party construction job activity represents normal fluctuation of activity, the decrease in third party work for heating and air conditioning controls and plumbing services was attributable to our decision in 2007 to limit the amount of these services that we provide to third parties and, instead, focus on providing these services predominantly for our properties. We do not believe that the changes in net amounts from 2005 to 2006 reflected above were significant.
55
Construction contract revenues were significantly higher in 2005 compared to 2007 and 2006 due primarily to a large volume of activity for certain existing contracts in that year. Construction contract revenues were significantly lower in 2007 compared to 2006 due primarily to decreased construction activity on certain third party jobs. It is noteworthy that our revenue from construction contract activity is highly concentrated, with three contracts representing approximately 82% of our 2007 construction contract revenue and five contracts representing approximately 81% of our 2006 construction contract revenue.
Other service operations revenue increased 62.0% from 2005 to 2006 but decreased 47.5% from 2006 to 2007. While the increase from 2005 to 2006 was due primarily to a higher volume of work for heating and air conditioning controls and plumbing services, much of which was attributable to one client relationship, the decrease from 2006 to 2007 was attributable to our decision in 2007 discussed above to limit the amount of these services that we provide to third parties.
Depreciation and Amortization
Our depreciation and other amortization expense from continuing operations increased from 2006 to 2007 by $28.3 million, or 36.2%, due primarily to a $30.4 million increase attributable to the Property Additions. Of the increase attributable to the Property Additions, $22.8 million was attributable to the Nottingham Acquisition. Compared to other acquisitions that we have completed in recent years, a considerably larger portion of the value of the operating properties included in the Nottingham Acquisition was allocated to assets with lives that are based on the lives of the underlying leases; due to that fact and the fact that a large number of the leases in these properties have lives of four years or less, much of the depreciation and amortization associated with these properties is front-loaded to the four years following the completion of the acquisition. This will result in increased depreciation and amortization expense over the initial four years following the acquisition. The net increase in depreciation and other amortization expense from 2006 to 2007 also included a decrease of $2.9 million attributable to one of the Same-Office Properties that had significant depreciation and amortization expense in 2006 associated with a lease that terminated in 2006.
Our depreciation and other amortization expense from continuing operations increased from 2005 to 2006 by $17.6 million, or 29.2%, due primarily to a $19.7 million increase attributable to the Property Additions, offset in part by a $1.6 million decrease attributable to the absence of depreciation and amortization in 2006 on the Harrisburg portfolio due to its contribution into an unconsolidated real estate joint venture in September 2005.
General and Administrative Expenses
General and administrative expenses increased as a percentage of operating income from 14.3% in 2005 to 15.6% in 2006 and to 17.1% in 2007. Much of this trend can be attributed to an increase in the size of our employee base in response to the continued growth of the Company. We expect this trend to continue over the next year and then stabilize as we determine that the Company's employee base and processes are positioned appropriately in anticipation of our future growth expectations.
Our general and administrative expense increased from 2006 to 2007 by $3.6 million, or 21.2%, which included the following:
56
increased as discussed above, this $1.8 million decrease in general and administrative expenses was caused by the combined effect of: (1) the increase in allocable general and administrative expenses; and (2) a larger percentage of general and administrative expenses being allocated to the service companies due in large part to the increased number of employees in the service companies.
Our general and administrative expense increased from 2005 to 2006 by $3.4 million, or 25.1%, which was attributable primarily to an increase of $2.5 million, or 21.5%, in compensation expense due to: (1) the increased number of employees; (2) increased salaries and bonuses for existing employees; and (3) an increase of $537,000 in expense associated with options issued to employees that was attributable to our adoption of SFAS 123(R) on January 1, 2006.
Interest Expense and Amortization of Deferred Financing Costs
Our interest expense and amortization of deferred financing costs included in continuing operations increased from 2006 to 2007 by $12.6 million, or 17.2%. This increase included the effects of the following:
Our interest expense and amortization of deferred financing costs included in continuing operations increased from 2005 to 2006 by $17.0 million, or 30.2%, from 2005 to 2006. This increase included the effects of the following:
Interest expense and deferred financing costs as a percentage of net operating income increased from 59.4% in 2005 to 67.4% in 2006 and to 71.3% in 2007 due in large part to a higher proportion of our investing and financing activities having been funded by debt versus equity and the reasons discussed above for the changes in interest expense. We historically have financed our long-term capital needs, including property acquisition and development activities, through a combination of the following:
Many factors go into our decisions regarding when to finance investing and financing activities using debt versus equity. We generally use long-term borrowings as attractive financing conditions arise
57
and equity issuances as attractive equity market conditions arise. As a result, the change in the proportion of our investing and financing activities funded by debt versus equity described above is not a trend that necessarily should be expected to continue.
As of December 31, 2007, 19.1% of our total debt had variable interest rates, including the effect of interest rate swaps. As of December 31, 2007, 88.0% of our fixed-rate debt was scheduled to mature after 2008. For a more comprehensive quantitative analysis of our debt, please refer to the section below entitled "Quantitative and Qualitative Disclosures About Market Risk."
Gain on sale of non-real estate investment
Included as income for the year ended December 31, 2007 was a $1.0 million gain recognized on the disposition of most of our investment in TractManager, Inc., an investment that we account for using the cost method of accounting. TractManager, Inc. is an entity that developed an Internet-based contract imaging system for sale to real estate owners and healthcare providers.
Minority Interests
Interests in our Operating Partnership are in the form of preferred and common units. The line entitled "minority interests in income from continuing operations" includes primarily income from continuing operations allocated to preferred and common units not owned by us. Income is allocated to minority interest preferred unitholders in an amount equal to the priority return from the Operating Partnership to which they are entitled. Income is allocated to minority interest common unitholders based on the income earned by the Operating Partnership, after allocation to preferred unitholders, multiplied by the percentage of the common units in the Operating Partnership owned by those common unitholders.
As of December 31, 2007, we owned 84.7% of the outstanding common units and 95.8% of the outstanding preferred units. The percentage of the Operating Partnership owned by minority interests during the last three years decreased in the aggregate due primarily to the effect of the following transactions:
Our income from continuing operations allocated to minority interests decreased by $428,000, or 11.1%, from 2006 to 2007 and by $1.1 million, or 21.9%, from 2005 to 2006. These decreases are due to: (1) a decrease in the income available to allocate to minority interests holders of common units attributable primarily to the reasons set forth above for changes in revenue and expense items combined with the effect of increasing preferred share dividends; and (2) our increasing ownership of common units (from 80.3% at December 31, 2004 to 84.7% at December 31, 2007).
Income from discontinued operations, net of minority interests
Our income from discontinued operations decreased $16.1 million, or 89.7%, from 2006 to 2007 and increased $11.9 million, or 195.1%, from 2005 to 2006 due primarily to changes in gain from sales of real estate included in discontinued operations. See Note 18 to the Consolidated Financial Statements for a summary of the components of income from discontinued operations.
58
Adjustments to Net Income to Arrive at Net Income Available to Common Shareholders
Preferred share dividends increased from 2005 to 2006 and from 2006 to 2007 due to the additional dividends attributable to the Series J Preferred Shares of beneficial interest issued in July 2006 and Series K Preferred Shares issued in January 2007 exceeding the decrease in dividends attributable to the redemption of the Series E and Series F Preferred Shares of beneficial interest ("Series E Preferred Shares" and "Series F Preferred Shares") in 2006.
In 2006, we recognized a $3.9 million decrease to net income available to common shareholders pertaining to the original issuance costs incurred on the Series E and Series F Preferred Shares that were redeemed in 2006.
Diluted earnings per common share
Diluted earnings per common share on net income available to common shareholders decreased 43.5% from 2006 to 2007 and increased 9.5% from 2005 to 2006 due primarily to the effects of the following:
Liquidity and Capital Resources
In our discussion of liquidity and capital resources set forth below, we describe certain of the risks and uncertainties relating to our business. However, they may not be the only ones that we face.
Cash and Cash Equivalents
Our cash and cash equivalents balance as of December 31, 2007 totaled $24.6 million, an increase of 211% from the balance as of December 31, 2006. The balance of cash and cash equivalents that we carried as of the end of each of the eight calendar quarters during the two years ended December 31, 2007 ranged from $5.7 million to $24.6 million and averaged $16.0 million. The cash and cash equivalents balances that we carry as of a point in time can vary significantly due in part to the inherent variability of the cash needs of our acquisition and development activities. We maintain sufficient cash and cash equivalents to meet our operating cash requirements and short term investing and financing cash requirements. When we determine that the amount of cash and cash equivalents on hand is more than we need to meet such requirements, we may pay down our Revolving Credit Facility or forgo borrowing under construction loan credit facilities to fund development activities.
Operating Activities
We generate most of our cash from the operations of our properties. A review of our Consolidated Statements of Operations indicates that over the last three years, approximately 30% to 33% of our revenues from real estate operations (defined as the sum of (1) rental revenue and (2) tenant recoveries and other real estate operations revenue) were used for property operating expenses. Most of the amount by which our revenues from real estate operations exceeded property operating expenses was cash flow; we applied most of this cash flow towards interest expense, scheduled principal amortization on debt, dividends to our shareholders, distributions to minority interest holders of preferred and common units in the Operating Partnership, capital improvements and leasing costs for our operating properties and general and administrative expenses.
Our cash flow from operations determined in accordance with GAAP increased $24.6 million, or 21.7%, from 2006 to 2007; this increase is attributable primarily to the additional cash flow from operations generated by our newly-acquired and newly-constructed properties. We expect to continue to use cash flow provided by operations to meet our short-term capital needs, including all property
59
operating expenses, general and administrative expenses, interest expense, scheduled principal amortization of debt, dividends and distributions and capital improvements and leasing costs. We do not anticipate borrowing to meet these requirements. Factors that could negatively affect our ability to generate cash flow from operations in the future are discussed in Item 1A of this report entitled "Risk Factors," and include, without limitation, the following:
60
Investing and Financing Activities During the Year Ended December 31, 2007
As discussed above, we completed the Nottingham Acquisition on January 9 and 10, 2007. The acquired properties included 56 operating properties totaling approximately 2.4 million square feet and land parcels totaling 187 acres that we believe can support at least 2.0 million developable square feet. We completed the Nottingham Acquisition for an aggregate cost of $366.9 million, which was financed using the following:
61
We issued the Series K Preferred Shares in the Nottingham Acquisition at a value of, and liquidation preference equal to, $50 per share. The Series K Preferred Shares are nonvoting, redeemable for cash at $50 per share at our option on or after January 9, 2017, and are convertible, subject to certain conditions, into common shares on the basis of 0.8163 common shares for each preferred share, in accordance with the terms of the Articles Supplementary describing the Series K Preferred Shares. Holders of the Series K Preferred Shares are entitled to cumulative dividends, payable quarterly (as and if declared by our Board of Trustees). Dividends accrue from the date of issue at the annual rate of $2.80 per share, which is equal to 5.6% of the $50 per share liquidation preference.
We also completed the following acquisitions in 2007:
Activity related to consolidated joint ventures in 2007 included the following:
We had five newly-constructed properties totaling 568,433 square feet (three located in the Baltimore/Washington Corridor and two in our Other region) become fully operational in 2007 (68,196 of these square feet were placed into service in 2006). These properties were 96.3% leased, or considered committed to lease, as of December 31, 2007. Costs incurred on these properties through December 31, 2007 totaled $137.2 million, $60.9 million of which was incurred in 2007. We financed the 2007 costs using primarily borrowings from construction loan facilities on three of the properties; borrowings under these facilities in 2007 totaled $50.8 million.
At December 31, 2007, we had construction activities underway on 10 office properties totaling 845,605 square feet that were 36.2% leased, or considered committed to lease, including 48,377 square feet already placed in service in a partially operational property. One of these properties is owned through a consolidated joint venture in which we have a 50% interest. Four each of these properties are located in Colorado Springs and the Baltimore/Washington Corridor and two in San Antonio. We
62
expect to lease 48.7% of the square footage in these properties to tenants in the United States defense industry. Costs incurred on these properties through December 31, 2007 totaled approximately $99.8 million, of which approximately $61.3 million was incurred in 2007. We have a construction loan facility in place totaling $27.0 million to finance the construction of one of these properties; borrowings under this facility totaled $22.5 million at December 31, 2007, $5.6 million of which was borrowed in 2007. The remaining costs incurred in 2007 were funded using primarily borrowings from our Revolving Credit Facility and cash reserves.
The table below sets forth the major components of our additions to the line entitled "Total Commercial Real Estate Properties" on our Consolidated Balance Sheet for 2007 (in thousands):
| Acquisitions | $ | 354,972 | ||
| Construction and development | 178,136 | |||
| Capital improvements on operating properties | 27,880 | |||
| Tenant improvements on operating properties | 20,602 | (1) | ||
| $ | 581,590 | |||
In 2007, we sold four operating properties totaling 128,153 square feet for a total of $17.8 million, resulting in recognized gain of $3.9 million. We also sold three parcels of land in our Suburban Baltimore region totaling 16 acres, developable into approximately 230,000 square feet, for $8.7 million, resulting in a gain of $3.0 million ($1.9 million gain net of taxes). The net proceeds from these sales after transaction costs totaled approximately $22.3 million (excluding the effect of payments for income taxes). We applied these proceeds to our cash operating reserves.
On May 17, 2007, we borrowed $150.0 million under a mortgage loan with a 10-year term at a fixed rate of 5.65%. We used $120.5 million of the proceeds from this loan to pay down debt scheduled to mature in September 2007 and the balance to pay down borrowings under our Revolving Credit Facility.
On October 1, 2007, we amended and restated the credit agreement on our Revolving Credit Facility with a group of lenders for which KeyBanc Capital Markets and Wachovia Capital Markets, LLC acted as co-lead arrangers, KeyBank National Association acted as administrative agent and Wachovia Bank, National Association acted as syndication agent. The amended and restated credit agreement increased the amount of the lenders' aggregate commitment under the facility from $500.0 million to $600.0 million, which includes a $50.0 million letter of credit subfacility and a $50.0 million swingline facility (same-day draw requests), with a right for us to further increase the lenders' aggregate commitment during the term to a maximum of $800.0 million, subject to certain conditions. Amounts available under the facility are computed based on 65% of our unencumbered asset value, as defined in the agreement. The facility matures on September 30, 2011, and may be extended by one year at our option, subject to certain conditions. The variable interest rate on the facility is based on one of the following, to be selected by us: (1) the LIBOR rate for the interest period designated by us (customarily the 30-day rate) plus 0.75% to 1.25%, as determined by our leverage levels at different points in time; or (2) the greater of (a) the prime rate of the lender then acting as the administrative agent or (b) the Federal Funds Rate, as defined in the agreement, plus 0.50%. Interest is payable at the end of each interest period (as defined in the agreement), and principal outstanding under the facility is payable on the maturity date. The facility also carries a quarterly fee that is based on the unused amount of the facility multiplied by a per annum rate of 0.125% to 0.20%.
63
On October 23, 2007, we entered into an interest rate swap agreement that fixes the one-month LIBOR base rate at 4.33% on an aggregate notional amount of $50.0 million. This swap agreement became effective on October 23, 2007 and carries a two-year term.
Analysis of Cash Flow Associated With Investing and Financing Activities
Our net cash flow used in investing activities increased $73.9 million, or 29.1%, from 2006 to 2007. This increase was due primarily to the following:
Our cash flow provided by financing activities increased $68.9 million, or 50.0%, from 2006 to 2007. This increase was due primarily to the following:
Off-Balance Sheet Arrangements
During 2007, we owned an investment in an unconsolidated joint venture, Harrisburg Corporate Gateway Partners, L.P., for which we accounted using the equity method of accounting. This joint venture was entered into in 2005 to enable us to contribute office properties that were previously wholly owned by us into the joint venture in order to partially dispose of our interest in the properties. We managed the joint venture's property operations and any required construction projects and earned fees for these services in 2007. This joint venture has a two-member management committee that is responsible for making major decisions (as defined in the joint venture agreement), and we control one of the management committee positions.
We and our partner receive returns in proportion to our investments in the joint venture. As part of our obligations under the joint venture arrangement, we agreed to indemnify the partnership's lender for 80% of losses under standard nonrecourse loan guarantees (environmental indemnifications and guarantees against fraud and misrepresentation) during the period of time in which we manage the partnership's properties; we do not expect to incur any losses under these loan guarantees.
64
We have distributions in excess of our investment in this unconsolidated joint venture of $4.2 million at December 31, 2007 due to our not recognizing gain on the contribution of properties into the joint venture; we did not recognize a gain on the contribution since we have contingent obligations, as described above, remaining in effect as long as we continue to manage the joint venture's properties that may exceed our proportionate interest. We recognized a loss on our investment in this joint venture of $224,000 in 2007. We also realized a net cash inflow from this joint venture of $409,000 in 2007. In addition, we earned fees totaling $458,000 from the joint venture in 2007 for construction, asset management and property management services.
During 2007, we also owned investments in five joint ventures that we accounted for using the consolidation method of accounting. We use joint ventures such as these from time to time for reasons that include the following: (1) they can provide a facility to access new markets and investment opportunities while enabling us to benefit from the expertise and relationships of our partners; (2) they are an alternative source for raising capital to put towards acquisition or development activities; and (3) they can reduce our exposure to risks associated with a property and its activities. Our consolidated and unconsolidated joint ventures are discussed in Note 5 to our Consolidated Financial Statements, and certain commitments and contingencies related to these joint ventures are discussed in Note 19.
We had no other material off-balance sheet arrangements during 2007.
Contractual Obligations
The following table summarizes our contractual obligations as of December 31, 2007 (in thousands):
| |
For the Years Ended December 31, |
|
|||||||||||||
|---|---|---|---|---|---|---|---|---|---|---|---|---|---|---|---|
| Contractual obligations(1)(2) |
2008 |
2009 to 2010 |
2011 to 2012 |
Thereafter |
Total |
||||||||||
| Debt(3) | $ | 297,120 | $ | 136,676 | $ | 513,014 | $ | 878,427 | $ | 1,825,237 | |||||
| Interest on debt(4) | 94,724 | 160,791 | 115,903 | 212,397 | 583,815 | ||||||||||
| Acquisitions of properties(5) | 11,045 | — | — | 4,000 | 15,045 | ||||||||||
| New construction and development contracts and obligations(6)(7) | 71,639 | — | — | — | 71,639 | ||||||||||
| Third-party construction and development contracts(7)(8) | 61,941 | — | — | — | 61,941 | ||||||||||
| Capital expenditures for operating properties(7)(9) | 26,461 | — | — | — | 26,461 | ||||||||||
| Operating leases(10) | 768 | 851 | 99 | — | 1,718 | ||||||||||
| Other purchase obligations(11) | 2,350 | 4,626 | 4,547 | 7,473 | 18,996 | ||||||||||
| Total contractual cash obligations | $ | 566,048 | $ | 302,944 | $ | 633,563 | $ | 1,102,297 | $ | 2,604,852 | |||||
65
and long-term financing; the balance of the 2008 maturities represent primarily scheduled principal amortization payments that we expect to pay using cash flow from operations. The 2008 scheduled principal payments by quarter are as follows:
| First Quarter | $4.6 million | |
| Second Quarter | $141.6 million | |
| Third Quarter | $80.0 million | |
| Fourth Quarter | $70.9 million |
Certain of our debt instruments require that we comply with a number of restrictive financial covenants, including leverage ratio, minimum net worth, minimum fixed charge coverage, minimum debt service and maximum secured indebtedness. As of December 31, 2007, we were in compliance with these financial covenants.
Investing and Financing Activities Subsequent to December 31, 2007
On January 29, 2008, we completed the formation of M Square Associates, LLC, a consolidated joint venture in which we hold a 45% equity interest. This joint venture will own, develop and manage office properties, approved for up to approximately 750,000 square feet, located in M Square Research Park in College Park, Maryland. This joint venture had construction underway on a 118,107 square foot property within M Square Research Park.
66
On January 29, 2008, we had a 59,763 square foot property in Colorado Springs that was 100% pre-leased become fully operational.
On January 31, 2008, we completed the sale of the 429 Ridge Road property in our Northern/Central New Jersey region for $17.0 million. We used the proceeds from this sale to pay down our Revolving Credit Facility.
Other Future Cash Requirements for Investing and Financing Activities
As previously discussed, as of December 31, 2007, we had construction activities underway on 10 office properties totaling 845,605 square feet that were 36.2% pre-leased, or considered committed to lease (including one property owned through a consolidated joint venture in which we have a 50% interest). We estimate remaining costs to be incurred will total approximately $62.4 million upon completion of these properties; we expect to incur these costs in 2008 and 2009. We have $4.5 million remaining to be borrowed under a construction loan facility totaling $27.0 million for one of these properties. We expect to fund the remaining portion of these costs using borrowings from new construction loan facilities and our Revolving Credit Facility.
As of December 31, 2007, we had development activities underway on 10 new office properties estimated to total 1.1 million square feet. We estimate that costs for these properties will total approximately $239.1 million. As of December 31, 2007, costs incurred on these properties totaled $33.0 million and the balance is expected to be incurred from 2008 through 2010. We expect to fund most of these costs using borrowings from new construction loan facilities.
As of December 31, 2007, we had redevelopment activities underway on an aggregate of 546,615 square feet in four properties (three of these properties are owned through a consolidated joint venture in which we own a 92.5% interest). We estimate that remaining costs of the redevelopment activities will total approximately $14.4 million. We expect to fund most of these costs using borrowings from our Revolving Credit Facility.
In September 2007, the City of Colorado Springs announced that it had selected us to be the master developer for the 272-acre site known as the Colorado Springs Mixed-Use Business Park, located at the entrance of the Colorado Springs Airport and adjacent to Peterson Air Force Base. We are currently in the process of negotiating the long-term ground lease and development agreement with the City of Colorado Springs regarding the details of this arrangement; we expect that the terms of these agreements will be finalized in 2008. We expect that this business park can support potential development of approximately 3.5 million square feet, including office, retail, industrial and flex space. We anticipate that this project could cost approximately $800.0 million, which we expect to be funded over the next ten to twenty years. As each parcel commences development, we expect to execute long term land leases. For each parcel, we expect to oversee the development, construction, leasing and management and have a leasehold interest in the buildings.
During 2008 and beyond, we expect to complete other acquisitions of properties and commence construction and development activities in addition to the ones previously described. We expect to finance these activities, as we have in the past, using mostly a combination of borrowings from new debt, borrowings under our Revolving Credit Facility, proceeds from sales of existing properties and additional equity issuances of common and/or preferred shares or units.
We often use our Revolving Credit Facility initially to finance much of our investing and financing activities. We then pay down our Revolving Credit Facility using proceeds from long-term borrowings as attractive financing conditions arise and equity issuances as attractive equity market conditions arise. As described above, amounts available under the facility are computed based on 65% of our unencumbered asset value, as defined in the agreement. As of February 13, 2008, the borrowing capacity under the Revolving Credit Facility was $600.0 million, of which $222.0 million was available.
67
Factors that could negatively affect our ability to finance our long-term financing and investing needs in the future are discussed in Item 1A of this report entitled "Risk Factors," and include, without limitation, the following:
68
Funds From Operations
Funds from operations ("FFO") is defined as net income computed using GAAP, excluding gains (or losses) from sales of real estate, plus real estate-related depreciation and amortization, and after adjustments for unconsolidated partnerships and joint ventures. Gains from sales of newly-developed properties less accumulated depreciation, if any, required under GAAP are included in FFO on the basis that development services are the primary revenue generating activity; we believe that inclusion of these development gains is in accordance with the National Association of Real Estate Investment Trusts ("NAREIT") definition of FFO, although others may interpret the definition differently.
Accounting for real estate assets using historical cost accounting under GAAP assumes that the value of real estate assets diminishes predictably over time. NAREIT stated in its April 2002 White Paper on Funds from Operations that "since real estate asset values have historically risen or fallen with market conditions, many industry investors have considered presentations of operating results for real estate companies that use historical cost accounting to be insufficient by themselves." As a result, the concept of FFO was created by NAREIT for the REIT industry to "address this problem." We agree with the concept of FFO and believe that FFO is useful to management and investors as a supplemental measure of operating performance because, by excluding gains and losses related to sales of previously depreciated operating real estate properties and excluding real estate-related depreciation and amortization, FFO can help one compare our operating performance between periods. In addition, since most equity REITs provide FFO information to the investment community, we believe that FFO is useful to investors as a supplemental measure for comparing our results to those of other equity REITs. We believe that net income is the most directly comparable GAAP measure to FFO.
Since FFO excludes certain items includable in net income, reliance on the measure has limitations; management compensates for these limitations by using the measure simply as a supplemental measure that is weighed in the balance with other GAAP and non GAAP measures. FFO is not necessarily an indication of our cash flow available to fund cash needs. Additionally, it should not be used as an alternative to net income when evaluating our financial performance or to cash flow from operating, investing and financing activities when evaluating our liquidity or ability to make cash distributions or pay debt service. The FFO we present may not be comparable to the FFO presented by other REITs since they may interpret the current NAREIT definition of FFO differently or they may not use the current NAREIT definition of FFO.
Basic funds from operations ("Basic FFO") is FFO adjusted to (1) subtract (a) preferred share dividends and (b) issuance costs associated with redeemed preferred shares and (2) add back GAAP net income allocated to common units in the Operating Partnership not owned by us. With these adjustments, Basic FFO represents FFO available to common shareholders and common unitholders. Common units in the Operating Partnership are substantially similar to our common shares and are exchangeable into common shares, subject to certain conditions. We believe that Basic FFO is useful to
69
investors due to the close correlation of common units to common shares. We believe that net income is the most directly comparable GAAP measure to Basic FFO. Basic FFO has essentially the same limitations as FFO; management compensates for these limitations in essentially the same manner as described above for FFO.
Diluted funds from operations ("Diluted FFO") is Basic FFO adjusted to add back any changes in Basic FFO that would result from the assumed conversion of securities that are convertible or exchangeable into common shares. However, the computation of Diluted FFO does not assume conversion of securities other than common units in the Operating Partnership that are convertible into common shares if the conversion of those securities would increase Diluted FFO per share in a given period. We believe that Diluted FFO is useful to investors because it is the numerator used to compute Diluted FFO per share, discussed below. In addition, since most equity REITs provide Diluted FFO information to the investment community, we believe Diluted FFO is a useful supplemental measure for comparing us to other equity REITs. We believe that the numerator for diluted EPS is the most directly comparable GAAP measure to Diluted FFO. Since Diluted FFO excludes certain items includable in the numerator to diluted EPS, reliance on the measure has limitations; management compensates for these limitations by using the measure simply as a supplemental measure that is weighed in the balance with other GAAP and non-GAAP measures. Diluted FFO is not necessarily an indication of our cash flow available to fund cash needs. Additionally, it should not be used as an alternative to net income when evaluating our financial performance or to cash flow from operating, investing and financing activities when evaluating our liquidity or ability to make cash distributions or pay debt service. The Diluted FFO that we present may not be comparable to the Diluted FFO presented by other REITs.
Diluted funds from operations per share ("Diluted FFO per share") is (1) Diluted FFO divided by (2) the sum of the (a) weighted average common shares outstanding during a period, (b) weighted average common units outstanding during a period and (c) weighted average number of potential additional common shares that would have been outstanding during a period if other securities that are convertible or exchangeable into common shares were converted or exchanged. However, the computation of Diluted FFO per share does not assume conversion of securities other than common units in the Operating Partnership that are convertible into common shares if the conversion of those securities would increase Diluted FFO per share in a given period. We believe that Diluted FFO per share is useful to investors because it provides investors with a further context for evaluating our FFO results in the same manner that investors use earnings per share ("EPS") in evaluating net income available to common shareholders. In addition, since most equity REITs provide Diluted FFO per share information to the investment community, we believe Diluted FFO per share is a useful supplemental measure for comparing us to other equity REITs. We believe that diluted EPS is the most directly comparable GAAP measure to Diluted FFO per share. Diluted FFO per share has most of the same limitations as Diluted FFO (described above); management compensates for these limitations in essentially the same manner as described above for Diluted FFO.
Our Basic FFO, Diluted FFO and Diluted FFO per share for 2003 through 2007 and reconciliations of (1) net income to FFO, (2) the numerator for diluted EPS to diluted FFO and
70
(3) the denominator for diluted EPS to the denominator for diluted FFO per share are set forth in the following table (dollars and shares in thousands, except per share data):
| |
For the Years Ended December 31, (in thousands, except per share data) |
|||||||||||||||
|---|---|---|---|---|---|---|---|---|---|---|---|---|---|---|---|---|
| |
2007 |
2006 |
2005 |
2004 |
2003 |
|||||||||||
| Net income | $ | 34,784 | $ | 49,227 | $ | 39,031 | $ | 37,032 | $ | 30,877 | ||||||
| Add: Real estate-related depreciation and amortization | 106,260 | 78,631 | 62,850 | 51,371 | 36,681 | |||||||||||
| Add: Depreciation and amortization on unconsolidated real estate entities | 666 | 910 | 182 | 106 | 295 | |||||||||||
| Less: Depreciation and amortization allocable to minority interests in other consolidated entities | (188 | ) | (163 | ) | (114 | ) | (86 | ) | — | |||||||
| Less: Gain on sales of real estate, net of taxes, excluding development portion(1) | (3,827 | ) | (17,644 | ) | (4,422 | ) | (95 | ) | (2,897 | ) | ||||||
| Funds from operations ("FFO") | 137,695 | 110,961 | 97,527 | 88,328 | 64,956 | |||||||||||
| Add: Minority interests-common units in the Operating Partnership | 3,682 | 7,276 | 5,889 | 5,659 | 6,712 | |||||||||||
| Less: Preferred share dividends | (16,068 | ) | (15,404 | ) | (14,615 | ) | (16,329 | ) | (12,003 | ) | ||||||
| Less: Issuance costs associated with redeemed preferred shares | — | (3,896 | ) | — | (1,813 | ) | — | |||||||||
| Funds from Operations—basic ("Basic FFO") | 125,309 | 98,937 | 88,801 | 75,845 | 59,665 | |||||||||||
| Add: Preferred unit distributions | — | — | — | — | 1,049 | |||||||||||
| Add: Expense on dilutive share-based compensation | — | — | — | 382 | 10 | |||||||||||
| Add: Convertible preferred share dividends | — | — | — | 21 | 544 | |||||||||||
| Funds from Operations—diluted ("Diluted FFO") | $ | 125,309 | $ | 98,937 | $ | 88,801 | $ | 76,248 | $ | 61,268 | ||||||
| Weighted average common shares | 46,527 | 41,463 | 37,371 | 33,173 | 26,659 | |||||||||||
| Conversion of weighted average common units | 8,296 | 8,511 | 8,702 | 8,726 | 8,932 | |||||||||||
| Weighted average common shares/units—Basic FFO | 54,823 | 49,974 | 46,073 | 41,899 | 35,591 | |||||||||||
| Dilutive effect of share-based compensation awards | 1,103 | 1,799 | 1,626 | 1,896 | 1,405 | |||||||||||
| Assumed conversion of weighted average convertible preferred units | — | — | — | — | 1,101 | |||||||||||
| Assumed conversion of weighted average convertible preferred shares | — | — | — | 134 | 1,197 | |||||||||||
| Weighted average common shares/units—Diluted FFO | 55,926 | 51,773 | 47,699 | 43,929 | 39,294 | |||||||||||
| Diluted FFO per common share | $ | 2.24 | $ | 1.91 | $ | 1.86 | $ | 1.74 | $ | 1.56 | ||||||
| Numerator for diluted EPS | $ | 18,716 | $ | 29,927 | $ | 24,416 | $ | 18,911 | $ | 7,650 | ||||||
| Add: Minority interests-common units in the Operating Partnership | 3,682 | 7,276 | 5,889 | 5,659 | 6,712 | |||||||||||
| Add: Real estate-related depreciation and amortization | 106,260 | 78,631 | 62,850 | 51,371 | 36,681 | |||||||||||
| Add: Depreciation and amortization on unconsolidated real estate entities | 666 | 910 | 182 | 106 | 295 | |||||||||||
| Less: Depreciation and amortization allocable to minority interests in other consolidated entities | (188 | ) | (163 | ) | (114 | ) | (86 | ) | — | |||||||
| Less: Gain on sales of real estate, net of taxes, excluding development portion(1) | (3,827 | ) | (17,644 | ) | (4,422 | ) | (95 | ) | (2,897 | ) | ||||||
| Add: Convertible preferred share dividends | — | — | — | — | 544 | |||||||||||
| Add: Preferred unit distributions | — | — | — | — | 1,049 | |||||||||||
| Add: Expense on dilutive share-based compensation | — | — | — | 382 | 10 | |||||||||||
| Add: Repurchase of Series C Preferred Units in excess of recorded book value | — | — | — | — | 11,224 | |||||||||||
| Diluted FFO | $ | 125,309 | $ | 98,937 | $ | 88,801 | $ | 76,248 | $ | 61,268 | ||||||
| Denominator for diluted EPS | 47,630 | 43,262 | 38,997 | 34,982 | 28,021 | |||||||||||
| Weighted average common units | 8,296 | 8,511 | 8,702 | 8,726 | 8,932 | |||||||||||
| Assumed conversion of weighted average convertible preferred shares | — | — | — | — | 1,197 | |||||||||||
| Assumed conversion of weighted average convertible preferred units | — | — | — | — | 1,101 | |||||||||||
| Dilutive effect of share-based compensation awards | — | — | — | 221 | 43 | |||||||||||
| Denominator for Diluted FFO per share | 55,926 | 51,773 | 47,699 | 43,929 | 39,294 | |||||||||||
71
Inflation
Most of our tenants are obligated to pay their share of a building's operating expenses to the extent such expenses exceed amounts established in their leases, based on historical expense levels. Some of our tenants are obligated to pay their full share of a building's operating expenses. These arrangements somewhat reduce our exposure to increases in such costs resulting from inflation. In addition, since our average lease life is approximately five years, we generally expect to be able to compensate for increased operating expenses through increased rental rates upon lease renewal or expiration.
Our costs associated with constructing buildings and completing renovation and tenant improvement work increased due to higher cost of materials. We expect to recover a portion of these costs through higher tenant rents and reimbursements for tenant improvements. The additional costs that we do not recover increase depreciation expense as projects are completed and placed into service.
Recent Accounting Pronouncements
For disclosure regarding recent accounting pronouncements and the anticipated impact they will have on our operations, you should refer to Note 2 to our Consolidated Financial Statements.
Item 7A. Quantitative and Qualitative Disclosures about Market Risk
We are exposed to certain market risks, the most predominant of which is change in interest rates. Increases in interest rates can result in increased interest expense under our Revolving Credit Facility and our other debt carrying variable interest rate terms. Increases in interest rates can also result in increased interest expense when our debt carrying fixed interest rate terms mature and need to be refinanced. Our financing policy monitors the relationship of our total variable rate debt to our total debt to minimize the risk of short-term increases in interest rates. As of December 31, 2007, 88.0% of our fixed-rate debt was scheduled to mature after 2008. As of December 31, 2007, 19.1% of our total debt had variable interest rates, including the effect of interest rate swaps. As of December 31, 2007, the percentage of variable-rate debt, including the effect of interest rate swaps, relative to total assets was 11.9%.
The following table sets forth our long-term debt obligations by scheduled maturity and weighted average interest rates at December 31, 2007 (dollars in thousands):
| |
For the Years Ended December 31, |
|
||||||||||||||||||||
|---|---|---|---|---|---|---|---|---|---|---|---|---|---|---|---|---|---|---|---|---|---|---|
| |
2008 |
2009 |
2010 |
2011 |
2012 |
Thereafter |
Total |
|||||||||||||||
| Long term debt: | ||||||||||||||||||||||
| Fixed rate(1) | $ | 158,531 | $ | 62,643 | $ | 74,033 | $ | 109,814 | $ | 42,200 | $ | 878,427 | $ | 1,325,648 | ||||||||
| Average interest rate | 5.49 | % | 5.32 | % | 5.26 | % | 5.23 | % | 5.20 | % | 4.21 | % | 4.72 | % | ||||||||
| Variable rate | $ | 138,589 | $ | — | $ | — | $ | 361,000 | $ | — | $ | — | $ | 499,589 | ||||||||
| Average interest rate(2) | 6.00 | % | 5.89 | % | 5.89 | % | 5.89 | % | — | — | 5.92 | % | ||||||||||
The fair market value of our debt was $1.83 billion at December 31, 2007 and $1.50 billion at December 31, 2006. If interest rates on our fixed-rate debt had been 1% lower, the fair value of this debt would have increased by $53.7 million at December 31, 2007 and $48.4 million at December 31, 2006.
72
We occasionally use derivative instruments such as interest rate swaps to further reduce our exposure to changes in interest rates. The following table sets forth information pertaining to our derivative contracts in place as of December 31, 2007 and 2006, and their respective fair values (dollars in thousands):
| |
|
|
|
|
Fair Value at December 31, |
|||||||||||
|---|---|---|---|---|---|---|---|---|---|---|---|---|---|---|---|---|
| |
Notional Amount |
One-Month LIBOR base |
Effective Date |
Expiration Date |
||||||||||||
| Nature of Derivative |
2007 |
2006 |
||||||||||||||
| Interest rate swap | $ | 50,000 | 5.0360 | % | 3/28/2006 | 3/30/2009 | $ | (765 | ) | $ | (42 | ) | ||||
| Interest rate swap | 25,000 | 5.2320 | % | 5/1/2006 | 5/1/2009 | (486 | ) | (133 | ) | |||||||
| Interest rate swap | 25,000 | 5.2320 | % | 5/1/2006 | 5/1/2009 | (486 | ) | (133 | ) | |||||||
| Interest rate swap | 50,000 | 4.3300 | % | 10/23/2007 | 10/23/2009 | (596 | ) | N/A | ||||||||
| $ | (2,333 | ) | $ | (308 | ) | |||||||||||
Based on our variable-rate debt balances, our interest expense would have increased by $3.0 million in 2007 and $3.2 million in 2006 if short-term interest rates were 1% higher. Interest expense in 2007 was less sensitive to a change in interest rates than 2006 due primarily to our having a lower average variable-rate debt balance in 2007.
Item 8. Financial Statements and Supplementary Data
The response to this item is included in a separate section at the end of this report beginning on page F-1.
Item 9. Changes in and Disagreements with Accountants on Accounting and Financial Disclosure
None.
Item 9A. Controls and Procedures
Our management, with the participation of our Chief Executive Officer and Chief Financial Officer, evaluated the effectiveness of our disclosure controls and procedures (as defined in Rule 13a-15(e) under the Exchange Act) as of December 31, 2007. Based on this evaluation, our Chief Executive Officer and Chief Financial Officer concluded that our disclosure controls and procedures as of December 31, 2007 are functioning effectively to provide reasonable assurance that the information required to be disclosed by us in reports filed or submitted under the Securities Exchange Act of 1934 is (i) recorded, processed, summarized and reported within the time periods specified in the SEC's rules and forms, and (ii) accumulated and communicated to our management, including our principal executive and principal financial officers, or persons performing similar functions, as appropriate to allow timely decisions regarding required disclosure.
A controls system, no matter how well designed and operated, cannot provide absolute assurance that the objectives of the controls system are met, and no evaluation of controls can provide absolute assurance that all control issues and instances of fraud, if any, within a company have been detected.
Management's Annual Report on Internal Control Over Financial Reporting is included in a separate section at the end of this report on page F-2.
The Report of Independent Registered Public Accounting Firm is included in a separate section at the end of this report on page F-3.
No change in our internal control over financial reporting occurred during the most recent fiscal quarter that has materially affected, or is reasonably likely to materially affect, our internal control over financial reporting.
73
None.
Items 10, 11, 12, 13 & 14. Directors, Executive Officers and Corporate Governance; Executive Compensation; Security Ownership of Certain Beneficial Owners and Management and Related Stockholder Matters; Certain Relationships and Related Transactions, and Director Independence; and Principal Accountant Fees and Services
For the information required by Item 10, Item 11, Item 12, Item 13 and Item 14, you should refer to our definitive proxy statement relating to the 2008 Annual Meeting of our Shareholders to be filed with the Securities and Exchange Commission no later than 120 days after the end of the fiscal year covered by this Form 10-K.
Item 15. Exhibits and Financial Statement Schedules
(b) Exhibits. Refer to the Exhibit Index that follows. Unless otherwise noted, the file number of all documents incorporated by reference is 1-14023.
| EXHIBIT NO. |
DESCRIPTION |
|
||
|---|---|---|---|---|
| 3.1.1 | Amended and Restated Declaration of Trust of Registrant (filed with the Registrant's Registration Statement on Form S-4 (Commission File No. 333-45649) and incorporated herein by reference). | |||
3.1.2 |
Articles of Amendment of Amended and Restated Declaration of Trust (filed on March 22, 2002 with the Company's Annual Report on Form 10-K for the year ended December 31, 2001 and incorporated herein by reference). |
|||
3.1.3 |
Articles of Amendment of Amended and Restated Declaration of Trust (filed with the Company's Current Report on Form 8-K on December 29, 2004 and incorporated herein by reference). |
|||
3.1.4 |
Articles Supplementary of Corporate Office Properties Trust Series B Convertible Preferred Shares, dated July 2, 1999 (filed with the Company's Current Report on Form 8-K on July 7, 1999 and incorporated herein by reference). |
|||
3.1.5 |
Articles Supplementary of Corporate Office Properties Trust (filed with the Company's Current Report on Form 8-K on December 29, 2004 and incorporated herein by reference). |
|||
3.1.6 |
Articles Supplementary of Corporate Office Properties Trust (filed with the Company's Current Report on Form 8-K on December 29, 2004 and incorporated herein by reference). |
74
3.1.7 |
Articles Supplementary of Corporate Office Properties Trust relating to the Series E Cumulative Redeemable Preferred Shares, dated April 3, 2001 (filed with the Registrant's Current Report on Form 8-K on April 4, 2001 and incorporated herein by reference). |
|||
3.1.8 |
Articles Supplementary of Corporate Office Properties Trust relating to the Series F Cumulative Redeemable Preferred Shares, dated September 13, 2001 (filed with the Registrant's Amended Current Report on Form 8-K on September 14, 2001 and incorporated herein by reference). |
|||
3.1.9 |
Articles Supplementary of Corporate Office Properties Trust relating to the Series G Cumulative Redeemable Preferred Shares, dated August 6, 2003 (filed with the Registrant's Registration Statement on Form 8-A on August 7, 2003 and incorporated herein by reference). |
|||
3.1.10 |
Articles Supplementary of Corporate Office Properties Trust relating to the Series H Cumulative Redeemable Preferred Shares, dated December 11, 2003 (filed with the Current Report on Form 8-K on December 12, 2003 and incorporated herein by reference). |
|||
3.1.11 |
Articles Supplementary of Corporate Office Properties Trust relating to the Series J Cumulative Redeemable Preferred Shares of Beneficial Interest (filed with the Company's Current Report on Form 8-K dated July 19, 2006 and incorporated herein by reference). |
|||
3.1.12 |
Articles Supplementary of Corporate Office Properties Trust relating to the Series K Cumulative Redeemable Convertible Preferred Shares of Beneficial Interest (filed with the Company's Current Report on Form 8-K dated January 16, 2007 and incorporated herein by reference). |
|||
3.2.1 |
Bylaws of the Registrant (filed with the Registrant's Registration Statement on Form S-4 (Commission File No. 333-45649) and incorporated herein by reference). |
|||
3.2.2 |
Amendment to Bylaws of the Registrant (filed with the Company's Current Report on Form 8-K on March 7, 2007 and incorporated herein by reference). |
|||
3.3 |
Form of certificate for the Registrant's Common Shares of Beneficial Interest, $0.01 par value per share (filed with the Registrant's Registration Statement on Form S-4 (Commission File No. 333-45649) and incorporated herein by reference). |
|||
3.4 |
Amended and Restated Registration Rights Agreement, dated March 16, 1998, for the benefit of certain shareholders of the Company (filed on August 12, 1998 with the Company's Quarterly Report on Form 10-Q for the quarter ended June 30, 1998 and incorporated herein by reference). |
|||
3.5 |
Registration Rights Agreement, dated January 25, 2001, for the benefit of Barony Trust Limited (filed on March 22, 2001 with the Company's Annual Report on Form 10-K for the year ended December 31, 2000 and incorporated herein by reference). |
75
3.6 |
Registration Rights Agreement, dated September 18, 2006, among Corporate Office Properties, L.P., Corporate Office Properties Trust, Banc of America Securities LLC and J.P. Morgan Securities Inc. (filed with the Company's Current Report on Form 8-K dated September 22, 2006 and incorporated herein by reference). |
|||
4.1 |
Indenture, dated as of September 18, 2006, among Corporate Office Properties, L.P., as issuer, Corporate Office Properties Trust, as guarantor, and Wells Fargo Bank, National Association, as trustee (filed with the Company's Current Report on Form 8-K dated September 22, 2006 and incorporated herein by reference). |
|||
4.2 |
3.50% Exchangeable Senior Note due 2026 of Corporate Office Properties, L.P. (filed with the Company's Current Report on Form 8-K dated September 22, 2006 and incorporated herein by reference). |
|||
10.1.1 |
Second Amended and Restated Limited Partnership Agreement of the Operating Partnership, dated December 7, 1999 (filed on March 16, 2000 with the Company's Annual Report on Form 10-K for the year ended December 31, 1999 and incorporated herein by reference). |
|||
10.1.2 |
First Amendment to Second Amended and Restated Limited Partnership Agreement of the Operating Partnership, dated December 21, 1999 (filed on March 16, 2000 with the Company's Annual Report on Form 10-K for the year ended December 31, 1999 and incorporated herein by reference). |
|||
10.1.3 |
Second Amendment to Second Amended and Restated Limited Partnership Agreement of the Operating Partnership, dated December 21, 1999 (filed with the Company's Post Effective Amendment No. 2 to Form S-3 dated November 1, 2000 (Registration Statement No. 333-71807) and incorporated herein by reference). |
|||
10.1.4 |
Third Amendment to Second Amended and Restated Limited Partnership Agreement of the Operating Partnership, dated September 29, 2000 (filed with the Company's Post Effective Amendment No. 2 to Form S-3 dated November 1, 2000 (Registration Statement No. 333-71807) and incorporated herein by reference). |
|||
10.1.5 |
Fourth Amendment to Second Amended and Restated Limited Partnership Agreement of the Operating Partnership, dated November 27, 2000 (filed on March 27, 2003 with the Company's Annual Report on Form 10-K for the year ended December 31, 2002 and incorporated herein by reference). |
|||
10.1.6 |
Fifth Amendment to Second Amended and Restated Limited Partnership Agreement of the Operating Partnership, dated January 25, 2001 (filed on March 27, 2003 with the Company's Annual Report on Form 10-K for the year ended December 31, 2002 and incorporated herein by reference). |
|||
10.1.7 |
Sixth Amendment to Second Amended and Restated Limited Partnership Agreement of the Operating Partnership, dated April 3, 2001 (filed with the Company's Current Report on Form 8-K dated April 4, 2001 and incorporated herein by reference). |
76
10.1.8 |
Seventh Amendment to Second Amended and Restated Limited Partnership Agreement of the Operating Partnership, dated August 30, 2001 (filed on March 27, 2003 with the Company's Annual Report on Form 10-K for the year ended December 31, 2002 and incorporated herein by reference). |
|||
10.1.9 |
Eighth Amendment to Second Amended and Restated Limited Partnership Agreement of the Operating Partnership, dated September 14, 2001 (filed with the Company's Amended Current Report on Form 8-K dated September 14, 2001 and incorporated herein by reference). |
|||
10.1.10 |
Ninth Amendment to Second Amended and Restated Limited Partnership Agreement of the Operating Partnership, dated October 6, 2001 (filed on March 27, 2003 with the Company's Annual Report on Form 10-K for the year ended December 31, 2002 and incorporated herein by reference). |
|||
10.1.11 |
Tenth Amendment to Second Amended and Restated Limited Partnership Agreement of the Operating Partnership, dated December 29, 2001 (filed on March 27, 2003 with the Company's Annual Report on Form 10-K for the year ended December 31, 2002 and incorporated herein by reference). |
|||
10.1.12 |
Eleventh Amendment to Second Amended and Restated Limited Partnership Agreement of the Operating Partnership, dated December 15, 2002 (filed on March 27, 2003 with the Company's Annual Report on Form 10-K for the year ended December 31, 2002 and incorporated herein by reference). |
|||
10.1.13 |
Twelfth Amendment to Second Amended and Restated Limited Partnership Agreement of Corporate Office Properties, L.P., dated June 2, 2003 (filed on August 12, 2003 with the Registrant's Quarterly Report on Form 10-Q for the quarter ended June 30, 2003 and incorporated herein by reference). |
|||
10.1.14 |
Thirteenth Amendment to Second Amended and Restated Limited Partnership Agreement of Corporate Office Properties, L.P., dated August 11, 2003 (filed on March 27, 2003 with the Company's Annual Report on Form 10-K for the year ended December 31, 2002 and incorporated herein by reference). |
|||
10.1.15 |
Fourteenth Amendment to Second Amended and Restated Limited Partnership Agreement of Corporate Office Properties, L.P., dated December 18, 2003 (filed on March 11, 2004 with the Company's Annual Report on Form 10-K for the year ended December 31, 2003 and incorporated herein by reference). |
|||
10.1.16 |
Fifteenth Amendment to Second Amended and Restated Limited Partnership Agreement of Corporate Office Properties, L.P., dated January 31, 2004 (filed on March 11, 2004 with the Company's Annual Report on Form 10-K for the year ended December 31, 2003 and incorporated herein by reference). |
|||
10.1.17 |
Sixteenth Amendment to Second Amended and Restated Limited Partnership Agreement of Corporate Office Properties, L.P., dated April 15, 2004 (filed on May 7, 2004 with the Company's Form 10-Q for the quarter ended March 31, 2004 and incorporated herein by reference). |
|||
10.1.18 |
Seventeenth Amendment to Second Amended and Restated Limited Partnership Agreement of Corporate Office Properties, L.P., dated September 23, 2004 (filed with the Company's Current Report on Form 8-K dated September 23, 2004 and incorporated herein by reference). |
77
10.1.19 |
Eighteenth Amendment to Second Amended and Restated Limited Partnership Agreement of Corporate Office Properties, L.P., dated April 18, 2005 (filed with the Company's Form 8-K on April 22, 2005 and incorporated herein by reference). |
|||
10.1.20 |
Nineteenth Amendment to Second Amended and Restated Limited Partnership Agreement of Corporate Office Properties, L.P., dated July 8, 2005 (filed with the Company's Current Report on Form 8-K on July 14, 2005 and incorporated herein by reference). |
|||
10.1.21 |
Twentieth Amendment to Second Amended and Restated Limited Partnership Agreement of Corporate Office Properties, L.P., dated June 29, 2006 (filed with the Company's Current Report on Form 8-K dated July 6, 2006 and incorporated herein by reference). |
|||
10.1.22 |
Twenty-First Amendment to Second Amended and Restated Limited Partnership Agreement of Corporate Office Properties, L.P., dated July 20, 2006 (filed with the Company's Current Report on Form 8-K dated July 26, 2006 and incorporated herein by reference). |
|||
10.1.23 |
Twenty-Second Amendment to Second Amended and Restated Limited Partnership Agreement of Corporate Office Properties, L.P., dated January 9, 2007 (filed with the Company's Current Report on Form 8-K dated January 16, 2007 and incorporated herein by reference). |
|||
10.1.24 |
Twenty-Third Amendment to Second Amended and Restated Limited Partnership Agreement of Corporate Office Properties, L.P., dated April 6, 2007 (filed with the Company's Current Report on Form 8-K dated April 12, 2007 and incorporated herein by reference). |
|||
10.1.25 |
Twenty-Fourth Amendment to Second Amended and Restated Limited Partnership Agreement of Corporate Office Properties, L.P., dated November 2, 2007 (filed with the Company's Current Report on Form 8-K dated November 5, 2007 and incorporated herein by reference). |
|||
10.2 |
Stock Option Plan for Directors (filed with Royale Investments, Inc.'s Form 10-KSB for the year ended December 31, 1993 (Commission File No. 0-20047) and incorporated herein by reference). |
|||
10.3.1* |
Corporate Office Properties Trust 1998 Long Term Incentive Plan (filed with the Registrant's Registration Statement on Form S-4 (Commission File No. 333-45649) and incorporated herein by reference). |
|||
10.3.2* |
Amendment No. 1 to Corporate Office Properties Trust 1998 Long Term Incentive Plan (filed on August 13, 1999 with the Company's Quarterly Report on Form 10-Q for the quarter ended June 30, 1999 and incorporated herein by reference). |
|||
10.3.3* |
Amendment No. 2 to Corporate Office Properties Trust 1998 Long Term Incentive Plan (filed on March 22, 2002 with the Company's Annual Report on Form 10-K for the year ended December 31, 2001 and incorporated herein by reference). |
78
10.4* |
Corporate Office Properties Trust Supplemental Nonqualified Deferred Compensation Plan (filed with the Registrant's Registration Statement on Form S-8 (Commission File No. 333-87384) and incorporated herein by reference). |
|||
10.5* |
Employment Agreement, dated December 16, 1999, between Corporate Office Management, Inc., COPT and Clay W. Hamlin, III (filed on March 16, 2000 with the Company's Annual Report on Form 10-K for the year ended December 31, 1999 and incorporated herein by reference). |
|||
10.6.1* |
Employment Agreement, dated July 13, 2005, between Corporate Office Properties, L.P. Corporate Office Properties Trust and Randall M. Griffin (filed with the Company's Current Report on Form 8-K on July 19, 2005 and incorporated herein by reference). |
|||
10.6.2* |
Amendment to Employment Agreement, dated May 30, 2006, between Corporate Office Properties, L.P., Corporate Office Properties Trust, and Randall M. Griffin (filed with the Company's Current Report on Form 8-K dated June 1, 2006 and incorporated herein by reference). |
|||
10.7.1* |
Employment Agreement, dated September 12, 2002, between the Operating Partnership, COPT and Roger A. Waesche, Jr. (filed on March 27, 2003 with the Company's Annual Report on Form 10-K for the year ended December 31, 2002 and incorporated herein by reference). |
|||
10.7.2* |
Amendment to Employment Agreement, dated March 4, 2005, between the Operating Partnership, COPT and Roger A. Waesche, Jr. (filed on March 16, 2005 with the Company's Annual Report on Form 10-K for the year ended December 31, 2004 and incorporated herein by reference). |
|||
10.7.3* |
Second Amendment to Employment Agreement, dated May 30, 2006, between Corporate Office Properties, L.P., Corporate Office Properties Trust, and Roger A. Waesche, Jr. (filed with the Company's Current Report on Form 8-K dated June 1, 2006 and incorporated herein by reference). |
|||
10.7.4* |
Third Amendment to Employment Agreement, dated July 31, 2006, between Corporate Office Properties, L.P., Corporate Office Properties Trust, and Roger A. Waesche, Jr. (filed with the Company's Current Report on Form 8-K dated August 1, 2006 and incorporated herein by reference). |
|||
10.7.5* |
Fourth Amendment to Employment Agreement, dated March 2, 2007, between Corporate Office Properties, L.P., Corporate Office Properties Trust, and Roger A. Waesche, Jr. (filed herewith). |
|||
10.8.1* |
Employment Agreement, dated May 15, 2003, between Corporate Development Services, LLC, Corporate Office Properties Trust and Dwight Taylor (filed on August 12, 2003 with the Registrant's Quarterly Report on Form 10-Q for the quarter ended June 30, 2003 and incorporated herein by reference). |
|||
10.8.2* |
Amendment to Employment Agreement, dated March 4, 2005, between Corporate Development Services, LLC, Corporate Office Properties Trust and Dwight Taylor (filed on March 16, 2005 with the Company's Annual Report on Form 10-K for the year ended December 31, 2004 and incorporated herein by reference). |
79
10.8.3* |
Second Amendment to Employment Agreement, dated March 2, 2007, between Corporate Development Services, LLC, Corporate Office Properties Trust and Dwight S. Taylor (filed herewith). |
|||
10.9* |
Employment Agreement, dated November 18, 2005, between Corporate Office Properties, L.P. Corporate Office Properties Trust and Karen M. Singer (filed with the Company's Current Report on Form 8-K on December 1, 2005 and incorporated herein by reference). |
|||
10.10* |
Employment Agreement, dated July 31, 2006, between Corporate Office Properties, L.P., Corporate Office Properties Trust and Stephen E. Riffee (filed with the Company's Current Report on Form 8-K dated August 1, 2006 and incorporated herein by reference). |
|||
10.11 |
Promissory Note, dated October 22, 1998, between Teachers Insurance and Annuity Association of America and the Operating Partnership (filed on November 13, 1998 with the Company's Quarterly Report on Form 10-Q for the quarter ended September 30, 1998 and incorporated herein by reference). |
|||
10.12 |
Indemnity Deed of Trust, Assignment of Leases and Rents and Security Agreement, dated October 22, 1998, by affiliates of the Operating Partnership for the benefit of Teachers Insurance and Annuity Association of America (filed on November 13, 1998 with the Company's Quarterly Report on Form 10-Q for the quarter ended September 30, 1998 and incorporated herein by reference). |
|||
10.13 |
Promissory Note, dated September 30, 1999, between Teachers Insurance and Annuity Association of America and the Operating Partnership (filed on November 8, 1999 with the Company's Quarterly Report on Form 10-Q for the quarter ended September 30, 1999 and incorporated herein by reference). |
|||
10.14 |
Indemnity Deed of Trust, Assignment of Leases and Rents and Security Agreement, dated September 30, 1999, by affiliates of the Operating Partnership for the benefit of Teachers Insurance and Annuity Association of America (filed on November 8, 1999 with the Company's Quarterly Report on Form 10-Q for the quarter ended September 30, 1999 and incorporated herein by reference). |
|||
10.15 |
Lease Agreement between Blue Bell Investment Company, L.P. and Unisys Corporation dated March 12, 1997 with respect to lot A (filed with the Registrant's Registration Statement on Form S-4 (Commission File No. 333-45649) and incorporated herein by reference). |
|||
10.16 |
Lease Agreement between Blue Bell Investment Company, L.P. and Unisys Corporation, dated March 12, 1997, with respect to lot B (filed with the Registrant's Registration Statement on Form S-4 (Commission File No. 333-45649) and incorporated herein by reference). |
|||
10.17 |
Lease Agreement between Blue Bell Investment Company, L.P. and Unisys Corporation, dated March 12, 1997, with respect to lot C (filed with the Registrant's Registration Statement on Form S-4 (Commission File No. 333-45649) and incorporated herein by reference). |
|||
10.18 |
Option Agreement, dated March 1998, between the Operating Partnership and Blue Bell Land, L.P. (filed on March 16, 2000 with the Company's Annual Report on Form 10-K for the year ended December 31, 1999 and incorporated herein by reference). |
80
10.19.1 |
Amended and Restated Credit Agreement, dated June 24, 2005, among Corporate Office Properties, L.P.; Corporate Office Properties Trust; Wachovia Capital Markets, LLC; KeyBank National Association; Wachovia Bank, National Association; KeyBanc Capital Markets; Manufacturers and Traders Trust Company; Wells Fargo Bank, National Association; and Bank of America, N.A. (filed with the Company's Current Report on Form 8-K on June 30, 2005 and incorporated herein by reference). |
|||
10.19.2 |
Second Amended and Restated Credit Agreement, dated October 1, 2007, among Corporate Office Properties, L.P.; Corporate Office Properties Trust; KeyBanc Capital Markets; Wachovia Capital Markets, LLC; KeyBank National Association; Wachovia Bank, National Association; Bank of America, N.A.; Manufacturers and Traders Trust Company; and Citizens Bank of Pennsylvania (filed herewith). |
|||
10.20 |
Retirement and Consulting Agreement, dated April 12, 2005, between Corporate Office Properties, L.P. and Clay W. Hamlin, III (filed with the Company's Form 8-K on April 15, 2005 and incorporated herein by reference). |
|||
10.21 |
Corporate Office Properties Trust Supplemental Nonqualified Deferred Compensation Plan (filed with the Company's Registration Statement on Form S-8 (Commission File No. 333-87384) and incorporated herein by reference). |
|||
10.22 |
Common Stock Delivery Agreement, dated as of September 18, 2006, between Corporate Office Properties, L.P. and Corporate Office Properties Trust (filed with the Company's Current Report on Form 8-K dated September 22, 2006 and incorporated herein by reference). |
|||
10.23 |
Purchase Agreement and Agreement and Plan of Merger, dated December 21, 2006, by and among the Corporate Office Properties Trust; Corporate Office Properties, L.P.; W&M Business Trust; and Nottingham Village, Inc. (filed on March 1, 2007 with the Company's Annual Report on Form 10-K for the year ended December 31, 2006 and incorporated herein by reference). |
|||
10.24 |
Purchase and Sale Agreement of Ownership Interests, dated December 21, 2006, by and between Corporate Office Properties, L.P. and Nottingham Properties, Inc. (filed on March 1, 2007 with the Company's Annual Report on Form 10-K for the year ended December 31, 2006 and incorporated herein by reference). |
|||
10.25 |
Description of Compensation of Non-Employee Trustees (filed herewith). |
|||
10.26 |
Description of annual cash incentive awards to executives (filed herewith). |
|||
12.1 |
Statement regarding Computation of Earnings to Combined Fixed Charges and Preferred Share Dividends (filed herewith). |
|||
21.1 |
Subsidiaries of Registrant (filed herewith). |
|||
23.1 |
Consent of Independent Registered Public Accounting Firm (filed herewith). |
|||
31.1 |
Certification of the Chief Executive Officer of Corporate Office Properties Trust required by Rule 13a-14(a) under the Securities Exchange Act of 1934, as amended (filed herewith). |
81
31.2 |
Certification of the Chief Financial Officer of Corporate Office Properties Trust required by Rule 13a-14(a) under the Securities Exchange Act of 1934, as amended (filed herewith). |
|||
32.1 |
Certification of the Chief Executive Officer of Corporate Office Properties Trust required by Rule 13a-14(b) under the Securities Exchange Act of 1934, as amended. (This exhibit shall not be deemed "filed" for purposes of Section 18 of the Securities Exchange Act of 1934, as amended, or otherwise subject to the liability of that section. Further, this exhibit shall not be deemed to be incorporated by reference into any filing under the Securities Exchange Act of 1933, as amended, or the Securities Exchange Act of 1934, as amended.) (Furnished herewith.) |
|||
32.2 |
Certification of the Chief Financial Officer of Corporate Office Properties Trust required by Rule 13a-14(b) under the Securities Exchange Act of 1934, as amended. (This exhibit shall not be deemed "filed" for purposes of Section 18 of the Securities Exchange Act of 1934, as amended, or otherwise subject to the liability of that section. Further, this exhibit shall not be deemed to be incorporated by reference into any filing under the Securities Exchange Act of 1933, as amended, or the Securities Exchange Act of 1934, as amended.) (Furnished herewith.) |
(c) Not applicable.
82
Pursuant to the requirements of Section 13 or 15(d) of the Securities Exchange Act of 1934, the Registrant has duly caused this report to be signed on its behalf by the undersigned, thereunto duly authorized.
| CORPORATE OFFICE PROPERTIES TRUST | |||
Date: February 29, 2008 |
By: |
/s/ RANDALL M. GRIFFIN Randall M. Griffin President and Chief Executive Officer |
|
Date: February 29, 2008 |
By: |
/s/ STEPHEN E. RIFFEE Stephen E. Riffee Executive Vice President and Chief Financial Officer |
|
Pursuant to the requirements of the Securities Exchange Act of 1934, this report has been signed below by the following persons on behalf of the Registrant and in the capacities and on the dates indicated:
| Signatures |
Title |
Date |
||
|---|---|---|---|---|
| /s/ JAY H. SHIDLER (Jay H. Shidler) |
Chairman of the Board and Trustee | February 29, 2008 | ||
/s/ CLAY W. HAMLIN, III (Clay W. Hamlin, III) |
Vice Chairman of the Board and Trustee |
February 29, 2008 |
||
/s/ RANDALL M. GRIFFIN (Randall M. Griffin) |
President, Chief Executive Officer and Trustee |
February 29, 2008 |
||
/s/ STEPHEN E. RIFFEE (Stephen E. Riffee) |
Executive Vice President and Chief Financial Officer (Principal Financial Officer) |
February 29, 2008 |
||
/s/ COLLEEN M. CREWS (Colleen M. Crews) |
Vice President and Controller (Principal Accounting Officer) |
February 29, 2008 |
83
/s/ THOMAS F. BRADY (Thomas F. Brady) |
Trustee |
February 29, 2008 |
||
/s/ ROBERT L. DENTON (Robert L. Denton) |
Trustee |
February 29, 2008 |
||
/s/ DOUGLAS M. FIRSTENBERG (Douglas M. Firstenberg) |
Trustee |
February 29, 2008 |
||
/s/ STEVEN D. KESLER (Steven D. Kesler) |
Trustee |
February 29, 2008 |
||
/s/ KENNETH S. SWEET, JR. (Kenneth S. Sweet, Jr.) |
Trustee |
February 29, 2008 |
||
/s/ KENNETH D. WETHE (Kenneth D. Wethe) |
Trustee |
February 29, 2008 |
84
CORPORATE OFFICE PROPERTIES TRUST AND SUBSIDIARIES
INDEX TO FINANCIAL STATEMENTS
| CONSOLIDATED FINANCIAL STATEMENTS | |||
Management's Report of Internal Control Over Financial Reporting |
F-2 |
||
| Report of Independent Registered Public Accounting Firm | F-3 | ||
| Consolidated Balance Sheets as of December 31, 2007 and 2006 | F-4 | ||
| Consolidated Statements of Operations for the Years Ended December 31, 2007, 2006 and 2005 | F-5 | ||
| Consolidated Statements of Shareholders' Equity for the Years Ended December 31, 2007, 2006 and 2005 | F-6 | ||
| Consolidated Statements of Cash Flows for the Years Ended December 31, 2007, 2006 and 2005 | F-7 | ||
| Notes to Consolidated Financial Statements | F-8 | ||
FINANCIAL STATEMENT SCHEDULE |
|||
Schedule III—Real Estate and Accumulated Depreciation as of December 31, 2007 |
F-57 |
||
F-1
Management's Report On Internal Control Over Financial Reporting
Management is responsible for establishing and maintaining adequate internal control over financial reporting, and for performing an assessment of the effectiveness of internal control over financial reporting as of December 31, 2007. Internal control over financial reporting is a process designed to provide reasonable assurance regarding the reliability of financial reporting and the preparation of financial statements for external purposes in accordance with generally accepted accounting principles. Our internal control over financial reporting includes those policies and procedures that (i) pertain to the maintenance of records that, in reasonable detail, accurately and fairly reflect the transactions and dispositions of our assets; (ii) provide reasonable assurance that transactions are recorded as necessary to permit preparation of financial statements in accordance with generally accepted accounting principles, and that our receipts and expenditures are being made only in accordance with authorizations of our management and trustees; and (iii) provide reasonable assurance regarding prevention or timely detection of unauthorized acquisition, use or disposition of our assets that could have a material effect on the financial statements. Because of its inherent limitations, internal control over financial reporting may not prevent or detect misstatements. Also, projections of any evaluation of effectiveness to future periods are subject to the risk that controls may become inadequate because of changes in conditions, or that the degree of compliance with the policies or procedures may deteriorate.
Management performed an assessment of the effectiveness of our internal control over financial reporting as of December 31, 2007 based upon criteria in Internal Control—Integrated Framework issued by the Committee of Sponsoring Organizations of the Treadway Commission ("COSO"). Based on our assessment, management determined that our internal control over financial reporting was effective as of December 31, 2007 based on the criteria in Internal Control-Integrated Framework issued by the COSO.
The effectiveness of the Company's internal control over financial reporting as of December 31, 2007 has been audited by PricewaterhouseCoopers LLP, an independent registered public accounting firm, as stated in their report which appears herein.
F-2
Report of Independent Registered Public Accounting Firm
To the Board of Trustees and Shareholders of Corporate Office Properties Trust:
In our opinion, the consolidated financial statements listed in the accompanying index 15(a)(1) present fairly, in all material respects, the financial position of Corporate Office Properties Trust and its subsidiaries at December 31, 2007 and December 31, 2006, and the results of their operations and their cash flows for each of the three years in the period ended December 31, 2007, in conformity with accounting principles generally accepted in the United States of America. In addition, in our opinion, the financial statement schedule listed in the accompanying index 15(a)(2) presents fairly, in all material respects, the information set forth therein when read in conjunction with the related consolidated financial statements. Also in our opinion, the Company maintained, in all material respects, effective internal control over financial reporting as of December 31, 2007, based on criteria established in Internal Control—Integrated Framework issued by the Committee of Sponsoring Organizations of the Treadway Commission (COSO). The Company's management is responsible for these financial statements and financial statement schedule, for maintaining effective internal control over financial reporting and for its assessment of the effectiveness of internal control over financial reporting, included in the accompanying "Management Report's On Internal Control Over Financial Reporting." Our responsibility is to express opinions on these financial statements, on the financial statement schedule, and on the Company's internal control over financial reporting based on our integrated audits. We conducted our audits in accordance with the standards of the Public Company Accounting Oversight Board (United States). Those standards require that we plan and perform the audits to obtain reasonable assurance about whether the financial statements are free of material misstatement and whether effective internal control over financial reporting was maintained in all material respects. Our audits of the financial statements included examining, on a test basis, evidence supporting the amounts and disclosures in the financial statements, assessing the accounting principles used and significant estimates made by management, and evaluating the overall financial statement presentation. Our audit of internal control over financial reporting included obtaining an understanding of internal control over financial reporting, assessing the risk that a material weakness exists, and testing and evaluating the design and operating effectiveness of internal control based on the assessed risk. Our audits also included performing such other procedures as we considered necessary in the circumstances. We believe that our audits provide a reasonable basis for our opinions.
A company's internal control over financial reporting is a process designed to provide reasonable assurance regarding the reliability of financial reporting and the preparation of financial statements for external purposes in accordance with generally accepted accounting principles. A company's internal control over financial reporting includes those policies and procedures that (i) pertain to the maintenance of records that, in reasonable detail, accurately and fairly reflect the transactions and dispositions of the assets of the company; (ii) provide reasonable assurance that transactions are recorded as necessary to permit preparation of financial statements in accordance with generally accepted accounting principles, and that receipts and expenditures of the company are being made only in accordance with authorizations of management and directors of the company; and (iii) provide reasonable assurance regarding prevention or timely detection of unauthorized acquisition, use, or disposition of the company's assets that could have a material effect on the financial statements.
Because of its inherent limitations, internal control over financial reporting may not prevent or detect misstatements. Also, projections of any evaluation of effectiveness to future periods are subject to the risk that controls may become inadequate because of changes in conditions, or that the degree of compliance with the policies or procedures may deteriorate.
/s/ PricewaterhouseCoopers LLP
Baltimore,
Maryland
February 29, 2008
F-3
Corporate Office Properties Trust and Subsidiaries
Consolidated Balance Sheets
(Dollars in thousands)
| |
December 31, |
||||||||
|---|---|---|---|---|---|---|---|---|---|
| |
2007 |
2006 |
|||||||
| Assets | |||||||||
| Investment in real estate: | |||||||||
| Operating properties, net | $ | 2,192,472 | $ | 1,812,883 | |||||
| Property held for sale, net | 14,988 | — | |||||||
| Projects under construction or development | 396,012 | 298,427 | |||||||
| Total commercial real estate properties, net | 2,603,472 | 2,111,310 | |||||||
| Cash and cash equivalents | 24,638 | 7,923 | |||||||
| Restricted cash | 15,121 | 52,856 | |||||||
| Accounts receivable, net | 24,831 | 26,367 | |||||||
| Deferred rent receivable | 53,631 | 41,643 | |||||||
| Intangible assets on real estate acquisitions, net | 108,661 | 87,325 | |||||||
| Deferred charges, net | 49,051 | 43,710 | |||||||
| Prepaid and other assets | 52,448 | 48,467 | |||||||
| Total assets | $ | 2,931,853 | $ | 2,419,601 | |||||
| Liabilities and shareholders' equity | |||||||||
| Liabilities: | |||||||||
| Mortgage and other loans payable | $ | 1,625,842 | $ | 1,298,537 | |||||
| 3.5% Exchangeable Senior Notes | 200,000 | 200,000 | |||||||
| Accounts payable and accrued expenses | 75,363 | 68,190 | |||||||
| Rents received in advance and security deposits | 30,978 | 20,237 | |||||||
| Dividends and distributions payable | 22,441 | 19,164 | |||||||
| Deferred revenue associated with acquired operating leases | 11,530 | 11,120 | |||||||
| Distributions in excess of investment in unconsolidated real | |||||||||
| estate joint venture | 4,246 | 3,614 | |||||||
| Other liabilities | 8,716 | 8,249 | |||||||
| Total liabilities | 1,979,116 | 1,629,111 | |||||||
| Minority interests: | |||||||||
| Common units in the Operating Partnership | 114,127 | 104,934 | |||||||
| Preferred units in the Operating Partnership | 8,800 | 8,800 | |||||||
| Other consolidated real estate joint ventures | 7,168 | 2,453 | |||||||
| Total minority interests | 130,095 | 116,187 | |||||||
| Commitments and contingencies (Note 19) | |||||||||
| Shareholders' equity: | |||||||||
| Preferred Shares of beneficial interest ($0.01 par value); shares authorized of 15,000,000, issued and outstanding of 8,121,667 at December 31, 2007 and 7,590,000 at December 31, 2006 (Note 11) | 81 | 76 | |||||||
| Common Shares of beneficial interest ($0.01 par value); 75,000,000 shares authorized, shares issued and outstanding of 47,366,475 at December 31, 2007 and 42,897,639 at December 31, 2006 |
474 | 429 | |||||||
| Additional paid-in capital | 950,615 | 758,032 | |||||||
| Cumulative distributions in excess of net income | (126,156 | ) | (83,541 | ) | |||||
| Accumulated other comprehensive loss | (2,372 | ) | (693 | ) | |||||
| Total shareholders' equity | 822,642 | 674,303 | |||||||
| Total liabilities and shareholders' equity | $ | 2,931,853 | $ | 2,419,601 | |||||
See accompanying notes to consolidated financial statements.
F-4
Corporate Office Properties Trust and Subsidiaries
Consolidated Statements of Operations
(Dollars in thousands, except per share data)
| |
For the Years Ended December 31, |
|||||||||||
|---|---|---|---|---|---|---|---|---|---|---|---|---|
| |
2007 |
2006 |
2005 |
|||||||||
| Revenues | ||||||||||||
| Rental revenue | $ | 315,588 | $ | 253,913 | $ | 208,144 | ||||||
| Tenant recoveries and other real estate operations revenue | 53,361 | 39,665 | 28,665 | |||||||||
| Construction contract revenues | 37,074 | 52,182 | 74,357 | |||||||||
| Other service operations revenues | 4,151 | 7,902 | 4,877 | |||||||||
| Total revenues | 410,174 | 353,662 | 316,043 | |||||||||
| Expenses | ||||||||||||
| Property operating expenses | 123,282 | 92,907 | 70,337 | |||||||||
| Depreciation and other amortization associated with real estate operations | 106,331 | 78,054 | 60,427 | |||||||||
| Construction contract expenses | 35,723 | 49,961 | 72,534 | |||||||||
| Other service operations expenses | 4,070 | 7,384 | 4,753 | |||||||||
| General and administrative expenses | 20,523 | 16,936 | 13,533 | |||||||||
| Total operating expenses | 289,929 | 245,242 | 221,584 | |||||||||
| Operating income | 120,245 | 108,420 | 94,459 | |||||||||
| Interest expense | (82,032 | ) | (70,260 | ) | (53,906 | ) | ||||||
| Amortization of deferred financing costs | (3,676 | ) | (2,847 | ) | (2,229 | ) | ||||||
| Gain on sale of non-real estate investment | 1,033 | — | — | |||||||||
| Income from continuing operations before equity in loss of unconsolidated entities, income taxes and minority interests | 35,570 | 35,313 | 38,324 | |||||||||
| Equity in loss of unconsolidated entities | (224 | ) | (92 | ) | (88 | ) | ||||||
| Income tax expense | (569 | ) | (887 | ) | (668 | ) | ||||||
| Income from continuing operations before minority interests | 34,777 | 34,334 | 37,568 | |||||||||
| Minority interests in income from continuing operations | ||||||||||||
| Common units in the Operating Partnership | (2,860 | ) | (3,302 | ) | (4,326 | ) | ||||||
| Preferred units in the Operating Partnership | (660 | ) | (660 | ) | (660 | ) | ||||||
| Other consolidated entities | 122 | 136 | 85 | |||||||||
| Income from continuing operations | 31,379 | 30,508 | 32,667 | |||||||||
| Income from discontinued operations, net of minority interests and taxes | 1,845 | 17,987 | 6,096 | |||||||||
| Income before gain on sales of real estate | 33,224 | 48,495 | 38,763 | |||||||||
| Gain on sales of real estate, net of minority interests and taxes | 1,560 | 732 | 268 | |||||||||
| Net income | 34,784 | 49,227 | 39,031 | |||||||||
| Preferred share dividends | (16,068 | ) | (15,404 | ) | (14,615 | ) | ||||||
| Issuance costs associated with redeemed preferred shares | — | (3,896 | ) | — | ||||||||
| Net income available to common shareholders | $ | 18,716 | $ | 29,927 | $ | 24,416 | ||||||
| Basic earnings per common share | ||||||||||||
| Income from continuing operations | $ | 0.36 | $ | 0.29 | $ | 0.49 | ||||||
| Discontinued operations | 0.04 | 0.43 | 0.16 | |||||||||
| Net income available to common shareholders | $ | 0.40 | $ | 0.72 | $ | 0.65 | ||||||
| Diluted earnings per common share | ||||||||||||
| Income from continuing operations | $ | 0.35 | $ | 0.28 | $ | 0.47 | ||||||
| Discontinued operations | 0.04 | 0.41 | 0.16 | |||||||||
| Net income available to common shareholders | $ | 0.39 | $ | 0.69 | $ | 0.63 | ||||||
| Dividends declared per common share | $ | 1.30 | $ | 1.18 | $ | 1.07 | ||||||
See accompanying notes to consolidated financial statements.
F-5
Corporate Office Properties Trust and Subsidiaries
Consolidated Statements of Shareholders' Equity
(Dollars in thousands)
| |
Preferred Shares |
Common Shares |
Additional Paid-in Capital |
Cumulative Distributions in Excess of Net Income |
Value of Unearned Restricted Common Share Grants |
Accumulated Other Comprehensive Loss |
Total |
|||||||||||||||
|---|---|---|---|---|---|---|---|---|---|---|---|---|---|---|---|---|---|---|---|---|---|---|
| Balance at December 31, 2004 (36,842,108 common shares outstanding) | $ | 67 | $ | 368 | $ | 578,228 | $ | (51,358 | ) | $ | (5,381 | ) | $ | — | $ | 521,924 | ||||||
| Conversion of common units to common shares (253,575 shares) | — | 3 | 9,117 | — | — | — | 9,120 | |||||||||||||||
| Common shares issued to the public (2,300,000 shares) | — | 23 | 75,118 | — | — | — | 75,141 | |||||||||||||||
| Decrease in fair value of derivatives | — | — | — | — | — | (482 | ) | (482 | ) | |||||||||||||
| Restricted common share grants issued (130,975 shares) | — | 1 | 3,480 | — | (3,481 | ) | — | — | ||||||||||||||
| Restricted common share cancellations (10,422 shares) | — | — | (205 | ) | — | 205 | — | — | ||||||||||||||
| Value of earned restricted share grants | — | — | 536 | — | 1,544 | — | 2,080 | |||||||||||||||
| Exercise of share options (411,080 shares) | — | 4 | 4,394 | — | — | — | 4,398 | |||||||||||||||
| Expense associated with share options | — | — | 93 | — | — | — | 93 | |||||||||||||||
| Adjustments to minority interests resulting from changes in ownership of Operating Partnership by COPT | — | — | (12,888 | ) | — | — | — | (12,888 | ) | |||||||||||||
| Decrease in tax benefit from share-based compensation | — | — | (534 | ) | — | — | — | (534 | ) | |||||||||||||
| Net income | — | — | — | 39,031 | — | — | 39,031 | |||||||||||||||
| Dividends | — | — | — | (55,370 | ) | — | — | (55,370 | ) | |||||||||||||
| Balance at December 31, 2005 (39,927,316 common shares outstanding) | 67 | 399 | 657,339 | (67,697 | ) | (7,113 | ) | (482 | ) | 582,513 | ||||||||||||
| Conversion of common units to common shares (245,793 shares) | — | 3 | 11,075 | — | — | — | 11,078 | |||||||||||||||
| Common shares issued to the public (2,000,000 shares) | — | 20 | 82,413 | — | — | — | 82,433 | |||||||||||||||
| Series J Preferred Shares issued to the public (3,390,000 shares) | 34 | — | 81,823 | — | — | — | 81,857 | |||||||||||||||
| Series E Preferred Shares redemption | (11 | ) | — | (28,739 | ) | — | — | — | (28,750 | ) | ||||||||||||
| Series F Preferred Shares redemption | (14 | ) | — | (35,611 | ) | — | — | — | (35,625 | ) | ||||||||||||
| Decrease in fair value of derivatives | — | — | — | — | — | (211 | ) | (211 | ) | |||||||||||||
| Reversal of unearned restricted common share grants upon adoption of SFAS 123(R) | — | 1 | (5,169 | ) | — | 7,113 | — | 1,945 | ||||||||||||||
| Exercise of share options (581,932 shares) | — | 6 | 6,761 | — | — | — | 6,767 | |||||||||||||||
| Expense associated with share-based compensation | — | — | 3,833 | — | — | — | 3,833 | |||||||||||||||
| Adjustments to minority interests resulting from changes in ownership of Operating Partnership by COPT | — | — | (16,255 | ) | — | — | — | (16,255 | ) | |||||||||||||
| Increase in tax benefit from share-based compensation | — | — | 562 | — | — | — | 562 | |||||||||||||||
| Net income | — | — | — | 49,227 | — | — | 49,227 | |||||||||||||||
| Dividends | — | — | — | (65,071 | ) | — | — | (65,071 | ) | |||||||||||||
| Balance at December 31, 2006 (42,897,639 common shares outstanding) | 76 | 429 | 758,032 | (83,541 | ) | — | (693 | ) | 674,303 | |||||||||||||
| Conversion of common units to common shares (554,221 shares) | — | 6 | 25,402 | — | — | — | 25,408 | |||||||||||||||
| Common shares issued in connection with acquisition of properties, net of transaction costs (3,161,000 shares) | — | 32 | 156,629 | — | — | — | 156,661 | |||||||||||||||
| Series K Preferred Shares issued in connection with acquisition of properties, net of transaction costs (531,667 shares) | 5 | — | 26,562 | — | — | — | 26,567 | |||||||||||||||
| Exercise of share options (620,858 shares) | — | 6 | 7,470 | — | — | — | 7,476 | |||||||||||||||
| Expense associated with share-based compensation | — | 1 | 6,642 | — | — | — | 6,643 | |||||||||||||||
| Restricted common share cancellations (6,685 shares) | — | — | (351 | ) | — | — | — | (351 | ) | |||||||||||||
| Adjustments to minority interests resulting from changes in ownership of Operating Partnership by COPT | — | — | (29,761 | ) | — | — | — | (29,761 | ) | |||||||||||||
| Decrease in fair value of derivatives | — | — | — | — | — | (1,679 | ) | (1,679 | ) | |||||||||||||
| Costs for equity issuance | — | — | (10 | ) | — | — | — | (10 | ) | |||||||||||||
| Net income | — | — | — | 34,784 | — | — | 34,784 | |||||||||||||||
| Dividends | — | — | — | (77,399 | ) | — | — | (77,399 | ) | |||||||||||||
| Balance at December 31, 2007 (47,366,475 common shares outstanding) | $ | 81 | $ | 474 | $ | 950,615 | $ | (126,156 | ) | $ | — | $ | (2,372 | ) | $ | 822,642 | ||||||
See accompanying notes to consolidated financial statements.
F-6
Corporate Office Properties Trust and Subsidiaries
Consolidated Statements of Cash Flows
(Dollars in thousands)
| |
For the Years Ended December 31, |
||||||||||||
|---|---|---|---|---|---|---|---|---|---|---|---|---|---|
| |
2007 |
2006 |
2005 |
||||||||||
| Cash flows from operating activities | |||||||||||||
| Net income | $ | 34,784 | $ | 49,227 | $ | 39,031 | |||||||
| Adjustments to reconcile net income to net cash provided by operating activities: | |||||||||||||
| Minority interests | 4,220 | 7,800 | 6,464 | ||||||||||
| Depreciation and other amortization | 107,625 | 80,074 | 63,555 | ||||||||||
| Amortization of deferred financing costs | 3,676 | 2,981 | 2,240 | ||||||||||
| Amortization of deferred market rental revenue | (1,985 | ) | (1,904 | ) | (426 | ) | |||||||
| Equity in loss of unconsolidated entities | 224 | 92 | 88 | ||||||||||
| Gain on sales of real estate | (6,979 | ) | (17,920 | ) | (4,690 | ) | |||||||
| Gain on sale of non-real estate investment | (1,033 | ) | — | — | |||||||||
| Share-based compensation | 6,643 | 3,833 | 2,173 | ||||||||||
| Excess income tax benefits from share-based compensation | — | (562 | ) | — | |||||||||
| Changes in operating assets and liabilities: | |||||||||||||
| Increase in deferred rent receivable | (11,988 | ) | (10,004 | ) | (6,922 | ) | |||||||
| Decrease (increase) in accounts receivable | 1,544 | (10,844 | ) | 1,165 | |||||||||
| Increase in restricted cash and prepaid and other assets | (5,040 | ) | (7,098 | ) | (14,260 | ) | |||||||
| (Decrease) increase in accounts payable, accrued expenses, and other liabilities | (3,250 | ) | 13,544 | 5,953 | |||||||||
| Increase in rents received in advance and security deposits | 10,030 | 4,181 | 1,993 | ||||||||||
| Other | (770 | ) | (249 | ) | (420 | ) | |||||||
| Net cash provided by operating activities | 137,701 | 113,151 | 95,944 | ||||||||||
| Cash flows from investing activities | |||||||||||||
| Purchases of and additions to commercial real estate properties | (352,427 | ) | (282,099 | ) | (499,926 | ) | |||||||
| Proceeds from sales of properties | 21,684 | 46,704 | 29,467 | ||||||||||
| Proceeds from sale of non-real estate investment | 2,526 | — | — | ||||||||||
| Proceeds from sale of unconsolidated real estate joint venture | — | 1,524 | — | ||||||||||
| Proceeds from contribution of assets to unconsolidated | |||||||||||||
| real estate joint venture | — | — | 68,633 | ||||||||||
| Acquisition of partner interests in consolidated joint ventures | (1,262 | ) | (5,250 | ) | (1,208 | ) | |||||||
| Investments in and advances from (to) unconsolidated entities | — | 454 | (130 | ) | |||||||||
| Distributions from unconsolidated entities | 414 | 499 | 250 | ||||||||||
| Leasing costs paid | (12,182 | ) | (10,480 | ) | (9,272 | ) | |||||||
| Decrease (increase) in restricted cash associated with | |||||||||||||
| investing activities | 16,018 | 5,260 | (5,620 | ) | |||||||||
| Purchases of furniture, fixtures and equipment | (1,663 | ) | (8,109 | ) | (2,434 | ) | |||||||
| Other | (822 | ) | (2,337 | ) | (61 | ) | |||||||
| Net cash used in investing activities | (327,714 | ) | (253,834 | ) | (420,301 | ) | |||||||
| Cash flows from financing activities | |||||||||||||
| Proceeds from mortgage and other loans payable | 867,842 | 673,176 | 889,399 | ||||||||||
| Proceeds from 3.5% Exchangeable Senior Notes | — | 200,000 | — | ||||||||||
| Repayments of mortgage and other loans payable | (579,395 | ) | (762,590 | ) | (580,642 | ) | |||||||
| Deferred financing costs paid | (4,171 | ) | (6,605 | ) | (4,307 | ) | |||||||
| Distributions paid to partners in consolidated joint ventures | (250 | ) | (787 | ) | — | ||||||||
| Net proceeds from issuance of common shares | 7,446 | 89,202 | 79,539 | ||||||||||
| Net proceeds from issuance of preferred shares | — | 81,857 | — | ||||||||||
| Redemption of preferred shares | — | (64,375 | ) | — | |||||||||
| Dividends paid | (74,277 | ) | (62,845 | ) | (53,587 | ) | |||||||
| Distributions paid | (11,188 | ) | (10,422 | ) | (9,677 | ) | |||||||
| Excess income tax benefits from share-based compensation | — | 562 | — | ||||||||||
| Other | 721 | 649 | 595 | ||||||||||
| Net cash provided by financing activities | 206,728 | 137,822 | 321,320 | ||||||||||
| Net increase (decrease) in cash and cash equivalents | 16,715 | (2,861 | ) | (3,037 | ) | ||||||||
| Cash and cash equivalents | |||||||||||||
| Beginning of period | 7,923 | 10,784 | 13,821 | ||||||||||
| End of period | $ | 24,638 | $ | 7,923 | $ | 10,784 | |||||||
See accompanying notes to consolidated financial statements.
F-7
Corporate Office Properties Trust and Subsidiaries
Notes to Consolidated Financial Statements
(Dollars in thousands, except per share data)
1. Organization
Corporate Office Properties Trust ("COPT") and subsidiaries (collectively, the "Company") is a fully-integrated and self-managed real estate investment trust ("REIT") that focuses on the acquisition, development, ownership, management and leasing of suburban office properties in select markets and submarkets. We also focus on servicing the multi-location requirements of strategic customers and strategic industries in which tenants have specialized product requirements. As of December 31, 2007, our investments in real estate included the following:
We conduct almost all of our operations through our operating partnership, Corporate Office Properties, L.P. (the "Operating Partnership"), for which we are the managing general partner. The Operating Partnership owns real estate both directly and through subsidiary partnerships and limited liability companies ("LLCs"). A summary of our Operating Partnership's forms of ownership and the percentage of those ownership forms owned by COPT as of December 31, 2007 and 2006 follows:
| |
December 31, |
||||
|---|---|---|---|---|---|
| |
2007 |
2006 |
|||
| Common Units | 85 | % | 83 | % | |
| Series G Preferred Units | 100 | % | 100 | % | |
| Series H Preferred Units | 100 | % | 100 | % | |
| Series I Preferred Units | 0 | % | 0 | % | |
| Series J Preferred Units | 100 | % | 100 | % | |
| Series K Preferred Units(1) | 100 | % | N/A | ||
Three of our trustees controlled, either directly or through ownership by other entities or family members, an additional 13% of the Operating Partnership's common units.
F-8
Corporate Office Properties Trust and Subsidiaries
Notes to Consolidated Financial Statements (Continued)
(Dollars in thousands, except per share data)
1. Organization (Continued)
In addition to owning interests in real estate, the Operating Partnership also owns 100% of Corporate Office Management, Inc. ("COMI") and owns, either directly or through COMI, 100% of the consolidated subsidiaries that are set forth below (collectively defined as the "Service Companies"):
| Entity Name |
Type of Service Business |
|
|---|---|---|
| COPT Property Management Services, LLC ("CPM") | Real Estate Management | |
| COPT Development & Construction Services, LLC ("CDC") | Construction and Development | |
| Corporate Development Services, LLC ("CDS") | Construction and Development | |
| COPT Environmental Systems, LLC ("CES")(1) | Heating and Air Conditioning |
Most of the services that CPM provides are for us. CDC, CDS and CES provide services to us and to third parties.
2. Summary of Significant Accounting Policies
Basis of Presentation
We generally use three different accounting methods to report our investments in entities: the consolidation method, the equity method and the cost method. These methods are described below.
Consolidation Method
We generally use the consolidation method when we own most of the outstanding voting interests in an entity and can control its operations. In accordance with Financial Accounting Standards Board ("FASB") Interpretation No. 46(R), "Consolidation of Variable Interest Entities" ("FIN 46(R)"), we also consolidate certain entities when control of such entities can be achieved through means other than voting rights ("variable interest entities" or "VIEs") if we are deemed to be the primary beneficiary. Generally, FIN 46(R) applies when either (1) the equity investors (if any) lack one or more of the essential characteristics of a controlling financial interest; (2) the equity investment at risk is insufficient to finance that entity's activities without additional subordinated financial support; or (3) the equity investors have voting rights that are not proportionate to their economic interests and the activities of the entity involve or are conducted on behalf of an investor with a disproportionately small voting interest.
Under the consolidation method of accounting, the accounts of the entity being consolidated are combined with our accounts. We eliminate balances and transactions between companies when we consolidate these accounts. For all of the periods presented, our Consolidated Financial Statements include the accounts of:
F-9
Corporate Office Properties Trust and Subsidiaries
Notes to Consolidated Financial Statements (Continued)
(Dollars in thousands, except per share data)
2. Summary of Significant Accounting Policies (Continued)
Equity Method
We generally use the equity method of accounting when we own an interest in an entity and can exert significant influence over the entity's operations but cannot control the entity's operations. FIN 46(R) affects our determination of when to use the equity method of accounting since we would generally use the equity method for VIEs of which we are not the primary beneficiary. Under the equity method, we report:
Cost Method
We use the cost method of accounting when we own an interest in an entity and cannot exert significant influence over the entity's operations. Under the cost method, we report:
Use of Estimates in the Preparation of Financial Statements
We make estimates and assumptions when preparing financial statements under generally accepted accounting principles ("GAAP"). These estimates and assumptions affect various matters, including:
These estimates include such items as depreciation, allocation of real estate acquisition costs, allowances for doubtful accounts and expense recognized in connection with share-based compensation. Actual results could differ from those estimates. These estimates involve judgments with respect to, among other things, future economic factors that are difficult to predict and are often beyond management's control. As a result, actual amounts could differ from these estimates.
Acquisitions of Real Estate
We allocate the costs of real estate acquisitions to assets acquired and liabilities assumed based on the relative fair values at the date of acquisition pursuant to the provisions of Statement of Financial Accounting Standards No. 141, "Business Combinations." In estimating the fair value of the tangible and intangible assets acquired, we consider, among other things, information obtained about each property as a result of our due diligence, leasing activities and knowledge of the markets in which the
F-10
Corporate Office Properties Trust and Subsidiaries
Notes to Consolidated Financial Statements (Continued)
(Dollars in thousands, except per share data)
2. Summary of Significant Accounting Policies (Continued)
properties are located. We utilize various valuation methods, such as estimated cash flow projections utilizing discount and capitalization rate assumptions and available market information. We allocate the costs of real estate acquisitions to the following components:
F-11
Corporate Office Properties Trust and Subsidiaries
Notes to Consolidated Financial Statements (Continued)
(Dollars in thousands, except per share data)
2. Summary of Significant Accounting Policies (Continued)
Commercial Real Estate Properties
We report commercial real estate properties at our depreciated cost. The amounts reported for our commercial real estate properties include our costs of:
We capitalize interest expense, real estate taxes, direct internal labor (including allocable overhead costs) and other costs associated with real estate undergoing construction and development activities to the cost of such activities. We continue to capitalize these costs while construction and development activities are underway until a property becomes "operational," which occurs upon the earlier of when leases commence on space or one year after the cessation of major construction activities. When leases commence on portions of a newly-constructed property's space in the period prior to one year from the cessation of major construction activities, we consider that property to be "partially operational." When a property is partially operational, we allocate the costs associated with the property between the portion that is operational and the portion under construction. We start depreciating newly-constructed properties as they become operational.
We depreciate our assets evenly over their estimated useful lives as follows:
| • | Buildings and building improvements | 10-40 years | ||
| • | Land improvements | 10-20 years | ||
| • | Tenant improvements on operating properties | Related lease terms | ||
| • | Equipment and personal property | 3-10 years |
When events or circumstances indicate that a property may be impaired, we perform an undiscounted cash flow analysis. We consider an asset to be impaired when its undiscounted expected future cash flows are less than its depreciated cost. When we determine that an asset is impaired, we utilize methods similar to those used by independent appraisers in estimating the fair value of the asset; this process requires us to make certain estimates and assumptions. We then recognize an impairment loss based on the excess of the carrying amount of the asset over its fair value. We have not recognized impairment losses on our real estate assets to date.
When we determine that a real estate asset will be held for sale, we discontinue the recording of depreciation expense of the asset and estimate the sales price, net of selling costs; if we then determine that the estimated sales price, net of selling costs, is less than the net book value of the asset, we recognize an impairment loss equal to the difference and reduce the carrying amounts of assets.
When we sell an operating property, or determine that an operating property is held for sale, and determine that we have no significant continuing involvement in such property, we classify the results of operations for such property as discontinued operations. Interest expense that is specifically identifiable to properties included in discontinued operations is used in the computation of interest expense attributable to discontinued operations. When properties classified as discontinued operations are
F-12
Corporate Office Properties Trust and Subsidiaries
Notes to Consolidated Financial Statements (Continued)
(Dollars in thousands, except per share data)
2. Summary of Significant Accounting Policies (Continued)
included in computations that determine the amount of our borrowing capacity under certain debt instruments (including our Revolving Credit Facility), we allocate a portion of such debt instruments' interest expense to discontinued operations; we compute this allocation based on the percentage that the related properties represent of all properties included in determining the amount of our borrowing capacity under such debt instruments.
We expense property maintenance and repair costs when incurred.
Sales of Interests in Real Estate
We recognize gains from sales of interests in real estate using the full accrual method, provided that various criteria relating to the terms of sale and any subsequent involvement by us with the real estate sold are met. We recognize gains relating to transactions that do not meet the requirements of the full accrual method of accounting when the full accrual method of accounting criteria are met.
Cash and Cash Equivalents
Cash and cash equivalents include all cash and liquid investments that mature three months or less from when they are purchased. Cash equivalents are reported at cost, which approximates fair value. We maintain our cash in bank accounts in amounts that may exceed federally insured limits at times. We have not experienced any losses in these accounts in the past and believe that we are not exposed to significant credit risk because our accounts are deposited with major financial institutions.
Accounts Receivable
Our accounts receivable are reported net of an allowance for bad debts of $448 at December 31, 2007 and $252 at December 31, 2006. We use judgment in estimating the uncollectability of our accounts receivable based primarily upon the payment history and credit status of the entities associated with the individual accounts.
Revenue Recognition
We recognize rental revenue evenly over the terms of tenant leases. When our leases provide for contractual rent increases, which is most often the case, we average the non-cancelable rental revenues over the lease terms to evenly recognize such revenues; we refer to the adjustments resulting from this process as straight-line rental revenue adjustments. We consider rental revenue under a lease to be non-cancelable when a tenant: (1) may not terminate its lease obligation early; or (2) may terminate its lease obligation early in exchange for a fee or penalty that we consider material enough such that termination would not be probable. We report these straight-line rental revenue adjustments recognized in advance of payments received as deferred rent receivable on our Consolidated Balance Sheets. We report prepaid tenant rents as rents received in advance on our Consolidated Balance Sheets.
When tenants terminate their lease obligations prior to the end of their agreed lease terms, they typically pay fees to cancel these obligations. We recognize such fees as revenue and write off against such revenue any (1) deferred rents receivable and (2) deferred revenue and intangible assets that are amortizable into rental revenue associated with the leases; the resulting net amount is the net revenue from the early termination of the leases. When a tenant's lease for space in a property is terminated
F-13
Corporate Office Properties Trust and Subsidiaries
Notes to Consolidated Financial Statements (Continued)
(Dollars in thousands, except per share data)
2. Summary of Significant Accounting Policies (Continued)
early but the tenant continues to lease such space under a new or modified lease in the property, the net revenue from the early termination of the lease is generally recognized evenly over the remaining life of the new or modified lease in place on that property.
We recognize tenant recovery revenue in the same periods in which we incur the related expenses. Tenant recovery revenue includes payments from tenants as reimbursement for property taxes, utilities and other property operating expenses.
We recognize fees for services provided by us once services are rendered, fees are determinable and collectibility is assured. We generally recognize revenue under construction contracts using the percentage of completion method when the contracts call for services to be provided over a period of time exceeding six months and the revenue and costs for such contracts can be estimated with reasonable accuracy; when these criteria do not apply to a contract, we recognize revenue on that contract once the services under the contract are complete. Under the percentage of completion method, we recognize a percentage of the total estimated revenue on a contract based on the cost of services provided on the contract as of a point in time relative to the total estimated costs on the contract.
Intangible Assets and Deferred Revenue on Real Estate Acquisitions
We capitalize intangible assets and deferred revenue on real estate acquisitions as described in the section above entitled "Acquisitions of Real Estate." We amortize the intangible assets and deferred revenue as follows:
| • | Lease to market value | Related lease terms | ||
| • | Lease-up value | Related lease terms or estimated period of time that tenant will lease space in property | ||
| • | Deemed cost avoidance | Related lease terms | ||
| • | Tenant relationship value | Estimated period of time that tenant will lease space in property | ||
| • | Market concentration premium | 40 years |
We recognize the amortization of lease to market value assets and deferred revenues as adjustments to rental revenue reported in our Consolidated Statements of Operations; we refer to this amortization as amortization of deferred market rental revenue. We recognize the amortization of other intangible assets on real estate acquisitions as depreciation and amortization expense on our Consolidated Statements of Operations.
Deferred Charges
We defer costs that we incur to obtain new tenant leases or extend existing tenant leases. We amortize these costs evenly over the lease terms. When tenant leases are terminated early, we expense any unamortized deferred leasing costs associated with those leases.
We also defer costs for long-term financing arrangements and amortize these costs over the related loan terms on a straight-line basis, which approximates the amortization that would occur under the
F-14
Corporate Office Properties Trust and Subsidiaries
Notes to Consolidated Financial Statements (Continued)
(Dollars in thousands, except per share data)
2. Summary of Significant Accounting Policies (Continued)
effective interest method of amortization. We expense any unamortized loan costs when loans are retired early.
When the costs of acquisitions exceed the fair value of tangible and identifiable intangible assets and liabilities, we record goodwill in connection with such acquisitions. We test goodwill annually for impairment and in interim periods if certain events occur indicating that the carrying value of goodwill may be impaired. We recognize an impairment loss when the discounted expected future cash flows associated with the related reporting unit are less than its unamortized cost.
Derivatives
We are exposed to the effect of interest rate changes in the normal course of business. We use interest rate swap, interest rate cap and forward starting swap agreements in order to attempt to reduce the impact of such interest rate changes. Interest rate differentials that arise under interest rate swap and interest rate cap contracts are recognized in interest expense over the life of the respective contracts. Interest rate differentials that arise under forward starting swaps are recognized in interest expense over the life of the respective loans for which such swaps are obtained. We do not use such derivatives for trading or speculative purposes. We manage counter-party risk by only entering into contracts with major financial institutions based upon their credit ratings and other risk factors.
We recognize all derivatives as assets or liabilities in the balance sheet at fair value with the offset to:
We use standard market conventions and techniques such as discounted cash flow analysis, option pricing models, replacement cost and termination cost in computing the fair value of derivatives at each balance sheet date.
Minority Interests
As discussed previously, we consolidate the accounts of our Operating Partnership and its subsidiaries into our financial statements. However, we do not own 100% of the Operating Partnership. We also do not own 100% of certain consolidated real estate joint ventures. The amounts reported for minority interests on our Consolidated Balance Sheets represent the portion of these consolidated entities' equity that we do not own. The amounts reported for minority interests on our Consolidated Statements of Operations represent the portion of these consolidated entities' net income not allocated to us.
F-15
Corporate Office Properties Trust and Subsidiaries
Notes to Consolidated Financial Statements (Continued)
(Dollars in thousands, except per share data)
2. Summary of Significant Accounting Policies (Continued)
Common units of the Operating Partnership ("common units") are substantially similar economically to our common shares of beneficial interest ("common shares"). Common units not owned by us are also exchangeable into our common shares, subject to certain conditions.
The Operating Partnership has 352,000 Series I Preferred Units issued to an unrelated party that have a liquidation preference of $25.00 per unit, plus any accrued and unpaid distributions of return thereon (as described below), and may be redeemed for cash by the Operating Partnership at our option any time after September 22, 2019. The owner of these units is entitled to a priority annual cumulative return equal to 7.5% of their liquidation preference through September 22, 2019; the annual cumulative preferred return increases for each subsequent five-year period, subject to certain maximum limits. These units are convertible into common units on the basis of 0.5 common units for each Series I Preferred Unit; the resulting common units would then be exchangeable for common shares in accordance with the terms of the Operating Partnership's agreement of limited partnership.
Earnings Per Share ("EPS")
We present both basic and diluted EPS. We compute basic EPS by dividing net income available to common shareholders by the weighted average number of common shares outstanding during the year. Our computation of diluted EPS is similar except that:
Our computation of diluted EPS does not assume conversion of securities into our common shares if conversion of those securities would increase our diluted EPS in a given year. A summary of the
F-16
Corporate Office Properties Trust and Subsidiaries
Notes to Consolidated Financial Statements (Continued)
(Dollars in thousands, except per share data)
2. Summary of Significant Accounting Policies (Continued)
numerator and denominator for purposes of basic and diluted EPS calculations is set forth below (dollars and shares in thousands, except per share data):
| |
For the Years Ended December 31, |
||||||||||
|---|---|---|---|---|---|---|---|---|---|---|---|
| |
2007 |
2006 |
2005 |
||||||||
| Numerator: | |||||||||||
| Income from continuing operations | $ | 31,379 | $ | 30,508 | $ | 32,667 | |||||
| Add: Gain on sales of real estate, net | 1,560 | 732 | 268 | ||||||||
| Less: Preferred share dividends | (16,068 | ) | (15,404 | ) | (14,615 | ) | |||||
| Less: Issuance costs associated with redeemed preferred shares | — | (3,896 | ) | — | |||||||
| Numerator for basic and diluted EPS from continuing operations | 16,871 | 11,940 | 18,320 | ||||||||
| Add: Income from discontinued operations, net | 1,845 | 17,987 | 6,096 | ||||||||
| Numerator for basic and diluted EPS on net income available to common shareholders | $ | 18,716 | $ | 29,927 | $ | 24,416 | |||||
| Denominator (all weighted averages): | |||||||||||
| Denominator for basic EPS (common shares) | 46,527 | 41,463 | 37,371 | ||||||||
| Dilutive effect of share-based compensation awards | 1,103 | 1,799 | 1,626 | ||||||||
| Denominator for diluted EPS | 47,630 | 43,262 | 38,997 | ||||||||
| Basic EPS: | |||||||||||
| Income from continuing operations | $ | 0.36 | $ | 0.29 | $ | 0.49 | |||||
| Income from discontinued operations | 0.04 | 0.43 | 0.16 | ||||||||
| Net income available to common shareholders | $ | 0.40 | $ | 0.72 | $ | 0.65 | |||||
| Diluted EPS | |||||||||||
| Income from continuing operations | $ | 0.35 | $ | 0.28 | $ | 0.47 | |||||
| Income from discontinued operations | $ | 0.04 | $ | 0.41 | $ | 0.16 | |||||
| Net income available to common shareholders | $ | 0.39 | $ | 0.69 | $ | 0.63 | |||||
Our diluted EPS computations do not include the effects of the following securities since the conversions of such securities would increase diluted EPS for the respective periods:
| |
Weighted Average Shares Excluded from Denominator for the Years Ended December 31, |
|||||
|---|---|---|---|---|---|---|
| |
2007 |
2006 |
2005 |
|||
| Conversion of weighted average common units | 8,296 | 8,511 | 8,702 | |||
| Conversion of weighted average convertible preferred units | 176 | 176 | 176 | |||
| Conversion of weighted average convertible preferred shares | 425 | N/A | N/A | |||
| Share-based compensation awards | — | — | 206 | |||
F-17
Corporate Office Properties Trust and Subsidiaries
Notes to Consolidated Financial Statements (Continued)
(Dollars in thousands, except per share data)
2. Summary of Significant Accounting Policies (Continued)
As discussed in Note 9, on September 18, 2006, the Operating Partnership issued a $200,000 aggregate principal amount of 3.50% Exchangeable Senior Notes due 2026. The notes have an exchange settlement feature that provides that the notes may, under certain circumstances, be exchangeable for cash (up to the principal amount of the notes) and, with respect to any excess exchange value, may be exchangeable into (at our option) cash, our common shares or a combination of cash and our common shares at an exchange rate of 18.5249 shares per one thousand dollar principal amount of the notes (exchange rate is as of December 31, 2007 and is equivalent to an exchange price of $53.98 per common share). The Exchangeable Senior Notes did not affect our diluted EPS reported above since the weighted average closing price of our common shares during the period over which the notes were outstanding was less than $53.98.
Share-Based Compensation
We have historically issued two forms of share-based compensation: options to purchase common shares ("options") and restricted common shares ("restricted shares"). Effective, January 1, 2006, we adopted Statement of Financial Accounting Standards No. 123(R), "Share-Based Payment" ("SFAS 123(R)"). The statement establishes standards for the accounting for transactions in which an entity exchanges its equity instruments for goods or services, focusing primarily on accounting for transactions in which an entity obtains employee services in share-based payment transactions. The statement requires us to measure the cost of employee services received in exchange for an award of equity instruments based generally on the fair value of the award on the grant date; such cost should then be recognized over the period during which the employee is required to provide service in exchange for the award (generally the vesting period). No compensation cost is recognized for equity instruments for which employees do not render the requisite service. SFAS 123(R) also requires that share-based compensation be computed based on awards that are ultimately expected to vest; as a result, future forfeitures of awards are to be estimated at the time of grant and revised, if necessary, in subsequent periods if actual forfeitures differ from those estimates. Effective upon our adoption of SFAS 123(R), we began capitalizing costs associated with share-based compensation attributable to employees engaged in construction and development activities. We used the modified prospective application approach to adoption provided for under SFAS 123(R); under this approach, we recognized compensation cost on or after January 1, 2006 for the portion of outstanding awards for which the requisite service was not yet rendered, based on the fair value of those awards on the date of grant.
We elected to adopt the alternative transition method for calculating the tax effects of share-based compensation pursuant to SFAS 123(R). The alternative transition method includes a simplified method to establish the beginning balance of the additional paid-in capital pool related to the tax effects of employee share-based compensation, which is available to absorb tax deficiencies recognized subsequent to the adoption of SFAS 123(R).
We compute the fair value of share options under SFAS 123(R) using the Black-Scholes option-pricing model. Under that model, the risk-free interest rate is based on the U.S. Treasury yield curve in effect at the time of grant. The expected option life is based on our historical experience of employee exercise behavior. Expected volatility is based on historical volatility of our common shares. Expected dividend yield is based on the average historical dividend yield on our common shares over a period of time ending on the grant date of the options.
F-18
Corporate Office Properties Trust and Subsidiaries
Notes to Consolidated Financial Statements (Continued)
(Dollars in thousands, except per share data)
2. Summary of Significant Accounting Policies (Continued)
Prior to January 1, 2006, our general method for accounting for share-based compensation was as follows:
Fair Value of Financial Instruments
The carrying values of cash and cash equivalents, escrows, accounts receivables, accounts payable, accrued expenses and other assets and liabilities are reasonable estimates of their fair values because of the short maturities of these instruments. The carrying or contract values of notes receivable, which are included in prepaid and other assets on our Consolidated Balance Sheets, approximated their fair values at December 31, 2007 and 2006. You should refer to Notes 9 and 10 for fair value of debt and derivative information.
Reclassification
We reclassified certain amounts from the prior periods in connection with discontinued operations to conform to the current period presentation of our Consolidated Financial Statements. These reclassifications did not affect previously reported consolidated net income or shareholders' equity.
Recent Accounting Pronouncement
In June 2006, the FASB issued Interpretation No. 48, "Accounting for Uncertainty in Income Taxes—an interpretation of FASB Statement No. 109," ("FIN 48"). FIN 48 clarifies the accounting for uncertainty in income taxes recognized in an enterprise's financial statements in accordance with FASB Statement No. 109, "Accounting for Income Taxes." FIN 48 prescribes a recognition threshold and measurement attribute for the financial statement recognition and measurement of a tax position taken or expected to be taken in a tax return. FIN 48 also provides guidance on de-recognition, classification, interest and penalties, accounting in interim periods, disclosure and transition. FIN 48 is effective for fiscal years beginning after December 15, 2006. Our adoption of FIN 48 did not have a material effect on our financial position, results of operations or cash flows.
F-19
Corporate Office Properties Trust and Subsidiaries
Notes to Consolidated Financial Statements (Continued)
(Dollars in thousands, except per share data)
2. Summary of Significant Accounting Policies (Continued)
In September 2006, the FASB issued Statement of Financial Accounting Standards No. 157, "Fair Value Measurements" ("SFAS 157"). SFAS 157 defines fair value, establishes a framework for measuring fair value in generally accepted accounting principles and expands disclosures about fair value measurements. The Statement does not require any new fair value measurements but does apply under other accounting pronouncements that require or permit fair value measurements. The changes to current practice resulting from the Statement relate to the definition of fair value, the methods used to measure fair value and the expanded disclosures about fair value measurements. SFAS 157 is effective for financial statements issued for fiscal years beginning after November 15, 2007 and interim periods within those fiscal years, with earlier application encouraged. We do not expect that the adoption of this Statement will have a material effect on our financial position, results of operations or cash flows.
In February 2007, the FASB issued Statement of Financial Accounting Standards No. 159, "The Fair Value Option for Financial Assets and Financial Liabilities" ("SFAS 159"). SFAS 159 permits entities to choose to measure many financial assets and financial liabilities at fair value. Unrealized gains and losses on items for which the fair value option has been elected are reported in earnings. SFAS 159 is effective for fiscal years beginning after November 15, 2007. We are currently assessing the impact of SFAS 159 on our consolidated financial position and results of operations.
In December 2007, the FASB issued Statement of Financial Accounting Standards No. 141(R), "Business Combinations" ("SFAS 141(R)"). SFAS 141(R) requires the acquiring entity in a business combination to recognize all (and only) the assets acquired and liabilities assumed in the transactions; establishes the acquisition-date fair value as the measurement objective for all assets acquired and liabilities assumed; and requires the acquirer to disclose to investors and other users all of the information they need to evaluate and understand the nature and financial effect of the business combination. SFAS 141(R) is effective for fiscal years beginning after December 15, 2008. While we are currently assessing the impact of SFAS 141(R) on our consolidated financial position and results of operations, we do believe that SFAS 141(R) will require us to expense transaction costs associated with property acquisitions, which is a significant change since our current practice is to capitalize such costs into the cost of acquisitions.
In December 2007, the FASB issued Statement of Financial Accounting Standards No. 160, "Noncontrolling Interests in Consolidated Financial Statements" ("SFAS 160"). SFAS 160 requires all entities to report noncontrolling (minority) interests in subsidiaries in the same way—as equity in the consolidated financial statements. SFAS 160 is effective for fiscal years beginning after December 15, 2008. We are currently assessing the impact of SFAS 160 on our consolidated financial position and results of operations.
3. Concentration of Rental Revenue
Major Tenants
The following table summarizes the percentage of our total rental revenue (which excludes tenant recoveries and other real estate operations revenue) earned from (1) individual tenants that accounted
F-20
Corporate Office Properties Trust and Subsidiaries
Notes to Consolidated Financial Statements (Continued)
(Dollars in thousands, except per share data)
3. Concentration of Rental Revenue (Continued)
for at least 5% of our rental revenue from continuing and discontinued operations and (2) the aggregate of the five tenants from which we recognized the most rental revenue in the respective years:
| |
For the Years Ended December 31, |
||||||
|---|---|---|---|---|---|---|---|
| |
2007 |
2006 |
2005 |
||||
| United States Government | 12 | % | 13 | % | 11 | % | |
| Northrop Grumman Corporation(1) | 9 | % | N/A | N/A | |||
| Booz Allen Hamilton, Inc. | 7 | % | 7 | % | 6 | % | |
| Computer Sciences Corporation(1) | N/A | N/A | 5 | % | |||
| Five largest tenants | 31 | % | 32 | % | 30 | % | |
Geographical Concentration
We derived large concentrations of our total revenue from real estate operations (defined as the sum of rental revenue and tenant recoveries and other real estate operations revenue) from certain geographic regions. The table below sets forth certain of these concentrations:
| |
Percentage of Total Revenue from Real Estate Operations for the Years Ended December 31, |
||||||
|---|---|---|---|---|---|---|---|
| |
2007 |
2006 |
2005 |
||||
| Mid-Atlantic region of United States | 94 | % | 95 | % | 99 | % | |
| Greater Washington, D.C.(1) | 74 | % | 78 | % | 83 | % | |
| Baltimore/Washington Corridor | 47 | % | 48 | % | 49 | % | |
Substantially all of our construction contract and service operations revenues were derived from operations in the Greater Washington, D.C. region.
F-21
Corporate Office Properties Trust and Subsidiaries
Notes to Consolidated Financial Statements (Continued)
(Dollars in thousands, except per share data)
4. Commercial Real Estate Properties
Operating properties consisted of the following:
| |
December 31, |
||||||
|---|---|---|---|---|---|---|---|
| |
2007 |
2006 |
|||||
| Land | $ | 413,779 | $ | 343,098 | |||
| Buildings and improvements | 2,064,133 | 1,689,359 | |||||
| 2,477,912 | 2,032,457 | ||||||
| Less: accumulated depreciation | (285,440 | ) | (219,574 | ) | |||
| $ | 2,192,472 | $ | 1,812,883 | ||||
As of December 31, 2007, 429 Ridge Road, an office property located in Dayton, New Jersey that we were under contract to sell for $17,000, was classified as held for sale (Dayton, New Jersey is located in the Northern/Central New Jersey Region). We completed the sale of this property on January 31, 2008. The components associated with 429 Ridge Road as of December 31, 2007 included the following:
| |
December 31, 2007 |
|||
|---|---|---|---|---|
| Land | $ | 2,932 | ||
| Buildings and improvements | 15,003 | |||
| 17,935 | ||||
| Less: accumulated depreciation | (2,947 | ) | ||
| $ | 14,988 | |||
Projects we had under construction or development consisted of the following:
| |
December 31, |
|||||
|---|---|---|---|---|---|---|
| |
2007 |
2006 |
||||
| Land | $ | 214,696 | $ | 153,436 | ||
| Construction in progress | 181,316 | 144,991 | ||||
| $ | 396,012 | $ | 298,427 | |||
2007 Acquisitions
On January 9 and 10, 2007, we completed a series of transactions that resulted in the acquisition of 56 operating properties totaling approximately 2.4 million square feet and land parcels totaling 187 acres. We refer to these transactions collectively as the Nottingham Acquisition. All of the acquired properties are located in Maryland, with 36 of the operating properties, totaling 1.6 million square feet, and land parcels totaling 175 acres, located in White Marsh, Maryland (located in the Suburban Baltimore, Maryland region ("Suburban Baltimore")) and the remaining properties and land parcels located in other regions in Northern Baltimore County and the Baltimore/Washington Corridor. We believe that the land parcels can support at least 2.0 million developable square feet. We completed the
F-22
Corporate Office Properties Trust and Subsidiaries
Notes to Consolidated Financial Statements (Continued)
(Dollars in thousands, except per share data)
4. Commercial Real Estate Properties (Continued)
Nottingham Acquisition for an aggregate cost of $366,852. The table below sets forth the allocation of the acquisition costs of the Nottingham Acquisition:
| Land, operating properties | $ | 70,754 | ||
| Land, construction or development | 37,309 | |||
| Building and improvements | 210,264 | |||
| Intangible assets on real estate acquisitions | 53,214 | |||
| Total assets | 371,541 | |||
| Deferred revenue associated with acquired operating leases | (4,689 | ) | ||
| Total acquisition cost | $ | 366,852 | ||
Intangible assets recorded in connection with the Nottingham Acquisition included the following:
| |
|
Weighted Average Amortization Period (in Years) |
|||
|---|---|---|---|---|---|
| Tenant relationship value | $ | 25,778 | 8 | ||
| Lease-up value | 19,425 | 4 | |||
| Lease cost portion of deemed cost avoidance | 4,206 | 5 | |||
| Lease to market value | 3,805 | 4 | |||
| $ | 53,214 | 6 | |||
Other acquisitions completed in 2007 included the following:
In addition, we acquired a 23-acre parcel of land located in Hanover, Maryland on July 2, 2007, with a fair value upon our acquisition of $9,829 (including improvements thereon contributed by us), through Arundel Preserve #5, LLC, a consolidated joint venture in which we own a 50% interest (Hanover, Marylandi s located in our Baltimore/Washington Corridor region). The joint venture is constructing an office property on the land parcel totaling approximately 152,000 square feet, and we believe the land parcel can support up to 303,000 additional developable square feet. We discuss joint ventures further in Note 5.
2007 Construction and Development Activities
During 2007, we had five properties totaling 568,433 square feet (three located in the Baltimore/Washington Corridor and two in our Other region) become fully operational (68,196 of these square
F-23
Corporate Office Properties Trust and Subsidiaries
Notes to Consolidated Financial Statements (Continued)
(Dollars in thousands, except per share data)
4. Commercial Real Estate Properties (Continued)
feet were placed into service in 2006) and placed into service 48,377 square feet in a partially operational property located in the Baltimore/Washington Corridor.
As of December 31, 2007, we had construction underway on four new buildings in the Baltimore/Washington Corridor (including the partially operational property discussed above and one property owned through Arundel Preserve #5, LLC), four in Colorado Springs and two in San Antonio, Texas ("San Antonio"). We also had development activities underway on four new buildings located in the Baltimore/Washington Corridor, two each in Colorado Springs and Suburban Baltimore and one each in Suburban Maryland and King George County, Virginia. In addition, we had redevelopment underway on one wholly owned existing building located in Colorado Springs and three properties owned by joint ventures (two are located in Northern Virginia and one in the Baltimore/Washington Corridor).
2007 Dispositions
We sold the following operating properties in 2007:
| Project Name |
Location |
Date of Sale |
Number of Buildings |
Total Rentable Square Feet |
Sale Price |
Gain on Sale |
|||||||||
|---|---|---|---|---|---|---|---|---|---|---|---|---|---|---|---|
| 2 and 8 Centre Drive(1) | Monroe, New Jersey | 9/7/2007 | 2 | 32,331 | $ | 6,000 | $ | 1,931 | |||||||
| 7321 Parkway Drive(2) | Hanover, Maryland | 9/7/2007 | 1 | 39,822 | 5,000 | 855 | |||||||||
| 10552 Philadelphia Road(3) | White Marsh, Maryland | 12/27/2007 | 1 | 56,000 | 6,800 | 1,127 | (4) | ||||||||
| 4 | 128,153 | $ | 17,800 | $ | 3,913 | ||||||||||
We also sold three parcels of land in our Suburban Baltimore region totaling 16 acres developable into approximately 230,000 square feet for an aggregate of $8,687, resulting in a gain of $3,002 (excluding income tax of $1,069).
F-24
Corporate Office Properties Trust and Subsidiaries
Notes to Consolidated Financial Statements (Continued)
(Dollars in thousands, except per share data)
4. Commercial Real Estate Properties (Continued)
2006 Acquisitions
We acquired the following office properties in 2006:
| Project Name |
Location |
Date of Acquisition |
Number of Buildings |
Total Rentable Square Feet |
Initial Cost |
||||||
|---|---|---|---|---|---|---|---|---|---|---|---|
| North Creek | Colorado Springs, CO | 5/18/2006 | 3 | 324,549 | $ | 41,508 | |||||
| 1915 & 1925 Aerotech Drive | Colorado Springs, CO | 6/8/2006 | 2 | 75,892 | 8,378 | ||||||
| 7125 Columbia Gateway Drive | Columbia, MD(1) | 6/29/2006 | 1 | 611,379 | 74,168 | ||||||
| 6 | 1,011,820 | $ | 124,054 | ||||||||
The table below sets forth the allocation of the acquisition costs of the properties described above:
| |
North Creek |
1915 & 1925 Aerotech Drive |
7125 Columbia Gateway Drive |
Total |
|||||||||
|---|---|---|---|---|---|---|---|---|---|---|---|---|---|
| Land, operating properties | $ | 2,735 | $ | 1,113 | $ | 17,126 | $ | 20,974 | |||||
| Building and improvements | 34,161 | 6,161 | 46,964 | 87,286 | |||||||||
| Intangible assets on real estate acquisitions | 5,694 | 1,235 | 11,959 | 18,888 | |||||||||
| Total assets | 42,590 | 8,509 | 76,049 | 127,148 | |||||||||
| Deferred revenue associated with acquired operating leases | (1,082 | ) | (131 | ) | (1,881 | ) | (3,094 | ) | |||||
| Total acquisition cost | $ | 41,508 | $ | 8,378 | $ | 74,168 | $ | 124,054 | |||||
We also acquired the following properties in 2006:
F-25
Corporate Office Properties Trust and Subsidiaries
Notes to Consolidated Financial Statements (Continued)
(Dollars in thousands, except per share data)
4. Commercial Real Estate Properties (Continued)
$26,833 on June 29, 2006 (Annapolis Junction, Maryland is located in the Baltimore/Washington Corridor);
In addition, we acquired the following properties through consolidated real estate joint ventures in 2006:
We describe these joint ventures further in Note 5.
2006 Construction and Development Activities
During 2006, we had seven properties totaling 866,000 square feet (four located in the Baltimore/Washington Corridor and one each in Northern Virginia, Colorado Springs and St. Mary's County, Maryland) become fully operational and had one property in the Baltimore/Washington Corridor become partially operational due to 68,196 square feet being placed into service.
As of December 31, 2006, we had construction underway on four new buildings in the Baltimore/Washington Corridor (including the partially operational property discussed above and one property owned through a 50% joint venture) and one each in Suburban Baltimore, Colorado Springs, Chesterfield, Virginia and Southwest Virginia. We also had development activities underway on five new buildings located in the Baltimore/Washington Corridor (including one owned through a joint venture), two each in Suburban Maryland and Colorado Springs (one of which we own a 50% undivided interest) and one each in Suburban Baltimore and King George County, Virginia. In addition, we had redevelopment underway on two wholly owned existing buildings (one is located in the Baltimore/Washington Corridor and one in Colorado Springs) and two properties owned by a joint venture (one is located in Northern Virginia and one in the Baltimore/Washington Corridor).
F-26
Corporate Office Properties Trust and Subsidiaries
Notes to Consolidated Financial Statements (Continued)
(Dollars in thousands, except per share data)
4. Commercial Real Estate Properties (Continued)
2006 Dispositions
We sold the following operating properties in 2006:
| Project Name |
Location |
Date of Sale |
Number of Buildings |
Total Rentable Square Feet |
Sale Price |
Gain on Sale |
||||||||
|---|---|---|---|---|---|---|---|---|---|---|---|---|---|---|
| Lakeview at the Greens | Laurel, Maryland(1) | 2/6/2006 | 2 | 141,783 | $ | 17,000 | $ | 2,087 | ||||||
| 68 Culver Road | Dayton, New Jersey | 3/8/2006 | 1 | 57,280 | 9,700 | 335 | ||||||||
| 710 Route 46 | Fairfield, New Jersey | 7/26/2006 | 1 | 101,263 | 15,750 | 4,498 | ||||||||
| 230 Schilling Circle | Hunt Valley, Maryland(2) | 8/9/2006 | 1 | 107,348 | 13,795 | 951 | ||||||||
| 7 Centre Drive | Monroe, New Jersey | 8/30/2006 | 1 | 19,468 | 3,000 | 684 | ||||||||
| Brown's Wharf | Baltimore, Maryland | 9/28/2006 | 1 | 104,203 | 20,300 | 8,476 | ||||||||
| 7 | 531,345 | $ | 79,545 | $ | 17,031 | |||||||||
We also sold the following in 2006:
5. Real Estate Joint Ventures
During 2007, we had an investment in one unconsolidated real estate joint venture accounted for using the equity method of accounting. Information pertaining to this joint venture investment is set forth below.
| |
Balance at December 31, |
|
|
|
|
|
||||||||||||
|---|---|---|---|---|---|---|---|---|---|---|---|---|---|---|---|---|---|---|
| |
Date Acquired |
|
Nature of Activity |
Total Assets at 12/31/2007 |
Maximum Exposure to Loss(1) |
|||||||||||||
| |
2007 |
2006 |
Ownership |
|||||||||||||||
| Harrisburg Corporate Gateway Partners, L.P. |
$ | (4,246)(2) | $ | (3,614)(2) | 9/29/2005 | 20 | % | Operates 16 buildings(3) | $ | 72,824 | $ | — | ||||||
F-27
Corporate Office Properties Trust and Subsidiaries
Notes to Consolidated Financial Statements (Continued)
(Dollars in thousands, except per share data)
5. Real Estate Joint Ventures (Continued)
estate into the joint venture upon its formation. A difference will continue to exist to the extent the nature of our continuing involvement in the joint venture remains the same.
A two-member management committee is responsible for making major decisions (as defined in the joint venture agreement) for Harrisburg Corporate Gateway Partners, L.P., and we control one of its management committee positions. Net cash flows of the joint venture are distributed to the partners in proportion to their respective ownership interests.
The following table sets forth condensed balance sheets for Harrisburg Corporate Gateway Partners, L.P.:
| |
December 31, |
||||||
|---|---|---|---|---|---|---|---|
| |
2007 |
2006 |
|||||
| Commercial real estate property | $ | 71,205 | $ | 72,688 | |||
| Other assets | 1,619 | 3,207 | |||||
| Total assets | $ | 72,824 | $ | 75,895 | |||
| Liabilities | $ | 67,991 | $ | 67,350 | |||
| Owners' equity | 4,833 | 8,545 | |||||
| Total liabilities and owners' equity | $ | 72,824 | $ | 75,895 | |||
The following table sets forth combined condensed statements of operations for the two unconsolidated real estate joint ventures we owned from January 1, 2005 through December 31, 2007, which included Harrisburg Corporate Gateway Partners, L.P. and Route 46 Partners, a joint venture that was dissolved on July 26, 2006:
| |
For the Years Ended December 31, |
|||||||||
|---|---|---|---|---|---|---|---|---|---|---|
| |
2007 |
2006 |
2005 |
|||||||
| Revenues | $ | 9,795 | $ | 11,521 | $ | 5,850 | ||||
| Property operating expenses | (3,467 | ) | (4,067 | ) | (2,351 | ) | ||||
| Interest expense | (4,099 | ) | (4,224 | ) | (1,843 | ) | ||||
| Depreciation and amortization expense | (3,397 | ) | (4,464 | ) | (1,490 | ) | ||||
| Gain on sale | — | 4,032 | — | |||||||
| Net (loss) income | $ | (1,168 | ) | $ | 2,798 | $ | 166 | |||
Prior to its dissolution, we had a 20% ownership interest in Route 46 Partners, a joint venture that operated one office property in Fairfield, New Jersey. Route 46 Partners sold the office property for $27,000 on July 26, 2006, after which the joint venture was dissolved, and we recognized a gain of $563 on the disposition of our joint venture interest. The table above includes net income from Route 46 Partners of $3,501 for 2006. Our joint venture partner in Route 46 Partners had preference in receiving distributions of cash flows for a defined return. We were not entitled to receive distributions for a defined return until our partner received its defined return. We did not recognize income from our
F-28
Corporate Office Properties Trust and Subsidiaries
Notes to Consolidated Financial Statements (Continued)
(Dollars in thousands, except per share data)
5. Real Estate Joint Ventures (Continued)
investment in Route 46 Partners in 2005 and 2006 until the dissolution of the entity since the income earned by the entity in those periods did not exceed our partner's defined return until that point in time. Upon dissolution of the entity, we recognized income from our investment of $60, excluding the $563 gain on disposition of the joint venture interest discussed above.
We acquired the following interests in consolidated real estate joint ventures in 2006 and 2007:
F-29
Corporate Office Properties Trust and Subsidiaries
Notes to Consolidated Financial Statements (Continued)
(Dollars in thousands, except per share data)
5. Real Estate Joint Ventures (Continued)
and (2) their capital accounts, and any residual amounts according to a waterfall distribution schedule defined in the joint venture agreement under which our partner, who is acting as manager of day-to-day construction activities of the project, receives returns incrementally higher than its ownership percentage as net cash flows to the joint venture increase.
The table below sets forth information pertaining to our investments in consolidated joint ventures at December 31, 2007:
| |
Date Acquired |
Ownership % at 12/31/2007 |
Nature of Activity |
Total Assets at 12/31/2007 |
Collateralized Assets at 12/31/2007 |
|||||||
|---|---|---|---|---|---|---|---|---|---|---|---|---|
| COPT Opportunity Invest I, LLC | 12/20/2005 | 92.5 | % | Redeveloping two properties(1) | $ | 45,876 | $ | — | ||||
| Arundel Preserve #5, LLC | 7/2/2007 | 50.0 | % | Developing land parcel(2) | 22,059 | — | ||||||
| Enterprise Campus Developer, LLC | 6/26/2007 | 90.0 | % | Developing land parcels(3) | 14,208 | — | ||||||
| 13849 Park Center Road, LLC | 10/2/2007 | 92.5 | % | Redeveloping one property(4) | 6,696 | — | ||||||
| COPT-FD Indian Head, LLC | 10/23/2006 | 75.0 | % | Developing land parcel(5) | 4,559 | — | ||||||
| MOR Forbes 2 LLC | 12/24/2002 | 50.0 | % | Operating one building(6) | 4,403 | — | ||||||
| $ | 97,801 | $ | — | |||||||||
Net cash flows of COPT Opportunity Invest I, LLC and MOR Forbes 2 LLC will be distributed to the partners in proportion to and to the extent of (1) their preferred returns (as defined in the joint venture agreements) and (2) their capital accounts, and any residual amounts according to a waterfall distribution schedule defined in the joint venture agreements under which our partners, who are acting as managers of day-to-day construction activities of the projects, receive returns incrementally higher than their ownership percentages as net cash flows to the joint venture increase.
Our commitments and contingencies pertaining to our real estate joint ventures are disclosed in Note 19.
F-30
Corporate Office Properties Trust and Subsidiaries
Notes to Consolidated Financial Statements (Continued)
(Dollars in thousands, except per share data)
6. Intangible Assets on Real Estate Acquisitions
Intangible assets on real estate acquisitions consisted of the following:
| |
December 31, 2007 |
December 31, 2006 |
||||||||||||||||
|---|---|---|---|---|---|---|---|---|---|---|---|---|---|---|---|---|---|---|
| |
Gross Carrying Amount |
Accumulated Amortization |
Net Carrying Amount |
Gross Carrying Amount |
Accumulated Amortization |
Net Carrying Amount |
||||||||||||
| Lease-up value | $ | 125,338 | $ | 58,435 | $ | 66,903 | $ | 105,719 | $ | 38,279 | $ | 67,440 | ||||||
| Tenant relationship value | 35,188 | 7,892 | 27,296 | 9,371 | 1,178 | 8,193 | ||||||||||||
| Lease cost portion of deemed cost avoidance | 17,133 | 8,697 | 8,436 | 12,880 | 5,819 | 7,061 | ||||||||||||
| Lease to market value | 14,428 | 9,555 | 4,873 | 10,623 | 7,178 | 3,445 | ||||||||||||
| Market concentration premium | 1,334 | 181 | 1,153 | 1,333 | 147 | 1,186 | ||||||||||||
| $ | 193,421 | $ | 84,760 | $ | 108,661 | $ | 139,926 | $ | 52,601 | $ | 87,325 | |||||||
Amortization of the intangible asset categories set forth above totaled $32,157 in 2007, $20,675 in 2006 and $12,525 in 2005. The approximate weighted average amortization periods of the categories set forth above follow: lease-up value: nine years; tenant relationship value: seven years; lease cost portion of deemed cost avoidance: five years; lease to market value: four years; and market concentration premium: 35 years. The approximate weighted average amortization period for all of the categories combined is nine years. Estimated amortization expense associated with the intangible asset categories set forth above is $21.1 million for 2008, $18.5 million for 2009, $14.3 million for 2010, $11.5 million for 2011 and $9.2 million for 2012.
7. Deferred Charges
Deferred charges consisted of the following:
| |
December 31, |
||||||
|---|---|---|---|---|---|---|---|
| |
2007 |
2006 |
|||||
| Deferred leasing costs | $ | 63,052 | $ | 52,263 | |||
| Deferred financing costs | 32,617 | 28,275 | |||||
| Goodwill | 1,853 | 1,853 | |||||
| Deferred other | 155 | 155 | |||||
| 97,677 | 82,546 | ||||||
| Accumulated amortization | (48,626 | ) | (38,836 | ) | |||
| Deferred charges, net | $ | 49,051 | $ | 43,710 | |||
F-31
Corporate Office Properties Trust and Subsidiaries
Notes to Consolidated Financial Statements (Continued)
(Dollars in thousands, except per share data)
8. Prepaid and Other Assets
Prepaid and other assets consisted of the following:
| |
December 31, |
|||||
|---|---|---|---|---|---|---|
| |
2007 |
2006 |
||||
| Construction contract costs incurred in excess of billings | $ | 19,425 | $ | 18,324 | ||
| Prepaid expenses | 13,907 | 9,059 | ||||
| Furniture, fixtures and equipment | 10,196 | 10,495 | ||||
| Other assets | 8,920 | 10,589 | ||||
| Prepaid and other assets | $ | 52,448 | $ | 48,467 | ||
9. Debt
Our debt consisted of the following:
| |
|
Carrying Value at December 31, |
|
|
||||||||||
|---|---|---|---|---|---|---|---|---|---|---|---|---|---|---|
| |
Maximum Principal Amount Under Debt at December 31, 2007 |
|
Scheduled Maturity Dates at December 31, 2007 |
|||||||||||
| |
Stated Interest Rates at December 31, 2007 |
|||||||||||||
| |
2007 |
2006 |
||||||||||||
| Mortgage and other loans payable: | ||||||||||||||
| Revolving Credit Facility | $600,000 | $ | 361,000 | $ | 185,000 | LIBOR + 0.75% to 1.25%(1) | September 30, 2011(2) | |||||||
| Mortgage and Other Secured Loans | ||||||||||||||
| Fixed rate mortgage loans(3) | N/A | 1,124,551 | 1,020,619 | 5.20%—8.63%(4) | 2008 - 2034(5) | |||||||||
| Variable rate construction loan facilities | 111,500 | 104,089 | 56,079 | LIBOR + 1.40% to 1.50%(6) | 2008(7) | |||||||||
| Other variable-rate secured loans | N/A | 34,500 | 34,500 | LIBOR + 1.20% to 1.50%(8) | 2008 | |||||||||
| Total mortgage and other secured loans | 1,263,140 | 1,111,198 | ||||||||||||
| Note payable | ||||||||||||||
| Unsecured seller notes | N/A | 1,702 | 2,339 | 0%—5.95% | 2008-2016 | |||||||||
| Total mortgage and other loans payable | 1,625,842 | 1,298,537 | ||||||||||||
| 3.5% Exchangeable Senior Notes | N/A | 200,000 | 200,000 | 3.50% | September 2026(9) | |||||||||
| Total debt | $ | 1,825,842 | $ | 1,498,537 | ||||||||||
F-32
Corporate Office Properties Trust and Subsidiaries
Notes to Consolidated Financial Statements (Continued)
(Dollars in thousands, except per share data)
9. Debt (Continued)
On October 1, 2007, we amended and restated the credit agreement on our Revolving Credit Facility with a group of lenders for which KeyBanc Capital Markets and Wachovia Capital Markets, LLC acted as co-lead arrangers, KeyBank National Association acted as administrative agent and Wachovia Bank, National Association acted as syndication agent. The amended and restated credit agreement increased the amount of the lenders' aggregate commitment under the facility from $500,000 to $600,000, which includes a $50,000 letter of credit subfacility and a $50,000 swingline facility (same-day draw requests), with a right for us to further increase the lenders' aggregate commitment during the term to a maximum of $800,000, subject to certain conditions. Amounts available under the facility are computed based on 65% of our unencumbered asset value, as defined in the agreement. The facility matures on September 30, 2011, and may be extended by one year at our option, subject to certain conditions. The variable interest rate on the facility is based on one of the following, to be selected by us: (1) the LIBOR rate for the interest period designated by us (customarily the 30-day rate) plus 0.75% to 1.25%, as determined by our leverage levels at different points in time; or (2) the greater of (a) the prime rate of the lender then acting as the administrative agent or (b) the Federal Funds Rate, as defined in the credit agreement, plus 0.50%. Interest is payable at the end of each interest period (as defined in the agreement), and principal outstanding under the facility is payable on the maturity date. The facility also carries a quarterly fee that is based on the unused amount of the facility multiplied by a per annum rate of 0.125% to 0.20%. As of December 31, 2007, the maximum amount of borrowing capacity under this line of credit totaled $600,000, of which $238,000 was available.
On September 18, 2006, the Operating Partnership issued a $200,000 aggregate principal amount of 3.50% Exchangeable Senior Notes due 2026. Interest on the notes is payable on March 15 and September 15 of each year. The notes have an exchange settlement feature that provides that the notes may, under certain circumstances, be exchangeable for cash (up to the principal amount of the notes) and, with respect to any excess exchange value, may be exchangeable into (at our option) cash, our common shares or a combination of cash and our common shares at an exchange rate (subject to adjustment) of 18.5249 shares per one thousand dollar principal amount of the notes (exchange rate is as of December 31, 2007 and is equivalent to an exchange price of $53.98 per common share). On or after September 20, 2011, the Operating Partnership may redeem the notes in cash in whole or in part. The holders of the notes have the right to require us to repurchase the notes in cash in whole or in part on each of September 15, 2011, September 15, 2016 and September 15, 2021, or in the event of a "fundamental change," as defined under the terms of the notes, for a repurchase price equal to 100% of the principal amount of the notes plus accrued and unpaid interest. Prior to September 11, 2011, subject to certain exceptions, if (1) a "fundamental change" occurs as a result of certain forms of transactions or series of transactions and (2) a holder elects to exchange its notes in connection with
F-33
Corporate Office Properties Trust and Subsidiaries
Notes to Consolidated Financial Statements (Continued)
(Dollars in thousands, except per share data)
9. Debt (Continued)
such "fundamental change," we will increase the applicable exchange rate for the notes surrendered for exchange by a number of additional shares of our common shares as a "make whole premium." The notes are general unsecured senior obligations of the Operating Partnership and rank equally in right of payment with all other senior unsecured indebtedness of the Operating Partnership. The Operating Partnership's obligations under the notes are fully and unconditionally guaranteed by us.
In the case of each of our mortgage loans, we have pledged certain of our real estate assets as collateral. As of December 31, 2007, a majority of our real estate properties were collateralized on loan obligations. Certain of our debt instruments require that we comply with a number of restrictive financial covenants, including adjusted consolidated net worth, minimum property interest coverage, minimum property hedged interest coverage, minimum consolidated interest coverage, maximum consolidated unhedged floating rate debt and maximum consolidated total indebtedness. As of December 31, 2007, we were in compliance with these financial covenants.
Our debt matures on the following schedule:
| 2008 | $ | 297,120 | |||
| 2009 | 62,643 | ||||
| 2010 | 74,033 | ||||
| 2011 | 470,814 | ||||
| 2012 | 42,200 | ||||
| Thereafter | 878,427 | ||||
| Total | $ | 1,825,237 | (1) | ||
We estimate that the fair value of our debt was $1,826,473 at December 31, 2007 and $1,510,698 at December 31, 2006.
Weighted average borrowings under our Revolving Credit Facility totaled $298,901 in 2007 and $290,660 in 2006. The weighted average interest rate on this credit facility was 6.45% in 2007 and 6.42% in 2006.
We capitalized interest costs of $19,274 in 2007, $14,559 in 2006 and $9,871 in 2005.
F-34
Corporate Office Properties Trust and Subsidiaries
Notes to Consolidated Financial Statements (Continued)
(Dollars in thousands, except per share data)
10. Derivatives
The following table sets forth our derivative contracts and their respective fair values:
| |
|
|
|
|
Fair Value at December 31, |
|||||||||||
|---|---|---|---|---|---|---|---|---|---|---|---|---|---|---|---|---|
| |
Notional Amount |
One-Month LIBOR base |
Effective Date |
Expiration Date |
||||||||||||
| Nature of Derivative |
2007 |
2006 |
||||||||||||||
| Interest rate swap | $ | 50,000 | 5.0360 | % | 3/28/2006 | 3/30/2009 | $ | (765 | ) | $ | (42 | ) | ||||
| Interest rate swap | 25,000 | 5.2320 | % | 5/1/2006 | 5/1/2009 | (486 | ) | (133 | ) | |||||||
| Interest rate swap | 25,000 | 5.2320 | % | 5/1/2006 | 5/1/2009 | (486 | ) | (133 | ) | |||||||
| Interest rate swap | 50,000 | 4.3300 | % | 10/23/2007 | 10/23/2009 | (596 | ) | N/A | ||||||||
| $ | (2,333 | ) | $ | (308 | ) | |||||||||||
These amounts are included on our Consolidated Balance Sheets as other liabilities.
We designated these derivatives as cash flow hedges. These contracts hedge the risk of changes in interest rates on certain of our one-month LIBOR-based variable rate borrowings until their respective maturities.
The table below sets forth our accounting application of changes in derivative fair values:
| |
For the Years Ended December 31, |
|||||||||
|---|---|---|---|---|---|---|---|---|---|---|
| |
2007 |
2006 |
2005 |
|||||||
| Decrease in fair value applied to | ||||||||||
| AOCL(1) and minority interests | $ | (2,025 | ) | $ | (308 | ) | $ | — | ||
11. Shareholders' Equity
Preferred Shares
Preferred shares of beneficial interest ("preferred shares") consisted of the following:
| |
December 31, |
|||||
|---|---|---|---|---|---|---|
| |
2007 |
2006 |
||||
| 2,200,000 designated as Series G Cumulative Redeemable Preferred Shares of beneficial interest (2,200,000 shares issued with an aggregate liquidation preference of $55,000) | $ | 22 | $ | 22 | ||
| 2,000,000 designated as Series H Cumulative Redeemable Preferred Shares of beneficial interest (2,000,000 shares issued with an aggregate liquidation preference of $50,000) | 20 | 20 | ||||
| 3,390,000 designated as Series J Cumulative Redeemable Preferred Shares of beneficial interest (3,390,000 shares issued with an aggregate liquidation preference of $84,750) | 34 | 34 | ||||
| 531,667 designated as Series K Cumulative Redeemable Convertible Preferred Shares of beneficial interest (531,667 shares issued with an aggregate liquidation preference of $26,583) | 5 | — | ||||
| Total preferred shares | $ | 81 | $ | 76 | ||
F-35
Corporate Office Properties Trust and Subsidiaries
Notes to Consolidated Financial Statements (Continued)
(Dollars in thousands, except per share data)
11. Shareholders' Equity (Continued)
Set forth below is a summary of additional information pertaining to our preferred shares of beneficial interest:
| Series of Preferred Share of Beneficial Interest |
# of Shares Issued |
Month of Issuance |
Annual Dividend Yield(1) |
Annual Dividend Per Share |
Earliest Redemption Date |
|||||
|---|---|---|---|---|---|---|---|---|---|---|
| Series E | 1,150,000 | April 2001 | 10.250 | % | 2.56250 | NA(2) | ||||
| Series F | 1,425,000 | September 2001 | 9.875 | % | 2.46875 | NA(3) | ||||
| Series G | 2,200,000 | August 2003 | 8.000 | % | 2.00000 | 8/11/2008 | ||||
| Series H | 2,000,000 | December 2003 | 7.500 | % | 1.87500 | 12/18/2008 | ||||
| Series J | 3,390,000 | July 2006 | 7.625 | % | 1.90625 | 7/20/2011 | ||||
| Series K | 531,667 | January 2007 | 5.600 | % | 2.80000 | 1/9/2017 |
Series E through Series J Preferred Shares of beneficial interest set forth in the table above are nonvoting and redeemable for cash at $25 per share at our option on or after the earliest redemption date. Series K Cumulative Redeemable Convertible Preferred Shares of beneficial interest ("Series K Preferred Shares") in the table above are nonvoting and redeemable for cash at $50 per share at our option on or after January 9, 2017. Holders of all preferred shares are entitled to cumulative dividends, payable quarterly (as and if declared by the Board of Trustees). In the case of each series of preferred shares, there is a series of preferred units in the Operating Partnership owned by us that carries substantially the same terms.
On July 15, 2006, we redeemed all of the outstanding 10.25% Series E Cumulative Redeemable Preferred Shares of beneficial interest (the "Series E Preferred Shares") at a price of $25 per share, or $28,750. On October 15, 2006, we redeemed all of the outstanding Series F Cumulative Redeemable Preferred Shares of beneficial interest (the "Series F Preferred Shares") at a price of $25 per share, or $35,625. We recognized a $3,896 decrease to net income available to common shareholders pertaining to the original issuance costs incurred on the Series E and Series F Preferred Shares at the time of the redemption.
On July 20, 2006, we completed the sale of 3.39 million Series J Cumulative Redeemable Preferred Shares (the "Series J Preferred Shares") at a price of $25 per share. We contributed the net proceeds after offering costs totaling $81,857 to our Operating Partnership in exchange for 3.39 million Series J Preferred Units. The Series J Preferred Units carry terms that are substantially the same as the Series J Preferred Shares.
On January 9, 2007, we issued the Series K Preferred Shares in the Nottingham Acquisition at a value of, and liquidation preference equal to, $50 per share. The Series K Preferred Shares are nonvoting, redeemable for cash at $50 per share at our option on or after January 9, 2017, and are convertible, subject to certain conditions, into common shares on the basis of 0.8163 common shares
F-36
Corporate Office Properties Trust and Subsidiaries
Notes to Consolidated Financial Statements (Continued)
(Dollars in thousands, except per share data)
11. Shareholders' Equity (Continued)
for each preferred share, in accordance with the terms of the Articles Supplementary describing the Series K Preferred Shares. Holders of the Series K Preferred Shares are entitled to cumulative dividends, payable quarterly (as and if declared by our Board of Trustees). Dividends accrue from the date of issue at the annual rate of $2.80 per share, which is equal to 5.6% of the $50 per share liquidation preference.
Common Shares
In April 2006, we sold 2.0 million common shares to an underwriter at a net price of $41.31 per share. We contributed the net proceeds after offering costs totaling $82,433 to our Operating Partnership in exchange for 2.0 million common units.
In connection with the Nottingham Acquisition in January 2007, we issued 3.2 million common shares at a value of $49.57 per share.
Over the three years ended December 31, 2007, common units in our Operating Partnership were converted into common shares on the basis of one common share for each common unit in the amount of 554,221 in 2007, 245,793 in 2006 and 253,575 in 2005.
See Note 12 for disclosure regarding common share activity pertaining to our share-based compensation plans.
Accumulated Other Comprehensive Loss
The table below sets forth activity in the accumulated other comprehensive loss component of shareholders' equity:
| |
For the Years Ended December 31, |
|||||||||
|---|---|---|---|---|---|---|---|---|---|---|
| |
2007 |
2006 |
2005 |
|||||||
| Beginning balance | $ | (693 | ) | $ | (482 | ) | $ | — | ||
| Unrealized loss on derivatives, net of minority interests | (1,731 | ) | (262 | ) | (482 | ) | ||||
| Realized loss on derivatives, net of minority interests | 52 | 51 | — | |||||||
| Ending balance | $ | (2,372 | ) | $ | (693 | ) | $ | (482 | ) | |
The table below sets forth our comprehensive income:
| |
For the Years Ended December 31, |
|||||||||
|---|---|---|---|---|---|---|---|---|---|---|
| |
2007 |
2006 |
2005 |
|||||||
| Net income | $ | 34,784 | $ | 49,227 | $ | 39,031 | ||||
| Unrealized loss on derivatives, net of minority interests | (1,731 | ) | (262 | ) | (482 | ) | ||||
| Realized loss on derivatives, net of minority interests | 52 | 51 | — | |||||||
| Total comprehensive income | $ | 33,105 | $ | 49,016 | $ | 38,549 | ||||
F-37
Corporate Office Properties Trust and Subsidiaries
Notes to Consolidated Financial Statements (Continued)
(Dollars in thousands, except per share data)
12. Share-based Compensation and Employee Benefit Plans
Share-based Compensation Plans
In 1993, we adopted a plan for our Trustees under which we have 75,000 options reserved for issuance. These options expire ten years after the date of grant and are all exercisable. Shares for this plan are issued under a registration statement on Form S-8 that became effective upon filing with the Securities and Exchange Commission. As of December 31, 2007, there were no remaining awards available for future grant under this plan.
In March 1998, we adopted a long-term incentive plan for our Trustees and employees. This plan provides for the award of options, restricted shares and dividend equivalents. We are authorized to issue awards under the plan amounting to no more than 13% of the total of (1) our common shares outstanding plus (2) the number of shares that would be outstanding upon redemption of all units of the Operating Partnership or other securities that are convertible into our common shares. Trustee options under this plan become exercisable beginning on the first anniversary of their grant. The vesting periods for employees' options under this plan range from immediately to five years, although they generally are three years. Options expire ten years after the date of grant. Restricted shares generally vest either over (1) a five-year period in specified percentages or (2) a three-year period in equal increments, beginning on the first anniversary of the grant date provided that the employees remain employed by us. Shares for this plan are issued under a registration statement on Form S-8 that became effective upon filing with the Securities and Exchange Commission. As of December 31, 2007, we had 975,504 awards available for future grant under this plan.
F-38
Corporate Office Properties Trust and Subsidiaries
Notes to Consolidated Financial Statements (Continued)
(Dollars in thousands, except per share data)
12. Share-based Compensation and Employee Benefit Plans (Continued)
The following table summarizes option transactions under the plans described above:
| |
Shares |
Range of Exercise Price per Share |
Weighted Average Exercise Price per Share |
Weighted Average Remaining Contractual Term (in Years) |
Aggregate Intrinsic Value |
|||||||
|---|---|---|---|---|---|---|---|---|---|---|---|---|
| Outstanding at December 31, 2004 | 2,687,084 | $5.38–$28.69 | $ | 11.43 | ||||||||
| Granted—2005 | 521,588 | $25.52–$36.08 | $ | 28.38 | ||||||||
| Forfeited/Expired—2005 | (87,665 | ) | $10.00–$34.89 | $ | 23.60 | |||||||
| Exercised—2005 | (411,080 | ) | $5.38–$25.05 | $ | 10.70 | |||||||
| Outstanding at December 31, 2005 | 2,709,927 | $5.63–$36.08 | $ | 14.41 | ||||||||
| Granted—2006 | 503,800 | $36.24–$50.59 | $ | 42.84 | ||||||||
| Forfeited/Expired—2006 | (68,107 | ) | $13.60–$47.79 | $ | 33.43 | |||||||
| Exercised—2006 | (589,101 | ) | $5.63–$34.76 | $ | 11.49 | |||||||
| Outstanding at December 31, 2006 | 2,556,519 | $7.38–$50.59 | $ | 20.18 | 6 | $ | 77,447 | |||||
| Granted—2007 | 297,691 | $42.40–$57.00 | $ | 47.87 | ||||||||
| Forfeited/Expired—2007 | (99,177 | ) | $20.34–$53.16 | $ | 42.31 | |||||||
| Exercised—2007 | (613,689 | ) | $5.25–$44.73 | $ | 12.18 | |||||||
| Outstanding at December 31, 2007 | 2,141,344 | $7.38–$57.00 | $ | 25.29 | 6 | $ | 22,639 | |||||
| Exercisable at December 31, 2005 | 2,054,919 | (1) | $ | 10.58 | ||||||||
| Exercisable at December 31, 2006 | 1,753,428 | (2) | $ | 12.65 | ||||||||
| Exercisable at December 31, 2007 | 1,507,876 | (3) | $ | 18.05 | 5 | $ | 22,248 | |||||
| Options expected to vest | 589,125 | $25.52–$57.00 | $ | 42.54 | 9 | $ | 364 | |||||
The aggregate intrinsic value of options exercised was $23,627 in 2007, $19,748 in 2006 and $8,366 in 2005.
F-39
Corporate Office Properties Trust and Subsidiaries
Notes to Consolidated Financial Statements (Continued)
(Dollars in thousands, except per share data)
12. Share-based Compensation and Employee Benefit Plans (Continued)
We received proceeds from the exercise of options of $7,476 in 2007, $6,767 in 2006 and $4,398 in 2005.
We computed share-based compensation expense under the fair value method using the Black-Scholes option-pricing model; the weight average assumptions we used in that model are set forth below:
| |
For the Years Ended December 31, |
|||||||||
|---|---|---|---|---|---|---|---|---|---|---|
| |
2007 |
2006 |
2005 |
|||||||
| Weighted average fair value of grants on grant date | $ | 9.58 | $ | 8.99 | $ | 2.82 | ||||
| Risk-free interest rate(1) | 4.64 | % | 4.91 | % | 3.97 | % | ||||
| Expected life-years | 6.15 | 6.82 | 6.00 | |||||||
| Expected volatility(2) | 21.46 | % | 23.69 | % | 22.70 | % | ||||
| Expected dividend yield(3) | 3.24 | % | 3.82 | % | 6.90 | % | ||||
A summary of the weighted average grant-date fair value per option granted is as follows:
| |
For the Years Ended December 31, |
||||||||
|---|---|---|---|---|---|---|---|---|---|
| |
2007 |
2006 |
2005 |
||||||
| Weighted average grant-date fair value | $ | 9.58 | $ | 8.99 | $ | 2.82 | |||
| Weighted average grant-date fair value—exercise price equals market price on grant-date | $ | 9.58 | $ | 8.99 | $ | 2.83 | |||
| Weighted average grant-date fair value—exercise price exceeds market price on grant-date | N/A | N/A | $ | 2.51 | |||||
| Weighted average grant-date fair value—exercise price less than market price on grant-date | N/A | N/A | N/A | ||||||
The weighted average grant date fair value of option issuances increased significantly in 2006 over previous years due in large part to a large decrease in the weighted average dividend yield assumption in 2006. We derive our dividend yield assumption from the average historical dividend yield on our common shares over a period of time ending on the grant date of options. Prior to 2006, we used a longer historical timeframe for purposes of estimating our dividend yield assumption. In response to the trading price for our common shares having increased significantly through 2006, which had a decreasing effect on our dividend yield, we concluded that the use of a shorter historical timeframe for estimating the dividend yield assumption was appropriate.
F-40
Corporate Office Properties Trust and Subsidiaries
Notes to Consolidated Financial Statements (Continued)
(Dollars in thousands, except per share data)
12. Share-based Compensation and Employee Benefit Plans (Continued)
The following table summarizes restricted share transactions under the plans described above for 2007 and 2006:
| |
Shares |
Weighted Average Grant Date Fair Value |
|||
|---|---|---|---|---|---|
| Unvested at December 31, 2005 | 395,609 | $ | 19.88 | ||
| Granted | 163,420 | $ | 42.65 | ||
| Forfeited | (20,822 | ) | $ | 23.67 | |
| Vested | (124,517 | ) | $ | 17.16 | |
| Unvested at December 31, 2006 | 413,690 | $ | 29.51 | ||
| Granted | 141,359 | $ | 49.50 | ||
| Forfeited | (1,917 | ) | $ | 50.57 | |
| Vested | (137,227 | ) | $ | 22.54 | |
| Unvested at December 31, 2007 | 415,905 | $ | 38.50 | ||
| Restricted shares expected to vest | 395,110 | ||||
The fair value of restricted shares that vested during the year ended December 31, 2007 was $6,938. The fair value of restricted shares that vested during the year ended December 31, 2006 was $5,319.
We realized a windfall tax benefit of $562 in 2006 on options exercised and restricted shares vested by employees of our subsidiaries that are subject to income tax. We did not realize a windfall tax benefit in 2007 because COMI had a net operating loss carryforward for tax purposes; had COMI not had a net operating loss carryforward in 2007, we would have recognized a windfall tax benefit of $1,691 in 2007.
F-41
Corporate Office Properties Trust and Subsidiaries
Notes to Consolidated Financial Statements (Continued)
(Dollars in thousands, except per share data)
12. Share-based Compensation and Employee Benefit Plans (Continued)
The table below sets forth information relating to expenses from share-based compensation included in our Consolidated Statements of Operations:
| |
For the Years Ended December 31, |
|||||||
|---|---|---|---|---|---|---|---|---|
| |
2007 |
2006 |
||||||
| Increase in general and administrative expenses | $ | 4,461 | $ | 2,659 | ||||
| Increase in construction contract and other service operations expenses | 1,749 | 964 | ||||||
| Share-based compensation expense | 6,210 | 3,623 | ||||||
| Income taxes | (150 | ) | (107 | ) | ||||
| Minority interests | (946 | ) | (617 | ) | ||||
| Net share-based compensation expense | $ | 5,114 | $ | 2,899 | ||||
Net share-based compensation expense per share |
||||||||
| Basic | $ | 0.11 | $ | 0.07 | ||||
| Diluted | $ | 0.11 | $ | 0.07 | ||||
We also capitalized share-based compensation costs of approximately $433 in 2007 and $212 in 2006.
The amounts included in our Consolidated Statements of Operations for share-based compensation reflected an estimate of pre-vesting forfeitures of 7% for options and a range of 2% to 5% for restricted shares for the year ended December 31, 2007 and 5% for all share-based awards in the year ended December 31, 2006.
As of December 31, 2007, there was $3,392 of unrecognized compensation cost related to nonvested options that is expected to be recognized over a weighted average period of approximately two years. As of December 31, 2007, there was $10,913 of unrecognized compensation cost related to unvested restricted shares that is expected to be recognized over a weighted average period of approximately three years.
Disclosure for Periods Prior to 2006, Including Pro Forma Financial Information Under SFAS 123
Expenses from share-based compensation reflected in our Consolidated Statements of Operations for the year ended December 31, 2005 were as follows:
| |
For the Year Ended December 31, 2005 |
||
|---|---|---|---|
| Increase in general and administrative expenses | $ | 1,903 | |
| Increase in construction contract and other service operations expenses | 230 | ||
F-42
Corporate Office Properties Trust and Subsidiaries
Notes to Consolidated Financial Statements (Continued)
(Dollars in thousands, except per share data)
12. Share-based Compensation and Employee Benefit Plans (Continued)
The following table summarizes our operating results for the year ended December 31, 2005 as if we elected to account for our share-based compensation under the fair value provisions of SFAS 123 in those periods:
| |
For the Year Ended December 31, 2005 |
||||
|---|---|---|---|---|---|
| Net income, as reported | $ | 39,031 | |||
| Add: Share-based compensation expense, net of related tax effects and minority interests, included in the determination of net income | 1,670 | ||||
| Less: Share-based compensation expense determined under the fair value based method, net of related tax effects and minority interests | (1,671 | ) | |||
| Net income, pro forma | $ | 39,030 | |||
| Basic EPS on net income available to common shareholders, as reported | $ | 0.65 | |||
| Basic EPS on net income available to common shareholders, pro forma | $ | 0.65 | |||
| Diluted EPS on net income available to common shareholders, as reported | $ | 0.63 | |||
| Diluted EPS on net income available to common shareholders, pro forma | $ | 0.63 | |||
In computing the amounts reflected above, we accounted for forfeitures as they occurred and we did not capitalize costs associated with share-based compensation.
401(k) Plan
We have a 401(k) defined contribution plan covering substantially all of our employees that permits participants to defer up to a maximum of 15% of their compensation. We match a participant's contribution in an amount equal to 50% of the participant's elective deferral for the plan year up to a maximum of 6% of a participant's annual compensation. Employees' contributions are fully vested and our matching contributions vest in annual one-third increments. Once an employee has been with us for three years, all matching contributions are fully vested. We fund all contributions with cash. Our matching contributions under the plan totaled approximately $442 in 2007, $538 in 2006 and $396 in 2005. The 401(k) plan is fully funded at December 31, 2007.
Deferred Compensation Plan
We have a non-qualified elective deferred compensation plan for certain members of our management team that permits participants to defer up to 100% of their compensation on a pre-tax basis and receive a tax-deferred return on such deferrals. We match the participant's contribution in an amount equal to 50% of the participant's elective deferral for the plan year up to a maximum of 6% of a participant's annual compensation after deducting contributions, if any, made under our 401(k) plan. Deferred compensation related to an employee contribution is charged to expense and is fully vested.
F-43
Corporate Office Properties Trust and Subsidiaries
Notes to Consolidated Financial Statements (Continued)
(Dollars in thousands, except per share data)
12. Share-based Compensation and Employee Benefit Plans (Continued)
Deferred compensation related to the Company's matching contribution is charged to expense and vests in annual one-third increments. Once an employee has been with us for three years, all matching contributions are fully vested. The balance of the plan, which was fully funded, totaled $6,014 at December 31, 2007 and $5,195 at December 31, 2006, and is included in the accompanying Consolidated Balance Sheets.
13. Related Party Transactions
We earned fees from unconsolidated joint ventures totaling $458 in 2007, $619 in 2006 and $326 in 2005. These fees were for property management, construction and leasing services performed.
14. Operating Leases
We lease our properties to tenants under operating leases with various expiration dates extending to the year 2025. Gross minimum future rentals on noncancelable leases in our consolidated properties at December 31, 2007 were as follows:
| For the Years Ended December 31, |
|
|||
|---|---|---|---|---|
| 2008 | $ | 312,664 | ||
| 2009 | 275,274 | |||
| 2010 | 222,978 | |||
| 2011 | 183,754 | |||
| 2012 | 146,720 | |||
| Thereafter | 542,382 | |||
| Total | $ | 1,683,772 | ||
We consider a lease to be noncancelable when a tenant (1) may not terminate its lease obligation early or (2) may terminate its lease obligation early in exchange for a fee or penalty that we consider material enough such that termination would be highly unlikely.
F-44
Corporate Office Properties Trust and Subsidiaries
Notes to Consolidated Financial Statements (Continued)
(Dollars in thousands, except per share data)
15. Supplemental Information to Statements of Cash Flows
| |
For the Years Ended December 31, |
||||||||||
|---|---|---|---|---|---|---|---|---|---|---|---|
| |
2007 |
2006 |
2005 |
||||||||
| Interest paid, net of capitalized interest | $ | 84,278 | $ | 68,617 | $ | 57,100 | |||||
| Income taxes paid | $ | 123 | $ | 54 | $ | — | |||||
| Supplemental schedule of non-cash investing and financing activities: | |||||||||||
| Debt assumed in connection with acquisitions | $ | 38,996 | $ | 39,011 | $ | 17,347 | |||||
| Issuance of common shares in connection with acquisition of properties (before transaction costs) | $ | 156,691 | $ | — | $ | — | |||||
| Issuance of preferred shares in connection with acquisition of properties (before transaction costs) | $ | 26,583 | $ | — | $ | — | |||||
| Proceeds from sales of properties invested in restricted cash account | $ | 701 | $ | 33,730 | $ | — | |||||
| Restricted cash used in connection with acquisitions of properties | $ | 20,827 | $ | — | $ | — | |||||
| Issuance of common units in the Operating Partnership in connection with acquisition of properties (before transaction costs) | $ | 12,125 | $ | 7,497 | $ | 2,647 | |||||
| Issuance of common units in the Operating Partnership in connection with contribution of properties accounted for under the financing method of accounting | $ | — | $ | — | $ | 3,687 | |||||
| Increase (decrease) in accrued capital improvements and leasing costs | $ | 8,638 | $ | 18,181 | $ | (9,349 | ) | ||||
| Reclassification of operating assets to investment assets in connection with consolidation of real estate joint ventures | $ | 16,725 | $ | — | $ | — | |||||
| Consolidation of real estate joint venture: | |||||||||||
| Real estate assets | $ | 3,864 | $ | — | $ | — | |||||
| Prepaid and other assets | 1,021 | — | — | ||||||||
| Minority interest | (4,885 | ) | — | — | |||||||
| Net adjustment | $ | — | $ | — | $ | — | |||||
| Property acquired through lease arrangement included in rents received in advance and security deposits | $ | 711 | $ | 1,282 | $ | — | |||||
| Amortization of discounts and premiums on mortgage loans to commercial real estate properties | $ | 307 | $ | 196 | $ | 273 | |||||
| Decrease in fair value of derivatives applied to AOCL and minority interests | $ | (2,025 | ) | $ | (308 | ) | $ | — | |||
| Adjustments to minority interests resulting from changes in ownership of Operating Partnership by COPT | $ | 29,761 | $ | 16,255 | $ | 12,888 | |||||
| Dividends/distribution payable | $ | 22,441 | $ | 19,164 | $ | 16,703 | |||||
| Decrease in minority interests and increase in shareholders' equity in connection with the conversion of common units into common shares | $ | 25,408 | $ | 11,078 | $ | 9,120 | |||||
| Issuance of restricted shares | $ | — | $ | — | $ | 3,276 | |||||
F-45
Corporate Office Properties Trust and Subsidiaries
Notes to Consolidated Financial Statements (Continued)
(Dollars in thousands, except per share data)
16. Information by Business Segment
As of December 31, 2007, we had nine primary office property segments: Baltimore/Washington Corridor; Northern Virginia; Suburban Baltimore; Colorado Springs; Suburban Maryland; Greater Philadelphia; St. Mary's and King George Counties; San Antonio; and Northern/Central New Jersey. We also had an office property segment in Greater Harrisburg, Pennsylvania prior to the contribution of our properties in that region into a real estate joint venture in exchange for cash and a 20% interest in such joint venture on September 29, 2005.
The table below reports segment financial information. Our segment entitled "Other" includes assets and operations not specifically associated with the other defined segments, including corporate assets and investments in unconsolidated entities. We measure the performance of our segments based on total revenues less property operating expenses, a measure we define as net operating income ("NOI"). We believe that NOI is an important supplemental measure of operating performance for a REIT's operating real estate because it provides a measure of the core operations that is unaffected by depreciation, amortization, financing and general and administrative expenses; this measure is particularly useful in our opinion in evaluating the performance of geographic segments, same-office property groupings and individual properties.
| |
Baltimore/ Washington Corridor |
Northern Virginia |
Suburban Baltimore |
Colorado Springs |
Suburban Maryland |
Greater Philadelphia |
St. Mary's & King George Counties |
San Antonio |
Northern/ Central New Jersey |
Greater Harrisburg |
Other |
Intersegment Eliminations |
Total |
||||||||||||||||||||||||||
|---|---|---|---|---|---|---|---|---|---|---|---|---|---|---|---|---|---|---|---|---|---|---|---|---|---|---|---|---|---|---|---|---|---|---|---|---|---|---|---|
| Year Ended December 31, 2007 | |||||||||||||||||||||||||||||||||||||||
| Revenues | $ | 173,509 | $ | 72,402 | $ | 54,570 | $ | 15,304 | $ | 16,675 | $ | 10,025 | $ | 12,665 | $ | 7,370 | $ | 4,846 | $ | — | $ | 7,583 | $ | (3,430 | ) | $ | 371,519 | ||||||||||||
| Property operating expenses | 56,818 | 25,892 | 22,013 | 5,901 | 6,665 | 126 | 3,054 | 1,577 | 2,047 | — | 4,709 | (3,862 | ) | 124,940 | |||||||||||||||||||||||||
| NOI | $ | 116,691 | $ | 46,510 | $ | 32,557 | $ | 9,403 | $ | 10,010 | $ | 9,899 | $ | 9,611 | $ | 5,793 | $ | 2,799 | $ | — | $ | 2,874 | $ | 432 | $ | 246,579 | |||||||||||||
| Additions to commercial real estate properties | $ | 159,702 | $ | 23,696 | $ | 280,234 | $ | 49,904 | $ | 2,927 | $ | 1,236 | $ | 1,040 | $ | 3,204 | $ | 688 | $ | — | $ | 61,036 | $ | (2,077 | ) | $ | 581,590 | ||||||||||||
| Segment assets at December 31, 2007 | $ | 1,215,497 | $ | 482,570 | $ | 448,093 | $ | 181,639 | $ | 131,020 | $ | 96,051 | $ | 95,208 | $ | 59,296 | $ | 40,672 | $ | — | $ | 181,194 | $ | 613 | $ | 2,931,853 | |||||||||||||
| Year Ended December 31, 2006 | |||||||||||||||||||||||||||||||||||||||
| Revenues | $ | 147,648 | $ | 63,515 | $ | 28,570 | $ | 9,776 | $ | 15,316 | $ | 10,025 | $ | 12,087 | $ | 7,441 | $ | 12,295 | $ | (6 | ) | $ | 1,668 | $ | (2,543 | ) | $ | 305,792 | |||||||||||
| Property operating expenses | 45,667 | 22,727 | 11,889 | 3,659 | 5,710 | 168 | 3,116 | 1,533 | 3,311 | (49 | ) | 2,042 | (3,740 | ) | 96,033 | ||||||||||||||||||||||||
| NOI | $ | 101,981 | $ | 40,788 | $ | 16,681 | $ | 6,117 | $ | 9,606 | $ | 9,857 | $ | 8,971 | $ | 5,908 | $ | 8,984 | $ | 43 | $ | (374 | ) | $ | 1,197 | $ | 209,759 | ||||||||||||
| Additions to commercial real estate properties | $ | 190,038 | $ | 21,638 | $ | 6,206 | $ | 66,628 | $ | 4,664 | $ | 1,202 | $ | 1,823 | $ | 8,814 | $ | 1,398 | $ | 5 | $ | 39,466 | $ | (1,720 | ) | $ | 340,162 | ||||||||||||
| Segment assets at December 31, 2006 | $ | 1,081,356 | $ | 473,540 | $ | 162,786 | $ | 135,118 | $ | 117,573 | $ | 97,795 | $ | 97,661 | $ | 52,661 | $ | 48,499 | $ | — | $ | 155,043 | $ | (2,431 | ) | $ | 2,419,601 | ||||||||||||
| Year Ended December 31, 2005 | |||||||||||||||||||||||||||||||||||||||
| Revenues | $ | 123,819 | $ | 60,255 | $ | 11,099 | $ | 1,006 | $ | 12,555 | $ | 10,025 | $ | 12,852 | $ | 1,814 | $ | 13,779 | $ | 6,605 | $ | 169 | $ | (1,619 | ) | $ | 252,359 | ||||||||||||
| Property operating expenses | 37,373 | 20,348 | 4,367 | 407 | 4,791 | 157 | 2,784 | 334 | 5,737 | 2,209 | 1,971 | (4,238 | ) | 76,240 | |||||||||||||||||||||||||
| NOI | $ | 86,446 | $ | 39,907 | $ | 6,732 | $ | 599 | $ | 7,764 | $ | 9,868 | $ | 10,068 | $ | 1,480 | $ | 8,042 | $ | 4,396 | $ | (1,802 | ) | $ | 2,619 | $ | 176,119 | ||||||||||||
| Additions to commercial real estate properties | $ | 144,334 | $ | 57,972 | $ | 110,085 | $ | 57,901 | $ | 58,707 | $ | 872 | $ | 5,739 | $ | 42,658 | $ | 2,199 | $ | 449 | $ | 884 | $ | (465 | ) | $ | 481,335 | ||||||||||||
| Segment assets at December 31, 2005 | $ | 901,718 | $ | 463,179 | $ | 189,576 | $ | 63,767 | $ | 130,221 | $ | 99,357 | $ | 99,191 | $ | 42,884 | $ | 67,206 | $ | — | $ | 73,423 | $ | (763 | ) | $ | 2,129,759 | ||||||||||||
F-46
Corporate Office Properties Trust and Subsidiaries
Notes to Consolidated Financial Statements (Continued)
(Dollars in thousands, except per share data)
16. Information by Business Segment (Continued)
The following table reconciles our segment revenues to total revenues as reported on our Consolidated Statements of Operations:
| |
For the Years Ended December 31, |
|||||||||
|---|---|---|---|---|---|---|---|---|---|---|
| |
2007 |
2006 |
2005 |
|||||||
| Segment revenues | $ | 371,519 | $ | 305,792 | $ | 252,359 | ||||
| Construction contract revenues | 37,074 | 52,182 | 74,357 | |||||||
| Other service operations revenues | 4,151 | 7,902 | 4,877 | |||||||
| Less: Revenues from discontinued operations (Note 18) | (2,570 | ) | (12,214 | ) | (15,550 | ) | ||||
| Total revenues | $ | 410,174 | $ | 353,662 | $ | 316,043 | ||||
The following table reconciles our segment property operating expenses to property operating expenses as reported on our Consolidated Statements of Operations:
| |
For the Years Ended December 31, |
|||||||||
|---|---|---|---|---|---|---|---|---|---|---|
| |
2007 |
2006 |
2005 |
|||||||
| Segment property operating expenses | $ | 124,940 | $ | 96,033 | $ | 76,240 | ||||
| Less: Property expenses from discontinued real estate operations (Note 18) | (1,658 | ) | (3,126 | ) | (5,903 | ) | ||||
| Total property operating expenses | $ | 123,282 | $ | 92,907 | $ | 70,337 | ||||
F-47
Corporate Office Properties Trust and Subsidiaries
Notes to Consolidated Financial Statements (Continued)
(Dollars in thousands, except per share data)
16. Information by Business Segment (Continued)
The following table reconciles our NOI for reportable segments to income from continuing operations as reported on our Consolidated Statements of Operations:
| |
For the Years Ended December 31, |
||||||||||
|---|---|---|---|---|---|---|---|---|---|---|---|
| |
2007 |
2006 |
2005 |
||||||||
| NOI for reportable segments | $ | 246,579 | $ | 209,759 | $ | 176,119 | |||||
| Construction contract revenues | 37,074 | 52,182 | 74,357 | ||||||||
| Other service operations revenues | 4,151 | 7,902 | 4,877 | ||||||||
| Equity in loss of unconsolidated entities | (224 | ) | (92 | ) | (88 | ) | |||||
| Income tax expense | (569 | ) | (887 | ) | (668 | ) | |||||
| Other adjustments: | |||||||||||
| Depreciation and other amortization associated with real estate operations | (106,331 | ) | (78,054 | ) | (60,427 | ) | |||||
| Construction contract expenses | (35,723 | ) | (49,961 | ) | (72,534 | ) | |||||
| Other service operations expenses | (4,070 | ) | (7,384 | ) | (4,753 | ) | |||||
| General and administrative expenses | (20,523 | ) | (16,936 | ) | (13,533 | ) | |||||
| Interest expense on continuing operations | (82,032 | ) | (70,260 | ) | (53,906 | ) | |||||
| Gain on sale of non-real estate investment | 1,033 | — | — | ||||||||
| Amortization of deferred financing costs | (3,676 | ) | (2,847 | ) | (2,229 | ) | |||||
| Minority interests in continuing operations | (3,398 | ) | (3,826 | ) | (4,901 | ) | |||||
| NOI from discontinued operations | (912 | ) | (9,088 | ) | (9,647 | ) | |||||
| Income from continuing operations | $ | 31,379 | $ | 30,508 | $ | 32,667 | |||||
The accounting policies of the segments are the same as those previously disclosed for Corporate Office Properties Trust and subsidiaries, where applicable. We did not allocate interest expense, amortization of deferred financing costs and depreciation and other amortization to segments since they are not included in the measure of segment profit reviewed by management. We also did not allocate construction contract revenues, other service operations revenues, construction contract expenses, other service operations expenses, equity in loss of unconsolidated entities, general and administrative expense, income taxes and minority interests because these items represent general corporate items not attributable to segments.
17. Income Taxes
Corporate Office Properties Trust elected to be treated as a REIT under Sections 856 through 860 of the Internal Revenue Code. To qualify as a REIT, we must meet a number of organizational and operational requirements, including a requirement that we distribute at least 90% of our adjusted taxable income to our shareholders. As a REIT, we generally will not be subject to Federal income tax if we distribute at least 100% of our taxable income to our shareholders and satisfy certain other requirements (see discussion below). If we fail to qualify as a REIT in any tax year, we will be subject to Federal income tax on our taxable income at regular corporate rates and may not be able to qualify as a REIT for four subsequent tax years.
F-48
Corporate Office Properties Trust and Subsidiaries
Notes to Consolidated Financial Statements (Continued)
(Dollars in thousands, except per share data)
17. Income Taxes (Continued)
The differences between taxable income reported on our income tax return (estimated 2007 and actual 2006 and 2005) and net income as reported on our Consolidated Statements of Operations are set forth below:
| |
For the Years Ended December 31, |
||||||||||
|---|---|---|---|---|---|---|---|---|---|---|---|
| |
2007 |
2006 |
2005 |
||||||||
| |
(Estimated) |
|
|
||||||||
| Net income | $ | 34,784 | $ | 49,227 | $ | 39,031 | |||||
| Adjustments: | |||||||||||
| Rental revenue recognition | (6,102 | ) | (8,186 | ) | (7,225 | ) | |||||
| Compensation expense recognition | (18,986 | ) | (17,079 | ) | (5,068 | ) | |||||
| Operating expense recognition | 194 | (118 | ) | (68 | ) | ||||||
| Gain on sales of properties | 6,451 | (10,690 | ) | 7,174 | |||||||
| Losses from service operations | (844 | ) | (1,401 | ) | (1,780 | ) | |||||
| Income tax expense | 569 | 887 | 699 | ||||||||
| Depreciation and amortization | 44,337 | 26,554 | 18,668 | ||||||||
| Earnings from unconsolidated real estate joint ventures | 342 | 709 | 307 | ||||||||
| Minority interests, gross | (1,350 | ) | 1,862 | (4,828 | ) | ||||||
| Other | (166 | ) | (191 | ) | (737 | ) | |||||
| Taxable income | $ | 59,229 | $ | 41,574 | $ | 46,173 | |||||
For Federal income tax purposes, dividends to shareholders may be characterized as ordinary income, capital gains or return of capital. The characterization of dividends declared on our common and preferred shares during each of the last three years was as follows:
| |
Common Shares |
Preferred Shares |
|||||||||||
|---|---|---|---|---|---|---|---|---|---|---|---|---|---|
| |
For the Years Ended December 31, |
For the Years Ended December 31, |
|||||||||||
| |
2007 |
2006 |
2005 |
2007 |
2006 |
2005 |
|||||||
| Ordinary income | 59.5 | % | 50.3 | % | 70.7 | % | 78.4 | % | 87.4 | % | 79.9 | % | |
| Long term capital gain | 16.4 | % | 7.2 | % | 17.8 | % | 21.6 | % | 12.6 | % | 20.1 | % | |
| Return of capital | 24.1 | % | 42.5 | % | 11.5 | % | 0.0 | % | 0.0 | % | 0.0 | % | |
We distributed all of our REIT taxable income in 2007, 2006 and 2005 and, as a result, did not incur Federal income tax in those years on such income. However, we did incur income tax totaling $1,112 in 2007 on built-in gain on properties, which is included in the Consolidated Statements of Operations as follows: $1,068 in gain in sales of real estate, net of minority interests and income taxes; and $44 in discontinued operations net of minority interests and income taxes.
F-49
Corporate Office Properties Trust and Subsidiaries
Notes to Consolidated Financial Statements (Continued)
(Dollars in thousands, except per share data)
17. Income Taxes (Continued)
COMI is subject to Federal and state income taxes. COMI had income before income taxes under GAAP of $1,476 in 2007, $2,288 in 2006 and $1,780 in 2005. COMI's provision for income tax consisted of the following:
| |
For the Years Ended December 31, |
|||||||||
|---|---|---|---|---|---|---|---|---|---|---|
| |
2007 |
2006 |
2005 |
|||||||
| Deferred | ||||||||||
| Federal | $ | 468 | $ | 641 | $ | 572 | ||||
| State | 104 | 141 | 127 | |||||||
| 572 | 782 | 699 | ||||||||
| Current | ||||||||||
| Federal | — | 86 | — | |||||||
| State | — | 19 | — | |||||||
| — | 105 | — | ||||||||
| Total | $ | 572 | $ | 887 | $ | 699 | ||||
A reconciliation of COMI's Federal statutory rate to the effective tax rate for income tax reported on our Statements of Operations is set forth below:
| |
For the Years Ended December 31, |
||||||
|---|---|---|---|---|---|---|---|
| |
2007 |
2006 |
2005 |
||||
| Income taxes at U.S. statutory rate | 34.0 | % | 34.0 | % | 34.0 | % | |
| State and local, net of U.S. Federal tax benefit | 4.6 | % | 4.6 | % | 4.7 | % | |
| Other | 0.1 | % | 0.2 | % | 0.6 | % | |
| Effective tax rate | 38.7 | % | 38.8 | % | 39.3 | % | |
Items contributing to temporary differences that lead to deferred taxes include net operating losses that are not deductible until future periods, depreciation and amortization, share-based compensation, certain accrued compensation and compensation paid in the form of contributions to a deferred nonqualified compensation plan. COMI had a net operating loss carryforward for income taxes of approximately $1,062 at December 31, 2007.
We are subject to certain state and local income and franchise taxes. The expense associated with these state and local taxes is included in general and administrative expense on our Consolidated Statements of Operations. We did not separately state these amounts on our Consolidated Statements of Operations because they are insignificant.
F-50
Corporate Office Properties Trust and Subsidiaries
Notes to Consolidated Financial Statements (Continued)
(Dollars in thousands, except per share data)
18. Discontinued Operations
Income from discontinued operations includes revenues and expenses associated with the following:
Certain reclassifications have been made in prior periods to reflect discontinued operations consistent with the current period presentation. The table below sets forth the components of income from discontinued operations:
| |
For the Years Ended December 31, |
|||||||||||
|---|---|---|---|---|---|---|---|---|---|---|---|---|
| |
2007 |
2006 |
2005 |
|||||||||
| Revenue from real estate operations | $ | 2,570 | $ | 12,214 | $ | 15,550 | ||||||
| Expenses from real estate operations: | ||||||||||||
| Property operating expenses | 1,658 | 3,126 | 5,903 | |||||||||
| Depreciation and amortization | 1,294 | 2,020 | 3,128 | |||||||||
| Interest expense | 1,250 | 2,160 | 3,238 | |||||||||
| Other | 5 | 135 | 12 | |||||||||
| Expenses from real estate operations | 4,207 | 7,441 | 12,281 | |||||||||
| Income from discontinued operations before gain on sales of real estate and minority interests | (1,637 | ) | 4,773 | 3,269 | ||||||||
| Gain on sales of real estate | 3,871 | 17,031 | 4,324 | |||||||||
| Income taxes | (44 | ) | — | — | ||||||||
| Minority interests in discontinued operations | (345 | ) | (3,817 | ) | (1,497 | ) | ||||||
| Income from discontinued operations, net of minority interests | $ | 1,845 | $ | 17,987 | $ | 6,096 | ||||||
F-51
Corporate Office Properties Trust and Subsidiaries
Notes to Consolidated Financial Statements (Continued)
(Dollars in thousands, except per share data)
19. Commitments and Contingencies
In the normal course of business, we are involved in legal actions arising from our ownership and administration of properties. Management does not anticipate that any liabilities that may result will have a materially adverse effect on our financial position, operations or liquidity. We are subject to various Federal, state and local environmental regulations related to our property ownership and operation. We have performed environmental assessments of our properties, the results of which have not revealed any environmental liability that we believe would have a materially adverse effect on our financial position, operations or liquidity.
Acquisitions
As of December 31, 2007, we were under contract to acquire a parcel of land in Frederick, Maryland for an expected purchase price of $11,125, on which we had paid a deposit of $80.
We were also obligated to make an additional cash payment of up to $4,000 in a future year in connection with our acquisition of the land at the former Fort Ritchie United States Army base in Cascade, Washington County, Maryland. This payment could be reduced by a range of $750 to the full $4,000 depending on (1) defined levels of job creation resulting from the future development of the property taking place and (2) future real estate taxes generated by the property.
Dispositions
As of December 31, 2007, we were under contract to sell five condominium units within the building that was constructed by 13849 Park Center Road, LLC for an aggregate purchase price of $7,475. These sales were completed in January and February 2008.
Joint Ventures
As part of our obligations under the partnership agreement of Harrisburg Corporate Gateway Partners, LP, we agreed to indemnify the partnership's lender for 80% of losses under standard nonrecourse loan guarantees (environmental indemnifications and guarantees against fraud and misrepresentation) during the period of time in which we manage the partnership's properties; we do not expect to incur any losses under these loan guarantees.
We are party to a contribution agreement that formed a joint venture relationship with a limited partnership to develop up to 1.8 million square feet of office space on 63 acres of land located in Hanover, Maryland. Under the contribution agreement, we agreed to fund up to $2,200 in pre-construction costs associated with the property. As we and the joint venture partner agree to proceed with the construction of buildings in the future, our joint venture partner would contribute land into newly-formed entities and we would make additional cash capital contributions into such entities to fund development and construction activities for which financing is not obtained. As discussed in Note 5, we obtained a 50% interest in one such joint venture in July 2007.
We may be required to make our pro rata share of additional investments in our real estate joint ventures (generally based on our percentage ownership) in the event that additional funds are needed. In the event that the other members of these joint ventures do not pay their share of investments when additional funds are needed, we may then deem it appropriate to make even larger investments in these joint ventures.
F-52
Corporate Office Properties Trust and Subsidiaries
Notes to Consolidated Financial Statements (Continued)
(Dollars in thousands, except per share data)
19. Commitments and Contingencies (Continued)
In one of the consolidated joint ventures that we owned as of December 31, 2007, we would be obligated to acquire the other member's 50% interest in the joint venture if defined events were to occur. The amount we would need to pay for that membership interest is computed based on the amount that the owner of the interest would receive under the joint venture agreement in the event that office properties owned by the joint venture was sold for a capitalized fair value (as defined in the agreement) on a defined date. We estimate the aggregate amount we would need to pay for the other member's membership interest in this joint venture to be $718; however, since the determination of this amount is dependent on the operations of the office property, which is not both completed and sufficiently occupied, this estimate is preliminary and could be materially different from the actual obligation.
Office Space Operating Leases
We are obligated as lessee under five operating leases for office space. Future minimum rental payments due under the terms of these leases as of December 31, 2007 follow:
| 2008 | $ | 261 | |
| 2009 | 176 | ||
| 2010 | 135 | ||
| 2011 | 57 | ||
| $ | 629 | ||
Other Operating Leases
We are obligated under various leases for vehicles and office equipment. Future minimum rental payments due under the terms of these leases as of December 31, 2007 follow:
| 2008 | $ | 507 | |
| 2009 | 363 | ||
| 2010 | 177 | ||
| 2011 | 42 | ||
| $ | 1,089 | ||
Environmental Indemnity Agreement
We agreed to provide certain environmental indemnifications in connection with a lease of three properties in our New Jersey region. The prior owner of the properties, a Fortune 100 company which is responsible for groundwater contamination at such properties, previously agreed to indemnify us for (1) direct losses incurred in connection with the contamination and (2) its failure to perform
F-53
Corporate Office Properties Trust and Subsidiaries
Notes to Consolidated Financial Statements (Continued)
(Dollars in thousands, except per share data)
19. Commitments and Contingencies (Continued)
remediation activities required by the State of New Jersey, up to the point that the state declares the remediation to be complete. Under the lease agreement, we agreed to the following:
F-54
Corporate Office Properties Trust and Subsidiaries
Notes to Consolidated Financial Statements (Continued)
(Dollars in thousands, except per share data)
20. Quarterly data (Unaudited)
The tables below set forth selected quarterly information for the years ended December 31, 2007 and 2006. Certain of the amounts below have been reclassified to conform to our current presentation of discontinued operations, which is discussed in Note 18.
| |
For the Year Ended December 31, 2007 |
|||||||||||||
|---|---|---|---|---|---|---|---|---|---|---|---|---|---|---|
| |
First Quarter |
Second Quarter |
Third Quarter |
Fourth Quarter |
||||||||||
| Revenues | $ | 99,214 | $ | 102,335 | $ | 105,333 | $ | 103,292 | ||||||
| Operating income | $ | 26,805 | $ | 29,772 | $ | 31,553 | $ | 32,115 | ||||||
| Income from continuing operations | $ | 5,504 | $ | 8,227 | $ | 8,448 | $ | 9,200 | ||||||
| Income from discontinued operations | $ | 43 | $ | (511 | ) | $ | 1,945 | $ | 368 | |||||
| Net income | $ | 5,547 | $ | 7,877 | $ | 11,431 | $ | 9,929 | ||||||
| Preferred share dividends | (3,993 | ) | (4,025 | ) | (4,025 | ) | (4,025 | ) | ||||||
| Net income available to common shareholders | $ | 1,554 | $ | 3,852 | $ | 7,406 | $ | 5,904 | ||||||
| Basic earnings per share: | ||||||||||||||
| Income from continuing operations | $ | 0.03 | $ | 0.09 | $ | 0.12 | $ | 0.12 | ||||||
| Net income available to common shareholders | $ | 0.03 | $ | 0.08 | $ | 0.16 | $ | 0.13 | ||||||
| Diluted earnings per share: | ||||||||||||||
| Income from continuing operations | $ | 0.03 | $ | 0.09 | $ | 0.11 | $ | 0.12 | ||||||
| Net income available to common shareholders | $ | 0.03 | $ | 0.08 | $ | 0.15 | $ | 0.12 | ||||||
| |
For the Year Ended December 31, 2006 |
|||||||||||||
|---|---|---|---|---|---|---|---|---|---|---|---|---|---|---|
| |
First Quarter |
Second Quarter |
Third Quarter |
Fourth Quarter |
||||||||||
| Revenues | $ | 85,135 | $ | 84,532 | $ | 91,660 | $ | 92,335 | ||||||
| Operating income | $ | 25,933 | $ | 27,796 | $ | 26,981 | $ | 27,710 | ||||||
| Income from continuing operations | $ | 7,277 | $ | 8,701 | $ | 7,507 | $ | 7,023 | ||||||
| Income from discontinued operations | $ | 2,550 | $ | 390 | $ | 12,483 | $ | 2,564 | ||||||
| Net income | $ | 9,937 | $ | 9,116 | $ | 20,587 | $ | 9,587 | ||||||
| Preferred share dividends | (3,654 | ) | (3,653 | ) | (4,307 | ) | (3,790 | ) | ||||||
| Issuance costs associated with redeemed preferred shares | — | — | (1,829 | ) | (2,067 | ) | ||||||||
| Net income available to common shareholders | $ | 6,283 | $ | 5,463 | $ | 14,451 | $ | 3,730 | ||||||
| Basic earnings per share: | ||||||||||||||
| Income from continuing operations | $ | 0.09 | $ | 0.12 | $ | 0.05 | $ | 0.03 | ||||||
| Net income available to common shareholders | $ | 0.16 | $ | 0.13 | $ | 0.34 | $ | 0.09 | ||||||
| Diluted earnings per share: | ||||||||||||||
| Income from continuing operations | $ | 0.09 | $ | 0.12 | $ | 0.04 | $ | 0.03 | ||||||
| Net income available to common shareholders | $ | 0.15 | $ | 0.13 | $ | 0.33 | $ | 0.08 | ||||||
F-55
Corporate Office Properties Trust and Subsidiaries
Notes to Consolidated Financial Statements (Continued)
(Dollars in thousands, except per share data)
21. Pro Forma Financial Information (Unaudited)
We accounted for our acquisitions using the purchase method of accounting. We included the results of operations for our acquisitions in our Consolidated Statements of Operations from their respective purchase dates through December 31, 2007.
We prepared our pro forma condensed consolidated financial information presented below as if the Nottingham Acquisition that took place in 2007 had occurred at the beginning of the respective periods. The pro forma financial information is unaudited and is not necessarily indicative of the results that actually would have occurred if these acquisitions and dispositions had occurred at the beginning of the respective periods, nor does it purport to indicate our results of operations for future periods.
| |
For the Years Ended December 31, |
||||||
|---|---|---|---|---|---|---|---|
| |
2007 |
2006 |
|||||
| Pro forma total revenues | $ | 410,993 | $ | 387,284 | |||
| Pro forma net income | $ | 35,050 | $ | 43,621 | |||
| Pro forma net income available to common shareholders | $ | 18,949 | $ | 22,833 | |||
| Pro forma earnings per common share on net income available to common shareholders | |||||||
| Basic | $ | 0.41 | $ | 0.51 | |||
| Diluted | $ | 0.40 | $ | 0.49 | |||
22. Subsequent Events
On January 29, 2008, we completed the formation of M Square Associates, LLC, a consolidated joint venture in which we hold a 45% equity interest. This joint venture will own, develop and manage office properties, approved for up to approximately 750,000 square feet, located in M Square Research Park in College Park, Maryland. This joint venture had construction underway on a 118,107 square foot property within M Square Research Park.
On January 29, 2008, we had a 59,763 square foot property in Colorado Springs that was 100% pre-leased become fully operational.
On January 31, 2008, we completed the sale of the 429 Ridge Road property in our Northern/Central New Jersey region for $17,000.
F-56
Corporate Office Properties Trust
Schedule III—Real Estate Depreciation and Amortization
December 31, 2007
(Dollars in thousands)
| |
|
|
|
Initial Cost |
|
|
|
|
|
|
||||||||||||||||||
|---|---|---|---|---|---|---|---|---|---|---|---|---|---|---|---|---|---|---|---|---|---|---|---|---|---|---|---|---|
| |
|
|
|
Costs Capitalized Subsequent to Acquisition |
|
|
|
|
|
|||||||||||||||||||
| Property |
Location |
Building Type |
Encumbrances(1) |
Land |
Building and Land Improvements |
Gross Amounts Carried at Close of Period(7) |
Accumulated Depreciation |
Year Built or Renovated |
Date Acquired |
Depreciation Life |
||||||||||||||||||
| 751, 753 760, 785 Jolly Road | Blue Bell, PA | Office | $ | — | $ | 25,374 | $ | 91,290 | $ | 5 | $ | 116,669 | $ | (22,553 | ) | 1966/1996 | 10/14/1997 | 40 Years | ||||||||||
| 13200 Woodland Park Drive | Herndon, VA | Office | 70,646 | 10,428 | 49,476 | 13,345 | 73,249 | (15,614 | ) | 2002 | 6/2/2003 | 40 Years | ||||||||||||||||
| 7125 Columbia Gateway Drive | Columbia, MD | Office | 37,172 | 20,487 | 46,994 | 1,083 | 68,564 | (2,315 | ) | 1973/1999 | 6/29/2006 | 40 Years | ||||||||||||||||
| 1751 Pinnacle Drive | McLean, VA | Office | 33,982 | 10,486 | 43,013 | 9,485 | 62,984 | (5,540 | ) | 1989/1985 | 9/23/2004 | 40 Years | ||||||||||||||||
| 15000 Conference Center Drive | Chantilly,VA | Office | 54,000 | 5,193 | 47,526 | 4,527 | 57,246 | (10,398 | ) | 1989 | 11/30/2001 | 40 Years | ||||||||||||||||
| 11751 Meadowville Lane | Richmond, VA | Office | 44,000 | 1,305 | 52,200 | — | 53,505 | (751 | ) | 2007 | 9/15/2006 | 40 Years | ||||||||||||||||
| 1753 Pinnacle Drive | McLean, VA | Office | 27,077 | 8,275 | 34,353 | 6,967 | 49,595 | (3,641 | ) | 1976/2004 | 9/23/2004 | 40 Years | ||||||||||||||||
| 15010 Conference Center Drive | Chantilly,VA | Office | 96,000 | 3,500 | 42,233 | 11 | 45,744 | (1,233 | ) | 2006 | 11/30/2001 | 40 Years | ||||||||||||||||
| 2730 Hercules Road | Annapolis Junction, MD | Office | 21,946 | 8,737 | 31,612 | 28 | 40,377 | (7,314 | ) | 1990 | 9/28/1998 | 40 Years | ||||||||||||||||
| 8611 Military Drive | San Antonio, TX | Office | — | 14,020 | 24,043 | 7 | 38,070 | (1,325 | ) | 1982/1985 | 3/30/2005 | 40 Years | ||||||||||||||||
| 2720 Technology Drive | Annapolis Junction, MD | Office | — | 3,863 | 29,279 | 35 | 33,177 | (2,437 | ) | 2004 | 1/31/2002 | 40 Years | ||||||||||||||||
| 322 Sentinel Drive | Annapolis Junction, MD | Office | — | 2,605 | 27,839 | — | 30,444 | (608 | ) | 2006 | 11/14/2003 | 40 Years | ||||||||||||||||
| 318 Sentinel Drive | Annapolis Junction, MD | Office | — | 2,185 | 27,667 | — | 29,852 | (1,308 | ) | 2005 | 11/14/2003 | 40 Years | ||||||||||||||||
| 302 Sentinel Drive | Annapolis Junction, MD | Office | 22,506 | 2,648 | 26,892 | 5 | 29,545 | (79 | ) | 2007 | 11/14/2003 | 40 Years | ||||||||||||||||
| 201 Technology Park Drive | Lebanon, VA | Office | — | 727 | 27,909 | — | 28,636 | (178 | ) | 2007 | 10/5/2007 | 40 Years | ||||||||||||||||
| Clarks 100 | Annapolis Junction, MD | Office | — | 25,184 | 3,192 | — | 28,376 | — | (2) | 6/29/2003 | N/A | |||||||||||||||||
| 140 National Business Parkway | Annapolis Junction, MD | Office | — | 3,407 | 24,167 | 631 | 28,205 | (2,327 | ) | 2003 | 12/31/2003 | 40 Years | ||||||||||||||||
| 304 Sentinel Drive | Annapolis Junction, MD | Office | 37,280 | 3,411 | 24,066 | 17 | 27,494 | (1,165 | ) | 2006 | 11/14/2003 | 40 Years | ||||||||||||||||
| 11800 Tech Road | Silver Spring, MD | Office | 17,563 | 4,574 | 19,849 | 2,140 | 26,563 | (4,171 | ) | 1969/1989 | 8/1/2002 | 40 Years | ||||||||||||||||
| 11311 McCormick Road | Hunt Valley, MD | Office | — | 2,308 | 21,364 | 1,373 | 25,045 | (1,421 | ) | 1984/1994 | 12/22/2005 | 40 Years | ||||||||||||||||
| 15049 Conference Center Drive | Chantilly,VA | Office | 13,669 | 4,415 | 20,489 | 14 | 24,918 | (3,715 | ) | 1997 | 8/14/2002 | 40 Years | ||||||||||||||||
| 7468 Candlewood Road | Hanover, MD | Office | — | 5,599 | 19,142 | — | 24,741 | — | 1979/1982(2) | 12/20/2005 | N/A | |||||||||||||||||
| 6711 Columbia Gateway Drive | Columbia, MD | Office | 19,500 | 2,683 | 22,016 | 25 | 24,724 | (577 | ) | 2006 | 9/28/2000 | 40 Years | ||||||||||||||||
| 306 Sentinel Drive | Annapolis Junction, MD | Office | — | 3,260 | 20,901 | 21 | 24,182 | (730 | ) | 2006 | 11/14/2003 | 40 Years | ||||||||||||||||
| 2711 Technology Drive | Annapolis Junction, MD | Office | 17,343 | 2,251 | 21,646 | 7 | 23,904 | (4,059 | ) | 2002 | 11/13/2000 | 40 Years | ||||||||||||||||
| 2900 Towerview Road | Herndon, VA | Office | — | 4,468 | 17,454 | 1,401 | 23,323 | (752 | ) | 1982(2) | 12/20/2005 | 40 Years | ||||||||||||||||
| 7740 Milestone Parkway | Hanover, MD | Office | — | 3,825 | 18,228 | — | 22,053 | — | (2) | 7/2/2007 | N/A | |||||||||||||||||
| 6731 Columbia Gateway Drive | Columbia, MD | Office | — | 2,807 | 18,986 | 205 | 21,998 | (3,061 | ) | 2002 | 3/29/2000 | 40 Years | ||||||||||||||||
| 400 Professional Drive | Gaithersburg, MD | Office | 15,943 | 3,673 | 17,399 | 894 | 21,966 | (3,665 | ) | 2000 | 3/5/2004 | 40 Years | ||||||||||||||||
| 320 Sentinel Drive | Annapolis Junction, MD | Office | 18,083 | 2,068 | 19,877 | — | 21,945 | (42 | ) | 2007 | 11/14/2003 | 40 Years | ||||||||||||||||
| 7200 Riverwood Drive | Columbia, MD | Office | 15,499 | 4,089 | 16,356 | 1,063 | 21,508 | (4,032 | ) | 1986 | 10/13/1998 | 40 Years | ||||||||||||||||
| Interquest Land Parcel | Colorado Springs, CO | Office | — | 19,400 | 2,051 | — | 21,451 | — | (2) | 9/30/2005 | N/A | |||||||||||||||||
| 431 Ridge Road | Dayton, NJ | Office | — | 2,782 | 11,128 | 7,323 | 21,233 | (5,485 | ) | 1958/1998 | 10/14/1997 | 40 Years | ||||||||||||||||
| 9690 Deereco Road | Timonium, MD | Office | 8,529 | 3,415 | 13,723 | 3,431 | 20,569 | (4,543 | ) | 1988 | 12/21/1999 | 40 Years | ||||||||||||||||
| 14280 Park Meadow Drive | Chantilly,VA | Office | 9,194 | 3,731 | 16,140 | 298 | 20,169 | (1,930 | ) | 1999 | 9/29/2004 | 40 Years | ||||||||||||||||
F-57
| |
|
|
|
Initial Cost |
|
|
|
|
|
|
||||||||||||
|---|---|---|---|---|---|---|---|---|---|---|---|---|---|---|---|---|---|---|---|---|---|---|
| |
|
|
|
Costs Capitalized Subsequent to Acquisition |
|
|
|
|
|
|||||||||||||
| Property |
Location |
Building Type |
Encumbrances(1) |
Land |
Building and Land Improvements |
Gross Amounts Carried at Close of Period(7) |
Accumulated Depreciation |
Year Built or Renovated |
Date Acquired |
Depreciation Life |
||||||||||||
| 15059 Conference Center Drive | Chantilly,VA | Office | 23,078 | 5,753 | 13,816 | 584 | 20,153 | (3,012 | ) | 2000 | 8/14/2002 | 40 Years | ||||||||||
| 10150 York Road | Hunt Valley, MD | Office | — | 2,700 | 11,731 | 5,358 | 19,789 | (2,914 | ) | 1985 | 4/15/2004 | 40 Years | ||||||||||
| 14900 Conference Center Drive | Chantilly,VA | Office | 14,199 | 3,436 | 14,895 | 1,370 | 19,701 | (2,811 | ) | 1999 | 7/25/2003 | 40 Years | ||||||||||
| 15 West Gude Drive | Rockville, MD | Office | — | 3,120 | 13,658 | 2,892 | 19,670 | (1,307 | ) | 1986 | 4/7/2005 | 40 Years | ||||||||||
| 2691 Technology Drive | Annapolis Junction, MD | Office | 24,000 | 2,098 | 17,342 | 5 | 19,445 | (966 | ) | 2005 | 11/14/2003 | 40 Years | ||||||||||
| 2721 Technology Drive | Annapolis Junction, MD | Office | 12,831 | 4,611 | 14,602 | 12 | 19,225 | (2,842 | ) | 2000 | 10/21/1999 | 40 Years | ||||||||||
| 870 - 880 Elkridge Landing Road | Linthicum, MD | Office | 15,438 | 2,003 | 10,403 | 6,430 | 18,836 | (4,998 | ) | 1981 | 8/3/2001 | 40 Years | ||||||||||
| 6950 Columbia Gateway Drive | Columbia, MD | Office | 9,717 | 3,596 | 14,269 | 936 | 18,801 | (3,590 | ) | 1998 | 10/21/1998 | 40 Years | ||||||||||
| 45 West Gude Drive | Rockville, MD | Office | — | 3,102 | 15,267 | 36 | 18,405 | (1,551 | ) | 1987 | 4/7/2005 | 40 Years | ||||||||||
| 429 Ridge Road | Dayton, NJ | Office | — | 2,932 | 11,729 | 3,274 | 17,935 | (2,946 | ) | 1966/1996 | 10/14/1997 | 40 Years | ||||||||||
| 2701 Technology Drive | Annapolis Junction, MD | Office | 13,207 | 1,737 | 15,266 | 11 | 17,014 | (3,052 | ) | 2001 | 5/26/2000 | 40 Years | ||||||||||
| 132 National Business Parkway | Annapolis Junction, MD | Office | 10,255 | 2,917 | 12,438 | 1,501 | 16,856 | (3,861 | ) | 2000 | 5/28/1997 | 40 Years | ||||||||||
| 13454 Sunrise Valley Drive | Herndon, VA | Office | 11,422 | 2,899 | 12,202 | 1,019 | 16,120 | (2,167 | ) | 1998 | 7/25/2003 | 40 Years | ||||||||||
| 133 National Business Parkway | Annapolis Junction, MD | Office | 6,935 | 2,517 | 10,234 | 3,367 | 16,118 | (3,091 | ) | 1997 | 9/28/1998 | 40 Years | ||||||||||
| 10001 Franklin Square Drive | White Marsh, MD | Office | — | 4,033 | 11,483 | 550 | 16,066 | (368 | ) | 1997 | 1/9/2007 | 40 Years | ||||||||||
| 7000 Columbia Gateway Drive | Columbia, MD | Office | 18,958 | 3,131 | 12,103 | 27 | 15,261 | (1,651 | ) | 1999 | 5/31/2002 | 40 Years | ||||||||||
| 110 Thomas Johnson Drive | Frederick, MD | Office | — | 2,810 | 12,075 | 281 | 15,166 | (683 | ) | 1987/1999 | 10/21/2005 | 40 Years | ||||||||||
| 1306 Concourse Drive | Linthicum, MD | Office | 9,151 | 2,796 | 11,186 | 1,117 | 15,099 | (2,876 | ) | 1990 | 11/18/1999 | 40 Years | ||||||||||
| 2500 Riva Rd | Annapolis, MD | Office | 12,545 | 2,791 | 12,185 | — | 14,976 | (1,664 | ) | 2000 | 3/4/2003 | 40 Years | ||||||||||
| 1304 Concourse Drive | Linthicum, MD | Office | 10,551 | 1,999 | 12,934 | 28 | 14,961 | (2,276 | ) | 2002 | 11/18/1999 | 40 Years | ||||||||||
| 6940 Columbia Gateway Drive | Columbia, MD | Office | 16,752 | 3,545 | 9,916 | 1,377 | 14,838 | (2,891 | ) | 1999 | 11/13/1998 | 40 Years | ||||||||||
| 8621 Robert Fulton Drive | Columbia, MD | Office | 18,235 | 2,317 | 12,336 | 57 | 14,710 | (613 | ) | 2005 | 6/10/2005 | 40 Years | ||||||||||
| 5725 Mark Dabling Blvd | Colorado Springs, CO | Office | 12,882 | 900 | 11,397 | 2,104 | 14,401 | (955 | ) | 1984 | 5/18/2006 | 40 Years | ||||||||||
| Fort Ritchie | Washington County, MD | Mixed-Use | — | 4,798 | 9,522 | 79 | 14,399 | (16 | ) | Various(2)(6) | 10/5/2006 | Various(6) | ||||||||||
| 6750 Alexander Bell Drive | Columbia, MD | Office | 8,136 | 1,263 | 12,460 | 597 | 14,320 | (3,235 | ) | 2000 | 12/31/1998 | 40 Years | ||||||||||
| 200 International Circle | Hunt Valley, MD | Office | — | 2,016 | 10,851 | 1,317 | 14,184 | (683 | ) | 1987 | 12/22/2005 | 40 Years | ||||||||||
| 7067 Columbia Gateway Drive | Columbia, MD | Office | 8,516 | 1,829 | 11,823 | 349 | 14,001 | (1,854 | ) | 2001 | 8/30/2001 | 40 Years | ||||||||||
| 375 West Padonia Road | Timonium, MD | Office | — | 2,483 | 10,448 | 895 | 13,826 | (2,456 | ) | 1986 | 12/21/1999 | 40 Years | ||||||||||
| 135 National Business Parkway | Annapolis Junction, MD | Office | 6,654 | 2,484 | 9,750 | 1,478 | 13,712 | (3,013 | ) | 1998 | 12/30/1998 | 40 Years | ||||||||||
| 5775 Mark Dabling Blvd | Colorado Springs, CO | Office | 12,477 | 1,035 | 12,440 | 188 | 13,663 | (1,081 | ) | 1984 | 5/18/2006 | 40 Years | ||||||||||
| 4851 Stonecroft Boulevard | Chantilly,VA | Office | 15,887 | 1,878 | 11,593 | 4 | 13,475 | (931 | ) | 2006 | 8/14/2002 | 40 Years | ||||||||||
| 985 Space Center Drive | Colorado Springs, CO | Office | — | 777 | 12,287 | 202 | 13,266 | (859 | ) | 1989 | 9/28/2005 | 40 Years | ||||||||||
| 141 National Business Parkway | Annapolis Junction, MD | Office | 6,521 | 2,398 | 9,590 | 934 | 12,922 | (2,527 | ) | 1990 | 9/28/1998 | 40 Years | ||||||||||
| Campbell Boulevard and Franklin Square | White Marsh, MD | Office | — | 12,024 | 852 | — | 12,876 | — | (2) | 1/9/2007 | N/A | |||||||||||
| 22309 Exploration Drive | Lexington Park, MD | Office | 1,154 | 2,243 | 10,419 | 121 | 12,783 | (1,465 | ) | 1984 | 3/24/2004 | 40 Years | ||||||||||
F-58
| |
|
|
|
Initial Cost |
|
|
|
|
|
|
||||||||||||
|---|---|---|---|---|---|---|---|---|---|---|---|---|---|---|---|---|---|---|---|---|---|---|
| |
|
|
|
Costs Capitalized Subsequent to Acquisition |
|
|
|
|
|
|||||||||||||
| Property |
Location |
Building Type |
Encumbrances(1) |
Land |
Building and Land Improvements |
Gross Amounts Carried at Close of Period(7) |
Accumulated Depreciation |
Year Built or Renovated |
Date Acquired |
Depreciation Life |
||||||||||||
| Gateway Exchange III | Columbia, MD | Office | — | 1,753 | 10,779 | — | 12,532 | — | (2) | 9/28/2000 | N/A | |||||||||||
| Patriot Park | Colorado Springs, CO | Office | — | 6,882 | 5,583 | — | 12,465 | — | (2) | 7/8/2005 | N/A | |||||||||||
| 8110 Corporate Drive | White Marsh, MD | Office | — | 2,285 | 10,117 | — | 12,402 | (366 | ) | 2001 | 1/9/2007 | 40 Years | ||||||||||
| 655 Space Center Drive | Colorado Springs, CO | Office | — | 745 | 11,623 | — | 12,368 | — | (2) | 7/8/2005 | N/A | |||||||||||
| 920 Elkridge Landing Road | Linthicum, MD | Office | 7,990 | 2,101 | 9,765 | 328 | 12,194 | (2,717 | ) | 1982 | 7/2/2001 | 40 Years | ||||||||||
| 226 Schilling Circle | Hunt Valley, MD | Office | — | 1,877 | 9,891 | 232 | 12,000 | (738 | ) | 1980 | 12/22/2005 | 40 Years | ||||||||||
| 5755 Mark Dabling Blvd | Colorado Springs, CO | Office | 10,208 | 799 | 10,324 | 754 | 11,877 | (654 | ) | 1989 | 5/18/2006 | 40 Years | ||||||||||
| 8140 Corporate Drive | White Marsh, MD | Office | — | 2,158 | 8,457 | 1,191 | 11,806 | (387 | ) | 2003 | 1/9/2007 | 40 Years | ||||||||||
| 134 National Business Parkway | Annapolis Junction, MD | Office | 13,938 | 3,684 | 7,516 | 577 | 11,777 | (2,092 | ) | 1999 | 11/13/1998 | 40 Years | ||||||||||
| 1302 Concourse Drive | Linthicum, MD | Office | 6,801 | 2,078 | 8,313 | 1,377 | 11,768 | (2,487 | ) | 1996 | 11/18/1999 | 40 Years | ||||||||||
| 900 Elkridge Landing Road | Linthicum, MD | Office | — | 1,993 | 7,972 | 1,438 | 11,403 | (2,691 | ) | 1982 | 4/30/1998 | 40 Years | ||||||||||
| Patriot Park Building 1 | Colorado Springs, CO | Office | — | 654 | 10,591 | — | 11,245 | (320 | ) | 2006 | 7/8/2005 | 40 Years | ||||||||||
| 6700 Alexander Bell Drive | Columbia, MD | Office | 4,000 | 1,755 | 7,019 | 2,458 | 11,232 | (2,350 | ) | 1988 | 5/14/2001 | 40 Years | ||||||||||
| 131 National Business Parkway | Annapolis Junction, MD | Office | 5,183 | 1,906 | 7,623 | 1,268 | 10,797 | (2,549 | ) | 1990 | 9/28/1998 | 40 Years | ||||||||||
| Northgate Business Park | Aberdeen, MD | Office | — | 10,409 | 320 | — | 10,729 | — | (2) | 9/14/2007 | N/A | |||||||||||
| 1055 North Newport Road | Colorado Springs, CO | Office | — | 972 | 9,753 | — | 10,725 | — | (2) | 5/19/2006 | N/A | |||||||||||
| 7160 Riverwood Drive | Columbia, MD | Office | — | 2,732 | 7,006 | 897 | 10,635 | (420 | ) | 2000 | 1/10/2007 | 40 Years | ||||||||||
| 1199 Winterson Road | Linthicum, MD | Office | 18,578 | 1,599 | 6,395 | 2,553 | 10,547 | (2,561 | ) | 1988 | 4/30/1998 | 40 Years | ||||||||||
| 14850 Conference Center Drive | Chantilly,VA | Office | 8,078 | 1,615 | 8,358 | 4 | 9,977 | (1,718 | ) | 2000 | 7/25/2003 | 40 Years | ||||||||||
| 1190 Winterson Road | Linthicum, MD | Office | 11,291 | 1,335 | 5,340 | 3,264 | 9,939 | (3,083 | ) | 1987 | 4/30/1998 | 40 Years | ||||||||||
| 999 Corporate Boulevard | Linthicum, MD | Office | 13,533 | 1,187 | 8,332 | 295 | 9,814 | (1,855 | ) | 2000 | 8/1/1999 | 40 Years | ||||||||||
| 14840 Conference Center Drive | Chantilly,VA | Office | 8,204 | 1,572 | 8,175 | 15 | 9,762 | (1,821 | ) | 2000 | 7/25/2003 | 40 Years | ||||||||||
| Waterview III | Herndon, VA | Office | — | 9,614 | 78 | — | 9,692 | — | (3) | 4/29/2004 | N/A | |||||||||||
| 6740 Alexander Bell Drive | Columbia, MD | Office | 4,221 | 1,424 | 5,696 | 2,515 | 9,635 | (2,256 | ) | 1992 | 12/31/1998 | 40 Years | ||||||||||
| Nottingham Ridge | White Marsh, MD | Office | — | 8,861 | 742 | — | 9,603 | — | (2) | 1/9/2007 | N/A | |||||||||||
| 8031 Corporate Drive | White Marsh, MD | Office | — | 2,548 | 6,976 | — | 9,524 | (245 | ) | 1988/2004 | 1/9/2007 | 40 Years | ||||||||||
| 16480 Commerce Dr | Dahlgren, VA | Office | — | 1,857 | 7,666 | — | 9,523 | (799 | ) | 2004 | 12/28/2004 | 40 Years | ||||||||||
| 9140 Route 108 | Columbia, MD | Office | — | 1,637 | 5,500 | 2,190 | 9,327 | (1,232 | ) | 1974/1985 | 12/14/2000 | 40 Years | ||||||||||
| 7467 Ridge Road | Hanover, MD | Office | 6,120 | 1,629 | 6,517 | 1,069 | 9,215 | (1,992 | ) | 1990 | 4/28/1999 | 40 Years | ||||||||||
| Columbia Gtwy T11 Lot 1 | Columbia, MD | Office | — | 6,387 | 2,719 | — | 9,106 | — | (2) | 9/20/2004 | N/A | |||||||||||
| 201 International Circle | Hunt Valley, MD | Office | — | 1,552 | 6,086 | 1,348 | 8,986 | (593 | ) | 1982 | 12/22/2005 | 40 Years | ||||||||||
| 9965 Federal Drive | Colorado Springs, CO | Office | — | 1,401 | 7,417 | 128 | 8,946 | (66 | ) | 1983(2) | 1/19/2006 | 40 Years | ||||||||||
| 7240 Parkway Drive | Hanover, MD | Office | 4,069 | 1,496 | 5,985 | 1,383 | 8,864 | (1,890 | ) | 1985 | 4/18/2000 | 40 Years | ||||||||||
| 849 International Drive | Linthicum, MD | Office | 11,692 | 1,356 | 5,426 | 1,990 | 8,772 | (2,242 | ) | 1988 | 2/23/1999 | 40 Years | ||||||||||
| 13450 Sunrise Valley Drive | Herndon, VA | Office | 5,679 | 1,386 | 5,576 | 1,777 | 8,739 | (1,090 | ) | 1998 | 7/25/2003 | 40 Years | ||||||||||
| Parcels 27 and 37A-Westfields Corporate Center | Chantilly,VA | Office | — | 7,141 | 1,261 | — | 8,402 | — | (3) | 1/27/2005 | N/A | |||||||||||
F-59
| |
|
|
|
Initial Cost |
|
|
|
|
|
|
||||||||||||
|---|---|---|---|---|---|---|---|---|---|---|---|---|---|---|---|---|---|---|---|---|---|---|
| |
|
|
|
Costs Capitalized Subsequent to Acquisition |
|
|
|
|
|
|||||||||||||
| Property |
Location |
Building Type |
Encumbrances(1) |
Land |
Building and Land Improvements |
Gross Amounts Carried at Close of Period(7) |
Accumulated Depreciation |
Year Built or Renovated |
Date Acquired |
Depreciation Life |
||||||||||||
| Lots 24R-27R & 31RR-32RR, National Business Parkway | Annapolis Junction, MD | Office | — | — | 8,340 | — | 8,340 | — | (2) | 11/14/2003 | N/A | |||||||||||
| 1099 Winterson Road | Linthicum, MD | Office | 12,012 | 1,323 | 5,293 | 1,649 | 8,265 | (1,863 | ) | 1988 | 4/30/1998 | 40 Years | ||||||||||
| 1362 Mellon Road | Hanover, MD | Office | — | 1,706 | 6,497 | — | 8,203 | — | (2) | 2/10/2006 | N/A | |||||||||||
| 7015 Albert Einstein Drive | Columbia, MD | Office | 3,605 | 2,058 | 6,093 | — | 8,151 | (775 | ) | 1999 | 12/1/2005 | 40 Years | ||||||||||
| 5520 Research Park Drive | Baltimore, MD | Office | — | 102 | 7,947 | — | 8,049 | — | (2) | 4/4/2006 | N/A | |||||||||||
| 502 Washington Avenue | Towson, MD | Office | 5,444 | 826 | 7,045 | 91 | 7,962 | (421 | ) | 1984 | 1/9/2007 | 40 Years | ||||||||||
| 6716 Alexander Bell Drive | Columbia, MD | Office | 3,683 | 1,242 | 4,969 | 1,723 | 7,934 | (2,183 | ) | 1990 | 12/31/1998 | 40 Years | ||||||||||
| 9910 Franklin Square Drive | White Marsh, MD | Office | 5,762 | 1,300 | 6,590 | — | 7,890 | (242 | ) | 2005 | 1/9/2007 | 40 Years | ||||||||||
| 46579 Expedition Drive | Lexington Park, MD | Office | 3,997 | 1,406 | 5,943 | 540 | 7,889 | (903 | ) | 2002 | 3/24/2004 | 40 Years | ||||||||||
| 1670 North Newport Road | Colorado Springs, CO | Office | 4,819 | 853 | 7,007 | — | 7,860 | (565 | ) | 1986/1987 | 9/30/2005 | 40 Years | ||||||||||
| 16539 & 16541 Commerce Drive | Dahlgren, VA | Office | — | 1,462 | 6,132 | 261 | 7,855 | (911 | ) | 2004 | 12/21/2004 | 40 Years | ||||||||||
| 7210 Ambassador Road | Woodlawn, MD | Office | — | 1,481 | 6,257 | 104 | 7,842 | (483 | ) | 1972 | 12/22/2005 | 40 Years | ||||||||||
| 7272 Park Circle Dr | Hanover, MD | Office | 5,863 | 1,479 | 6,310 | 48 | 7,837 | (235 | ) | 1991/1996 | 1/10/2007 | 40 Years | ||||||||||
| 911 Elkridge Landing Road | Linthicum, MD | Office | — | 1,215 | 4,861 | 1,605 | 7,681 | (1,728 | ) | 1985 | 4/30/1998 | 40 Years | ||||||||||
| 7152 Windsor Boulevard | Woodlawn, MD | Office | — | 879 | 6,764 | — | 7,643 | (352 | ) | 1985 | 12/22/2005 | 40 Years | ||||||||||
| 22289 Exploration Drive | Lexington Park, MD | Office | 3,884 | 1,422 | 5,719 | 408 | 7,549 | (672 | ) | 2000 | 3/24/2004 | 40 Years | ||||||||||
| San Antonio land parcel—31 acres | San Antonio, TX | Office | — | 7,430 | 85 | — | 7,515 | — | (3) | 1/20/2006 | N/A | |||||||||||
| 22299 Exploration Drive | Lexington Park, MD | Office | 3,571 | 1,362 | 5,814 | 293 | 7,469 | (878 | ) | 1998 | 3/24/2004 | 40 Years | ||||||||||
| 109-111 Allegheny Avenue | Towson, MD | Office | — | 1,688 | 5,620 | 51 | 7,359 | (164 | ) | 1971 | 1/9/2007 | 40 Years | ||||||||||
| 46591 Expedition Drive | Lexington Park, MD | Office | — | 1,200 | 6,085 | — | 7,285 | (189 | ) | 2002 | 3/24/2004 | 40 Years | ||||||||||
| 891 Elkridge Landing Road | Linthicum, MD | Office | 3,895 | 1,160 | 4,792 | 1,157 | 7,109 | (1,262 | ) | 1984 | 7/2/2001 | 40 Years | ||||||||||
| 44425 Pecan Court | California, MD | Office | — | 1,309 | 5,458 | 164 | 6,931 | (735 | ) | 1997 | 5/5/2004 | 40 Years | ||||||||||
| 1201 Winterson Road | Linthicum, MD | Office | — | 1,288 | 5,154 | 461 | 6,903 | (1,265 | ) | 1985 | 4/30/1998 | 40 Years | ||||||||||
| 8671 Robert Fulton Drive | Columbia, MD | Office | 7,465 | 1,718 | 4,280 | 881 | 6,879 | (810 | ) | 2003 | 12/30/2003 | 40 Years | ||||||||||
| 901 Elkridge Landing Road | Linthicum, MD | Office | 3,644 | 1,151 | 4,416 | 1,059 | 6,626 | (1,159 | ) | 1984 | 7/2/2001 | 40 Years | ||||||||||
| 7138 Columbia Gateway Drive | Columbia, MD | Office | 5,406 | 1,104 | 3,518 | 1,968 | 6,590 | (566 | ) | 1990 | 9/19/2005 | 40 Years | ||||||||||
| 9950 Federal Drive | Colorado Springs, CO | Office | 1,971 | 877 | 5,045 | 589 | 6,511 | (480 | ) | 2001 | 12/22/2005 | 40 Years | ||||||||||
| 9920 Franklin Square Drive | White Marsh, MD | Office | — | 1,109 | 5,293 | — | 6,402 | (170 | ) | 2006 | 1/9/2007 | 40 Years | ||||||||||
| 7130 Columbia Gateway Drive | Columbia, MD | Office | 6,519 | 1,350 | 4,412 | 448 | 6,210 | (403 | ) | 1989 | 9/19/2005 | 40 Years | ||||||||||
| 7150 Riverwood Drive | Columbia, MD | Office | — | 1,821 | 4,388 | — | 6,209 | (166 | ) | 2000 | 1/10/2007 | 40 Years | ||||||||||
| 22300 Exploration Drive | Lexington Park, MD | Office | — | 1,094 | 5,038 | 56 | 6,188 | (582 | ) | 1989 | 11/9/2004 | 40 Years | ||||||||||
| 4979 Mercantile Road | White Marsh, MD | Office | — | 1,388 | 4,783 | — | 6,171 | (163 | ) | 1985 | 1/9/2007 | 40 Years | ||||||||||
| 939 Elkridge Landing Road | Linthicum, MD | Office | — | 939 | 3,853 | 1,325 | 6,117 | (1,550 | ) | 1983 | 4/30/1998 | 40 Years | ||||||||||
| 300 Sentinel Drive | Annapolis Junction, MD | Office | — | 1,480 | 4,599 | — | 6,079 | — | (2) | 11/14/2003 | N/A | |||||||||||
| 6708 Alexander Bell Drive | Columbia, MD | Office | 6,320 | 897 | 3,588 | 1,579 | 6,064 | (1,115 | ) | 1988 | 5/14/2001 | 40 Years | ||||||||||
F-60
| |
|
|
|
Initial Cost |
|
|
|
|
|
|
||||||||||||
|---|---|---|---|---|---|---|---|---|---|---|---|---|---|---|---|---|---|---|---|---|---|---|
| |
|
|
|
Costs Capitalized Subsequent to Acquisition |
|
|
|
|
|
|||||||||||||
| Property |
Location |
Building Type |
Encumbrances(1) |
Land |
Building and Land Improvements |
Gross Amounts Carried at Close of Period(7) |
Accumulated Depreciation |
Year Built or Renovated |
Date Acquired |
Depreciation Life |
||||||||||||
| 938 Elkridge Landing Road | Linthicum, MD | Office | 4,436 | 1,204 | 4,727 | 126 | 6,057 | (794 | ) | 1984 | 7/2/2001 | 40 Years | ||||||||||
| 8114 Sandpiper Circle | White Marsh, MD | Office | — | 1,634 | 4,287 | 120 | 6,041 | (185 | ) | 1986 | 1/9/2007 | 40 Years | ||||||||||
| 8020 Corporate Drive | White Marsh, MD | Office | — | 2,184 | 3,818 | — | 6,002 | (144 | ) | 1997 | 1/9/2007 | 40 Years | ||||||||||
| 9020 Mendenhall Court | Columbia, MD | Office | — | 1,233 | 4,571 | 178 | 5,982 | (177 | ) | 1982/2005 | 1/9/2007 | 40 Years | ||||||||||
| 940 Elkridge Landing Road | Linthicum, MD | Office | 3,367 | 1,100 | 4,696 | 169 | 5,965 | (461 | ) | 1984(3) | 7/2/2001 | 40 Years | ||||||||||
| 881 Elkridge Landing Road | Linthicum, MD | Office | 11,812 | 1,034 | 4,137 | 742 | 5,913 | (1,188 | ) | 1986 | 4/30/1998 | 40 Years | ||||||||||
| San Antonio Land Parcel | San Antonio, TX | Office | — | 5,893 | 20 | — | 5,913 | — | (3) | 6/14/2005 | N/A | |||||||||||
| 7941-7949 Corporate Drive | White Marsh, MD | Office | — | 2,087 | 3,782 | — | 5,869 | (166 | ) | 1996 | 1/9/2007 | 40 Years | ||||||||||
| 7065 Columbia Gateway Drive | Columbia, MD | Office | 3,207 | 919 | 4,222 | 700 | 5,841 | (1,329 | ) | 2000 | 8/30/2001 | 40 Years | ||||||||||
| 8661 Robert Fulton Drive | Columbia, MD | Office | 6,564 | 1,510 | 3,764 | 562 | 5,836 | (638 | ) | 2003 | 12/30/2003 | 40 Years | ||||||||||
| 4969 Mercantile Road | White Marsh, MD | Office | — | 1,308 | 4,492 | — | 5,800 | (148 | ) | 1983 | 1/9/2007 | 40 Years | ||||||||||
| 7063 Columbia Gateway Drive | Columbia, MD | Office | 3,131 | 902 | 4,145 | 728 | 5,775 | (1,469 | ) | 2000 | 8/30/2001 | 40 Years | ||||||||||
| 921 Elkridge Landing Road | Linthicum, MD | Office | — | 1,044 | 4,176 | 532 | 5,752 | (1,384 | ) | 1983 | 4/30/1998 | 40 Years | ||||||||||
| 6760 Alexander Bell Drive | Columbia, MD | Office | 2,639 | 890 | 3,561 | 1,284 | 5,735 | (1,549 | ) | 1991 | 12/31/1998 | 40 Years | ||||||||||
| 8094 Sandpiper Circle | White Marsh, MD | Office | — | 1,960 | 3,742 | — | 5,702 | (169 | ) | 1998 | 1/9/2007 | 40 Years | ||||||||||
| 7142 Columbia Gateway Drive | Columbia, MD | Office | 6,280 | 1,342 | 4,252 | 99 | 5,693 | (502 | ) | 1994 | 9/19/2005 | 40 Years | ||||||||||
| 930 International Drive | Linthicum, MD | Office | 8,488 | 1,013 | 4,053 | 555 | 5,621 | (1,194 | ) | 1986 | 4/30/1998 | 40 Years | ||||||||||
| 6724 Alexander Bell Drive | Columbia, MD | Office | 10,939 | 449 | 5,039 | 48 | 5,536 | (944 | ) | 2002 | 5/14/2001 | 40 Years | ||||||||||
| 7318 Parkway Drive | Hanover, MD | Office | 3,651 | 972 | 3,888 | 656 | 5,516 | (919 | ) | 1984 | 4/16/1999 | 40 Years | ||||||||||
| 900 International Drive | Linthicum, MD | Office | 8,008 | 981 | 3,922 | 608 | 5,511 | (1,069 | ) | 1986 | 4/30/1998 | 40 Years | ||||||||||
| 8098 Sandpiper Circle | White Marsh, MD | Office | — | 1,797 | 3,698 | — | 5,495 | (136 | ) | 1998 | 1/9/2007 | 40 Years | ||||||||||
| Parcel 3-A, Westfields International Corporate Center | Chantilly,VA | Office | — | 3,609 | 1,801 | — | 5,410 | — | (3) | 7/31/2002 | N/A | |||||||||||
| 1340 Ashton Road | Hanover, MD | Office | 3,399 | 905 | 3,620 | 815 | 5,340 | (1,257 | ) | 1989 | 4/28/1999 | 40 Years | ||||||||||
| 5522 Research Park Drive | Catonsville,MD | Office | — | — | 5,323 | — | 5,323 | (46 | ) | (2) | 3/8/2006 | 40 Years | ||||||||||
| 4940 Campbell Boulevard | White Marsh, MD | Office | — | 1,379 | 3,902 | 6 | 5,287 | (178 | ) | 1990 | 1/9/2007 | 40 Years | ||||||||||
| 9720 Patuxent Woods | Columbia, MD | Office | 2,902 | 1,701 | 3,509 | — | 5,210 | (171 | ) | 1986/2001 | 1/9/2007 | 40 Years | ||||||||||
| 11011 McCormick Road | Hunt Valley, MD | Office | — | 875 | 3,474 | 840 | 5,189 | (291 | ) | 1974 | 12/22/2005 | 40 Years | ||||||||||
| 7320 Parkway Drive | Hanover, MD | Office | 5,650 | 905 | 3,635 | 579 | 5,119 | (895 | ) | 1983 | 4/4/2002 | 40 Years | ||||||||||
| 5325 Nottingham Ridge Road | White Marsh, MD | Office | — | 816 | 4,246 | 54 | 5,116 | (378 | ) | 2002 | 1/9/2007 | 40 Years | ||||||||||
| 9930 Franklin Square Drive | White Marsh, MD | Office | — | 1,137 | 3,921 | — | 5,058 | (143 | ) | 2001 | 1/9/2007 | 40 Years | ||||||||||
| Gude Drive Land | Rockville, MD | Office | — | 3,122 | 1,833 | — | 4,955 | — | (2) | 4/7/2005 | N/A | |||||||||||
| 8615 Ridgely's Choice Drive | White Marsh, MD | Office | — | 1,078 | 3,613 | 217 | 4,908 | (116 | ) | 2005 | 1/9/2007 | 40 Years | ||||||||||
F-61
| |
|
|
|
Initial Cost |
|
|
|
|
|
|
||||||||||||
|---|---|---|---|---|---|---|---|---|---|---|---|---|---|---|---|---|---|---|---|---|---|---|
| |
|
|
|
Costs Capitalized Subsequent to Acquisition |
|
|
|
|
|
|||||||||||||
| Property |
Location |
Building Type |
Encumbrances(1) |
Land |
Building and Land Improvements |
Gross Amounts Carried at Close of Period(7) |
Accumulated Depreciation |
Year Built or Renovated |
Date Acquired |
Depreciation Life |
||||||||||||
| 9740 Patuxent Woods | Columbia, MD | Office | 2,691 | 1,629 | 3,201 | — | 4,830 | (139 | ) | 1986/2001 | 1/9/2007 | 40 Years | ||||||||||
| 800 International Drive | Linthicum, MD | Office | 8,408 | 775 | 3,099 | 909 | 4,783 | (1,005 | ) | 1988 | 4/30/1998 | 40 Years | ||||||||||
| 8007 Corporate Drive | White Marsh, MD | Office | — | 1,434 | 3,340 | — | 4,774 | (174 | ) | 1995 | 1/9/2007 | 40 Years | ||||||||||
| 9160 Guilford Road | Columbia, MD | Office | 2,532 | 665 | 2,836 | 1,198 | 4,699 | (900 | ) | 1984 | 4/4/2002 | 40 Years | ||||||||||
| 7061 Columbia Gateway Drive | Columbia, MD | Office | 2,528 | 729 | 3,347 | 559 | 4,635 | (847 | ) | 2000 | 8/30/2001 | 40 Years | ||||||||||
| 8010 Corporate Drive | White Marsh, MD | Office | — | 1,349 | 3,278 | — | 4,627 | (124 | ) | 1998 | 1/9/2007 | 40 Years | ||||||||||
| 4230 Forbes Boulevard | Lanham, MD | Office | — | 511 | 4,111 | — | 4,622 | (859 | ) | 2003 | (4) | 40 Years | ||||||||||
| 216 Schilling Center | Hunt Valley, MD | Office | — | 825 | 3,752 | 10 | 4,587 | (179 | ) | 1988/2001 | 1/10/2007 | 40 Years | ||||||||||
| 7150 Columbia Gateway Drive | Columbia, MD | Office | 4,850 | 1,032 | 3,429 | 122 | 4,583 | (295 | ) | 1991 | 9/19/2005 | 40 Years | ||||||||||
| 9960 Federal Drive | Colorado Springs, CO | Office | 4,485 | 695 | 3,873 | — | 4,568 | (225 | ) | 2001 | 12/22/2005 | 40 Years | ||||||||||
| COPT-FD Indian Head, LLC | Charles County, MD | Office | — | 4,443 | 112 | — | 4,555 | — | (3) | 10/23/2006 | N/A | |||||||||||
| 9940 Franklin Ridge Drive | White Marsh, MD | Office | — | 1,052 | 3,424 | 7 | 4,483 | (127 | ) | 2000 | 1/9/2007 | 40 Years | ||||||||||
| 9900 Franklin Ridge Drive | White Marsh, MD | Office | — | 979 | 3,467 | — | 4,446 | (129 | ) | 1999 | 1/9/2007 | 40 Years | ||||||||||
| 7170 Riverwood Drive | Columbia, MD | Office | — | 1,283 | 3,096 | — | 4,379 | (110 | ) | 2000 | 1/10/2007 | 40 Years | ||||||||||
| 102 West Pennsylvania Avenue | Towson, MD | Office | — | 1,090 | 3,199 | 85 | 4,374 | (165 | ) | 1968/2001 | 1/10/2007 | 40 Years | ||||||||||
| 21 Governor's Court | Woodlawn, MD | Office | — | 771 | 3,348 | 229 | 4,348 | (287 | ) | 1981/1995 | 12/22/2005 | 40 Years | ||||||||||
| 9140 Guilford Road | Columbia, MD | Office | 2,933 | 794 | 3,261 | 272 | 4,327 | (727 | ) | 1983 | 4/4/2002 | 40 Years | ||||||||||
| 5355 Nottingham Ridge Road | White Marsh, MD | Office | — | 761 | 3,562 | — | 4,323 | (89 | ) | 2005 | 1/9/2007 | 40 Years | ||||||||||
| 44408 Pecan Court | California, MD | Office | — | 817 | 3,269 | 85 | 4,171 | (311 | ) | 1986 | 3/24/2004 | 40 Years | ||||||||||
| 5020 Campbell Blvd | White Marsh, MD | Office | — | 1,014 | 3,136 | — | 4,150 | (122 | ) | 1986-1988 | 1/9/2007 | 40 Years | ||||||||||
| 9730 Patuxent Woods | Columbia, MD | Office | 2,246 | 1,318 | 2,714 | 8 | 4,040 | (145 | ) | 1986/2001 | 1/9/2007 | 40 Years | ||||||||||
| 1915 Aerotech Drive | Colorado Springs, CO | Office | 3,394 | 556 | 3,094 | 318 | 3,968 | (253 | ) | 1985 | 6/8/2006 | 40 Years | ||||||||||
| 9700 Patuxent Woods | Columbia, MD | Office | 2,200 | 1,329 | 2,621 | 7 | 3,957 | (119 | ) | 1986/2001 | 1/9/2007 | 40 Years | ||||||||||
| 1334 Ashton Road | Hanover, MD | Office | 2,766 | 736 | 2,946 | 270 | 3,952 | (739 | ) | 1989 | 4/28/1999 | 40 Years | ||||||||||
| 23535 Cottonwood Parkway | California, MD | Office | — | 763 | 3,051 | 17 | 3,831 | (287 | ) | 1984 | 3/24/2004 | 40 Years | ||||||||||
| 47 Commerce Drive | Cranbury, NJ | Office | — | 756 | 3,026 | — | 3,782 | (694 | ) | 1992/1998 | 10/30/1998 | 40 Years | ||||||||||
| 437 Ridge Road | Dayton, NJ | Office | — | 717 | 2,866 | 175 | 3,758 | (760 | ) | 1962/1996 | 10/14/1997 | 40 Years | ||||||||||
| 8029 Corporate Drive | White Marsh, MD | Office | — | 965 | 2,720 | — | 3,685 | (105 | ) | 1988/2004 | 1/9/2007 | 40 Years | ||||||||||
| Gude Drive Land | Rockville, MD | Office | — | 3,122 | 542 | — | 3,664 | — | (3) | 4/7/2005 | N/A | |||||||||||
| 1925 Aerotech Drive | Colorado Springs, CO | Office | 3,717 | 556 | 3,067 | 3 | 3,626 | (184 | ) | 1985 | 6/8/2006 | 40 Years | ||||||||||
| 7939 Honeygo Boulevard | White Marsh, MD | Office | — | 869 | 2,735 | — | 3,604 | (159 | ) | 1984 | 1/10/2007 | 40 Years | ||||||||||
| 312 Sentinel Drive | Annapolis Junction, MD | Office | — | 3,160 | 432 | — | 3,592 | — | (2) | 11/14/2003 | N/A | |||||||||||
| 7253 Ambassador Road | Woodlawn, MD | Office | — | 792 | 2,778 | — | 3,570 | (218 | ) | 1988 | 12/22/2005 | 40 Years | ||||||||||
| Nottingham Road and Philadelphia Avenue | White Marsh, MD | Office | — | 3,226 | 220 | — | 3,446 | — | (2) | 1/9/2007 | N/A | |||||||||||
F-62
| |
|
|
|
Initial Cost |
|
|
|
|
|
|
||||||||||||
|---|---|---|---|---|---|---|---|---|---|---|---|---|---|---|---|---|---|---|---|---|---|---|
| |
|
|
|
Costs Capitalized Subsequent to Acquisition |
|
|
|
|
|
|||||||||||||
| Property |
Location |
Building Type |
Encumbrances(1) |
Land |
Building and Land Improvements |
Gross Amounts Carried at Close of Period(7) |
Accumulated Depreciation |
Year Built or Renovated |
Date Acquired |
Depreciation Life |
||||||||||||
| 114 National Business Parkway | Annapolis Junction, MD | Retail | — | 364 | 3,060 | 3 | 3,427 | (444 | ) | 2002 | 6/30/2000 | 40 Years | ||||||||||
| 224 Schilling Circle | Hunt Valley, MD | Office | — | 734 | 2,487 | 140 | 3,361 | (182 | ) | 1978/1997 | 1/10/2007 | 40 Years | ||||||||||
| Interquest Hybrid 1 | Colorado Springs, CO | Office | — | 1,854 | 1,478 | — | 3,332 | — | (2) | 9/30/2005 | N/A | |||||||||||
| 5024 Campbell Blvd | White Marsh, MD | Office | — | 767 | 2,470 | 94 | 3,331 | (161 | ) | 1986-1988 | 1/9/2007 | 40 Years | ||||||||||
| 8133 Perry Hall Boulevard | White Marsh, MD | Office | — | 850 | 2,452 | 8 | 3,310 | (130 | ) | 1988 | 1/10/2007 | 40 Years | ||||||||||
| 222 Schilling Circle | Hunt Valley, MD | Office | — | 754 | 2,476 | 10 | 3,240 | (108 | ) | 1978/1997 | 1/10/2007 | 40 Years | ||||||||||
| 16442 Commerce Drive | Dahlgren, VA | Office | 2,452 | 613 | 2,582 | — | 3,195 | (265 | ) | 2005 | 12/21/2004 | 40 Years | ||||||||||
| San.Antonio Visitor Control | San Antonio, TX | Office | — | — | 3,178 | — | 3,178 | — | (2) | 3/30/2005 | N/A | |||||||||||
| 316 Sentinel Drive | Annapolis Junction, MD | Office | — | 2,769 | 387 | — | 3,156 | — | (2) | 11/14/2003 | N/A | |||||||||||
| 1331 Ashton Road | Hanover, MD | Office | 2,204 | 587 | 2,347 | 106 | 3,040 | (524 | ) | 1989 | 4/28/1999 | 40 Years | ||||||||||
| Corporate Place IV | White Marsh, MD | Office | — | 2,017 | 913 | — | 2,930 | — | (2) | 1/9/2007 | N/A | |||||||||||
| Interquest Epic One | Colorado Springs, CO | Office | — | 1,840 | 1,041 | — | 2,881 | — | (2) | 9/30/2005 | N/A | |||||||||||
| 7125 Ambassador Road | Woodlawn, MD | Office | — | 844 | 1,896 | 136 | 2,876 | (245 | ) | 1985 | 12/22/2005 | 40 Years | ||||||||||
| 5026 Campbell Blvd | White Marsh, MD | Office | — | 700 | 2,139 | — | 2,839 | (85 | ) | 1986-1988 | 1/9/2007 | 40 Years | ||||||||||
| 310 Sentinel Drive | Annapolis Junction, MD | Office | — | 2,393 | 381 | — | 2,774 | — | (2) | 11/14/2003 | N/A | |||||||||||
| 16501 Commerce Drive | Dahlgren, VA | Office | 2,085 | 522 | 2,194 | 38 | 2,754 | (285 | ) | 2006 | 12/21/2004 | 40 Years | ||||||||||
| 7923 Honeygo Boulevard | White Marsh, MD | Office | — | 715 | 1,932 | 62 | 2,709 | (102 | ) | 1985 | 1/10/2007 | 40 Years | ||||||||||
| 7175 Riverwood Drive | Columbia, MD | Office | — | 1,788 | 913 | — | 2,701 | (46 | ) | 1996(3) | 7/27/2005 | 40 Years | ||||||||||
| 980 Technology Court | Colorado Springs, CO | Office | — | 526 | 2,046 | 124 | 2,696 | (197 | ) | 1995 | 9/28/2005 | 40 Years | ||||||||||
| 7134 Columbia Gateway Drive | Columbia, MD | Office | 2,949 | 704 | 1,971 | 7 | 2,682 | (185 | ) | 1990 | 9/19/2005 | 40 Years | ||||||||||
| 308 Sentinel Drive | Annapolis Junction, MD | Office | — | 1,387 | 1,219 | — | 2,606 | — | (2) | 11/14/2003 | N/A | |||||||||||
| 8019 Corporate Drive | White Marsh, MD | Office | 1,717 | 684 | 1,898 | (4 | ) | 2,578 | (86 | ) | 1990 | 1/9/2007 | 40 Years | |||||||||
| 5022 Campbell Blvd | White Marsh, MD | Office | — | 624 | 1,935 | 11 | 2,570 | (82 | ) | 1986-1988 | 1/9/2007 | 40 Years | ||||||||||
| Clarks Hundred II | Annapolis Junction, MD | Office | — | 2,409 | 132 | — | 2,541 | — | (2) | 3/14/2007 | N/A | |||||||||||
| 8013 Corporate Drive | White Marsh, MD | Office | 1,615 | 642 | 1,788 | 107 | 2,537 | (398 | ) | 1990 | 1/9/2007 | 40 Years | ||||||||||
| 44417 Pecan Court | California, MD | Office | — | 434 | 1,939 | 13 | 2,386 | (341 | ) | 1989 | 3/24/2004 | 40 Years | ||||||||||
| 10270 Old Columbia Road | Columbia, MD | Office | 1,215 | 751 | 1,430 | 163 | 2,344 | (85 | ) | 1988/2001 | 1/9/2007 | 40 Years | ||||||||||
| Interquest Hybrid 2 | Colorado Springs, CO | Office | — | 1,129 | 1,173 | — | 2,302 | — | (2) | 9/30/2005 | N/A | |||||||||||
| 8003 Corporate Drive | White Marsh, MD | Office | — | 611 | 1,632 | 36 | 2,279 | (72 | ) | 1999 | 1/9/2007 | 40 Years | ||||||||||
| 16543 Commerce Drive | Dahlgren, VA | Office | 1,739 | 436 | 1,830 | — | 2,266 | (219 | ) | 2002 | 12/21/2004 | 40 Years | ||||||||||
| 10280 Old Columbia Road | Columbia, MD | Office | 1,226 | 756 | 1,445 | 59 | 2,260 | (80 | ) | 1988/2001 | 1/9/2007 | 40 Years | ||||||||||
| 1350 Dorsey Road | Hanover, MD | Office | 1,477 | 393 | 1,573 | 291 | 2,257 | (522 | ) | 1989 | 4/28/1999 | 40 Years | ||||||||||
| 8023 Corporate Drive | White Marsh, MD | Office | 1,499 | 651 | 1,603 | — | 2,254 | (44 | ) | 1990 | 1/9/2007 | 40 Years | ||||||||||
| 1460 Dorsey Road | Hanover, MD | Office | — | 2,141 | 37 | — | 2,178 | — | (3) | 2/28/2006 | N/A | |||||||||||
F-63
| |
|
|
|
Initial Cost |
|
|
|
|
|
|
||||||||||||
|---|---|---|---|---|---|---|---|---|---|---|---|---|---|---|---|---|---|---|---|---|---|---|
| |
|
|
|
Costs Capitalized Subsequent to Acquisition |
|
|
|
|
|
|||||||||||||
| Property |
Location |
Building Type |
Encumbrances(1) |
Land |
Building and Land Improvements |
Gross Amounts Carried at Close of Period(7) |
Accumulated Depreciation |
Year Built or Renovated |
Date Acquired |
Depreciation Life |
||||||||||||
| Corporate Place III | White Marsh, MD | Office | — | 2,017 | 138 | — | 2,155 | — | (2) | 1/9/2007 | N/A | |||||||||||
| 44414 Pecan Court | California, MD | Office | — | 405 | 1,619 | 90 | 2,114 | (185 | ) | 1986 | 3/24/2004 | 40 Years | ||||||||||
| 11101 McCormick Road | Hunt Valley, MD | Office | — | 991 | 1,080 | 8 | 2,079 | (96 | ) | 1976 | 12/22/2005 | 40 Years | ||||||||||
| 314 Sentinel Drive | Annapolis Junction, MD | Office | — | 1,232 | 816 | — | 2,048 | — | (2) | 11/14/2003 | N/A | |||||||||||
| 1344 Ashton Road | Hanover, MD | Office | 1,334 | 355 | 1,421 | 266 | 2,042 | (495 | ) | 1989 | 4/28/1999 | 40 Years | ||||||||||
| 9710 Patuxent Woods | Columbia, MD | Office | 1,068 | 648 | 1,269 | 49 | 1,966 | (53 | ) | 1986/2001 | 1/9/2007 | 40 Years | ||||||||||
| 9150 Guilford Road | Columbia, MD | Office | 1,210 | 319 | 1,354 | 235 | 1,908 | (363 | ) | 1984 | 4/4/2002 | 40 Years | ||||||||||
| Riverwood II | Columbia, MD | Office | — | 1,367 | 531 | — | 1,898 | — | (2) | 7/27/2005 | N/A | |||||||||||
| 1341 Ashton Road | Hanover, MD | Office | 1,149 | 306 | 1,223 | 362 | 1,891 | (377 | ) | 1989 | 4/28/1999 | 40 Years | ||||||||||
| 44420 Pecan Court | California, MD | Office | — | 344 | 1,374 | 86 | 1,804 | (117 | ) | 1989 | 11/9/2004 | 40 Years | ||||||||||
| Thomas Johnson Drive Land | Frederick, MD | Office | — | 1,092 | 667 | — | 1,759 | — | (2) | 10/21/2005 | N/A | |||||||||||
| 100 West Pennsylvania Avenue | Towson, MD | Office | — | 698 | 975 | 30 | 1,703 | (52 | ) | 1952/1989 | 1/9/2007 | 40 Years | ||||||||||
| 324 Sentinel Drive | Annapolis Junction, MD | Office | — | 1,650 | 28 | — | 1,678 | — | (2) | 6/29/2003 | N/A | |||||||||||
| White Marsh Commerce Center II | White Marsh, MD | Office | — | 1,613 | 10 | — | 1,623 | — | (3) | 1/9/2007 | N/A | |||||||||||
| 7104 Ambassador Road | Woodlawn, MD | Office | — | 572 | 613 | 410 | 1,595 | (102 | ) | 1988 | 12/22/2005 | 40 Years | ||||||||||
| 8015 Corporate Drive | White Marsh, MD | Office | 1,040 | 446 | 1,118 | — | 1,564 | (46 | ) | 1990 | 1/9/2007 | 40 Years | ||||||||||
| 15 Governor's Court | Woodlawn, MD | Office | — | 383 | 1,168 | — | 1,551 | (95 | ) | 1981 | 12/22/2005 | 40 Years | ||||||||||
| 10290 Old Columbia Road | Columbia, MD | Office | 772 | 490 | 895 | 33 | 1,418 | (34 | ) | 1988/2001 | 1/9/2007 | 40 Years | ||||||||||
| 525 Babcock Rd | Colorado Springs, CO | Office | — | 355 | 974 | — | 1,329 | (19 | ) | 1967 | 7/12/2007 | 40 Years | ||||||||||
| Patriot Park VII | Colorado Springs, CO | Office | — | 644 | 667 | — | 1,311 | — | (2) | 7/8/2005 | N/A | |||||||||||
| 9130 Guilford Road | Columbia, MD | Office | 871 | 230 | 975 | 101 | 1,306 | (230 | ) | 1984 | 4/4/2002 | 40 Years | ||||||||||
| Aerotech 2 | Colorado Springs, CO | Office | — | 1,291 | — | — | 1,291 | — | (3) | 5/19/2006 | N/A | |||||||||||
| Lot 401-White Marsh | White Marsh, MD | Office | — | 1,182 | 7 | — | 1,189 | — | (3) | 1/9/2007 | N/A | |||||||||||
| 6741 Columbia Gateway Drive | Columbia, MD | Office | — | 675 | 433 | — | 1,108 | — | (2) | 9/28/2000 | N/A | |||||||||||
| Dahlgren Land Parcel | Dahlgren, VA | Office | — | 910 | 160 | — | 1,070 | — | (3) | 3/16/2005 | N/A | |||||||||||
| 7129 Ambassador Road | Woodlawn, MD | Office | — | 129 | 610 | 329 | 1,068 | (74 | ) | 1985 | 12/22/2005 | 40 Years | ||||||||||
| 0 Galley Road | Colorado Springs, CO | Office | — | 1,060 | — | — | 1,060 | — | (3) | 4/21/2006 | N/A | |||||||||||
| Philadelphia Road & Route 43 | White Marsh, MD | Office | — | 1,008 | 44 | — | 1,052 | — | (3) | 1/9/2007 | N/A | |||||||||||
| 1343 Ashton Road | Hanover, MD | Office | 726 | 193 | 774 | 40 | 1,007 | (169 | ) | 1989 | 4/28/1999 | 40 Years | ||||||||||
| 16442A Commerce Drive | Dahlgren, VA | Office | — | 317 | 630 | — | 947 | — | (2) | 12/21/2004 | N/A | |||||||||||
| Babcock Development Land Parcel | Colorado Springs, CO | Office | — | 826 | — | — | 826 | — | (3) | 7/1/2007 | N/A | |||||||||||
F-64
| |
|
|
|
Initial Cost |
|
|
|
|
|
|
||||||||||||||||||
|---|---|---|---|---|---|---|---|---|---|---|---|---|---|---|---|---|---|---|---|---|---|---|---|---|---|---|---|---|
| |
|
|
|
Costs Capitalized Subsequent to Acquisition |
|
|
|
|
|
|||||||||||||||||||
| Property |
Location |
Building Type |
Encumbrances(1) |
Land |
Building and Land Improvements |
Gross Amounts Carried at Close of Period(7) |
Accumulated Depreciation |
Year Built or Renovated |
Date Acquired |
Depreciation Life |
||||||||||||||||||
| Expedition VII | Lexington Park, MD | Office | — | 705 | 102 | — | 807 | — | (3) | 3/24/2004 | N/A | |||||||||||||||||
| 17 Governor's Court | Woodlawn, MD | Office | — | 170 | 530 | 102 | 802 | (29 | ) | 1981 | 12/22/2005 | 40 Years | ||||||||||||||||
| 7127 Ambassador Road | Woodlawn, MD | Office | — | 142 | 455 | 203 | 800 | (29 | ) | 1985 | 12/22/2005 | 40 Years | ||||||||||||||||
| Park Center | Chantilly,VA | Office | — | — | 789 | — | 789 | — | (3) | 7/18/2002 | N/A | |||||||||||||||||
| 7131 Ambassador Road | Woodlawn, MD | Office | — | 105 | 368 | 282 | 755 | (27 | ) | 1985 | 12/22/2005 | 40 Years | ||||||||||||||||
| Airport Square XXII | Linthicum, MD | Office | — | 630 | 8 | — | 638 | — | (3) | 12/19/2001 | N/A | |||||||||||||||||
| South Brunswick, LP | Dayton, NJ | Office | — | — | 591 | — | 591 | — | (3) | 10/14/1997 | N/A | |||||||||||||||||
| 7106 Ambassador Road | Woodlawn, MD | Office | — | 229 | 306 | — | 535 | (26 | ) | 1988 | 12/22/2005 | 40 Years | ||||||||||||||||
| Arundel Preserve-Parcel 9 | Hanover, MD | Office | — | — | 533 | — | 533 | — | (2) | (5) | N/A | |||||||||||||||||
| COPT Princeton South | Dayton, NJ | Office | — | 512 | — | — | 512 | — | (3) | 9/29/2004 | N/A | |||||||||||||||||
| 37 Allegheny Avenue | Towson, MD | Office | — | 504 | — | — | 504 | — | (3) | 1/9/2007 | N/A | |||||||||||||||||
| 7102 Ambassador Road | Woodlawn, MD | Office | — | 277 | 203 | — | 480 | (10 | ) | 1988 | 12/22/2005 | 40 Years | ||||||||||||||||
| 9965 Federal Land Parcel | Colorado Springs, CO | Office | — | 466 | — | — | 466 | — | (3) | 1/19/2006 | N/A | |||||||||||||||||
| 7865 Brock Bridge Rd | Annapolis Junction, MD | Office | — | 441 | 24 | — | 465 | — | (2) | 4/2/2007 | N/A | |||||||||||||||||
| 7108 Ambassador Road | Woodlawn, MD | Office | — | 171 | 252 | 3 | 426 | (13 | ) | 1988 | 12/22/2005 | 40 Years | ||||||||||||||||
| COPT Pennlyn LLC | Blue Bell, PA | Office | — | 401 | — | — | 401 | — | (3) | 7/14/2004 | N/A | |||||||||||||||||
| Arundel Preserve-Parcel 7 | Hanover, MD | Office | — | — | 393 | — | 393 | — | (2) | (5) | N/A | |||||||||||||||||
| 7873 Brock Bridge Rd | Annapolis Junction, MD | Office | — | 309 | 35 | — | 344 | — | (2) | 3/30/2007 | N/A | |||||||||||||||||
| Arundel Presserve-Parcel 8 | Hanover, MD | Office | — | — | 264 | — | 264 | — | (2) | (5) | N/A | |||||||||||||||||
| 7800 Milestone Parkway | Hanover, MD | Office | — | — | 177 | — | 177 | — | (2) | (5) | N/A | |||||||||||||||||
| 1338 Ashton Road | Hanover, MD | Retail | 38 | 50 | — | 40 | 90 | (12 | ) | 1989 | 4/28/1999 | 40 Years | ||||||||||||||||
| Other Developments, including intercompany eliminations | Various | Various | — | 9 | (395 | ) | 242 | (144 | ) | 49 | Various | Various | Various | |||||||||||||||
| $ | 1,262,487 | $ | 631,407 | $ | 2,103,893 | $ | 156,559 | $ | 2,891,859 | $ | (288,387 | ) | ||||||||||||||||
F-65
The following table summarizes our changes in cost of properties for the periods ended December 31, 2007, 2006 and 2005 (in thousands):
| |
2007 |
2006 |
2005 |
|||||||
|---|---|---|---|---|---|---|---|---|---|---|
| Beginning balance | $ | 2,330,884 | $ | 2,061,590 | $ | 1,685,016 | ||||
| Property acquisitions | 354,972 | 166,416 | 341,911 | |||||||
| Building and land improvements | 226,618 | 173,746 | 139,424 | |||||||
| Sales | (21,079 | ) | (70,868 | ) | (28,109 | ) | ||||
| Contribution of assets to unconsolidated joint venture | — | — | (76,183 | ) | ||||||
| Reclassification of building out of (into) development | 464 | — | (464 | ) | ||||||
| Other | — | — | (5 | ) | ||||||
| Ending balance | $ | 2,891,859 | $ | 2,330,884 | $ | 2,061,590 | ||||
The following table summarizes our changes in accumulated depreciation for the same time periods (in thousands):
| |
2007 |
2006 |
2005 |
|||||||
|---|---|---|---|---|---|---|---|---|---|---|
| Beginning balance | $ | 219,574 | $ | 174,935 | $ | 141,716 | ||||
| Depreciation expense | 70,537 | 55,382 | 48,421 | |||||||
| Sales | (2,162 | ) | (10,743 | ) | (3,508 | ) | ||||
| Contribution of assets to unconsolidated joint venture | — | — | (11,146 | ) | ||||||
| Reclassification of building out of (into) development | 464 | — | (464 | ) | ||||||
| Other | (26 | ) | — | (84 | ) | |||||
| Ending balance | $ | 288,387 | $ | 219,574 | $ | 174,935 | ||||
F-66