
Use these links to rapidly review the document
Table of Contents Form 10-K
CORPORATE OFFICE PROPERTIES TRUST AND SUBSIDIARIES INDEX TO FINANCIAL STATEMENTS
UNITED STATES
SECURITIES AND EXCHANGE COMMISSION
Washington, D.C. 20549
FORM 10-K
| (Mark one) | ||
ý |
ANNUAL REPORT PURSUANT TO SECTION 13 OR 15(d) OF THE SECURITIES EXCHANGE ACT OF 1934 |
|
For the fiscal year ended December 31, 2011 |
||
or |
||
o |
TRANSITION REPORT PURSUANT TO SECTION 13 OR 15(d) OF THE SECURITIES EXCHANGE ACT OF 1934 |
|
For the transition period from to |
||
Commission file number 1-14023
Corporate Office Properties Trust
(Exact name of registrant as specified in its charter)
| Maryland | 23-2947217 | |
| (State or other jurisdiction of incorporation or organization) |
(IRS Employer Identification No.) |
|
6711 Columbia Gateway Drive, Suite 300 Columbia, MD |
21046 |
|
| (Address of principal executive offices) | (Zip Code) |
Registrant's telephone number, including area code: (443) 285-5400
Securities registered pursuant to Section 12(b) of the Act:
| (Title of Each Class) | (Name of Exchange on Which Registered) | |
|---|---|---|
| Common Shares of beneficial interest, $0.01 par value | New York Stock Exchange | |
| Series G Cumulative Redeemable Preferred Shares of beneficial interest, $0.01 par value | New York Stock Exchange | |
| Series H Cumulative Redeemable Preferred Shares of beneficial interest, $0.01 par value | New York Stock Exchange | |
| Series J Cumulative Redeemable Preferred Shares of beneficial interest, $0.01 par value | New York Stock Exchange |
Securities registered pursuant to Section 12(g) of the Act: None
Indicate by check mark if the registrant is a well-known seasoned issuer, as defined in Rule 405 of the Securities Act. ý Yes o No
Indicate by check mark if the registrant is not required to file reports pursuant to Section 13 or Section 15(d) of the Exchange Act. o Yes ý No
Indicate by check mark whether the registrant (1) has filed all reports required to be filed by Section 13 or 15(d) of the Securities Exchange Act of 1934 during the preceding 12 months (or for such shorter period that the registrant was required to file such reports), and (2) has been subject to such filing requirements for the past 90 days. ý Yes o No
Indicate by check mark whether the registrant has submitted electronically and posted on its corporate web site, if any, every Interactive Data File required to be submitted and posted pursuant to Rule 405 of Regulation S-T during the preceding 12 months (or for such shorter period that the registrant was required to submit and post such files). ý Yes o No
Indicate by check mark if disclosure of delinquent filers pursuant to Item 405 of Regulation S-K is not contained herein, and will not be contained, to the best of registrant's knowledge, in definitive proxy or information statements incorporated by reference in Part III of this Form 10-K or any amendment to this Form 10-K. ý
Indicate by check mark whether the registrant is a large accelerated filer, an accelerated filer, a non-accelerated filer, or a smaller reporting company. See the definitions of "large accelerated filer," "accelerated filer" and "smaller reporting company" in Rule 12b-2 of the Exchange Act. (Check One):
| Large accelerated filer ý | Accelerated filer o | Non-accelerated filer o (Do not check if a smaller reporting company) |
Smaller reporting company o |
Indicate by check mark whether the registrant is a shell company (as defined in Rule 12b-2 of the Exchange Act.) o Yes ý No
The aggregate market value of the voting and nonvoting common equity held by non-affiliates of the registrant was approximately $2.2 billion, as calculated using the closing price of the common shares of beneficial interest on the New York Stock Exchange and our outstanding shares as of June 30, 2011. For purposes of calculating this amount only, affiliates are defined as Trustees, executive owners and beneficial owners of more than 10% of the registrant's outstanding common shares of beneficial interest, $0.01 par value. At January 27, 2012, 72,019,987 of the registrant's common shares of beneficial interest were outstanding.
Portions of the annual shareholders' report of the registrant for the year ended December 31, 2011 are incorporated by reference into Parts I and II of this Form 10-K and portions of the proxy statement of the registrant for its 2012 Annual Meeting of Shareholders to be filed within 120 days after the end of the fiscal year covered by this Form 10-K are incorporated by reference into Part III of this Form 10-K.
2
This Form 10-K contains "forward-looking" statements, as defined in the Private Securities Litigation Reform Act of 1995, that are based on our current expectations, estimates and projections about future events and financial trends affecting the financial condition and operations of our business. Forward-looking statements can be identified by the use of words such as "may," "will," "should," "could," "believe," "anticipate," "expect," "estimate," "plan" or other comparable terminology. Forward-looking statements are inherently subject to risks and uncertainties, many of which we cannot predict with accuracy and some of which we might not even anticipate. Although we believe that the expectations, estimates and projections reflected in such forward-looking statements are based on reasonable assumptions at the time made, we can give no assurance that these expectations, estimates and projections will be achieved. Future events and actual results may differ materially from those discussed in the forward-looking statements. Important factors that may affect these expectations, estimates and projections include, but are not limited to:
For further information on factors that could affect the company and the statements contained herein, you should refer to the section below entitled "Item 1A. Risk Factors." We undertake no obligation to update or supplement forward-looking statements.
3
OUR COMPANY
General. We are an office real estate investment trust ("REIT") that focuses primarily on serving the specialized requirements of strategic customers in the United States Government and defense information technology sectors. We acquire, develop, manage and lease office and data center properties that are typically concentrated in large office parks primarily located adjacent to government demand drivers and/or in office markets that we believe possess growth opportunities. As of December 31, 2011, our investments in real estate included the following:
We conduct almost all of our operations through our operating partnership, Corporate Office Properties, L.P. (the "Operating Partnership"), a Delaware limited partnership, of which we are the managing general partner. The Operating Partnership owns real estate both directly and through subsidiary partnerships and limited liability companies ("LLCs"). The Operating Partnership also owns 100% of a number of entities that provide real estate services such as property management, construction and development services primarily for our properties but also for third parties.
Interests in our Operating Partnership are in the form of common and preferred units. As of December 31, 2011, we owned 94.4% of the outstanding common units and 95.8% of the outstanding preferred units in our Operating Partnership. The remaining common and preferred units in our Operating Partnership were owned by third parties, which included certain of our Trustees.
We believe that we are organized and have operated in a manner that permits us to satisfy the requirements for taxation as a REIT under the Internal Revenue Code of 1986, as amended, and we intend to continue to operate in such a manner. Provided we continue to qualify for taxation as a REIT, we generally will not be subject to Federal income tax on our taxable income that is distributed to our shareholders. A REIT is subject to a number of organizational and operational requirements, including a requirement that it distribute to its shareholders at least 90% of its annual taxable income (excluding net capital gains).
Our executive offices are located at 6711 Columbia Gateway Drive, Suite 300, Columbia, Maryland 21046 and our telephone number is (443) 285-5400.
Our Internet address is www.copt.com. We make available on our Internet website free of charge our annual reports on Form 10-K, quarterly reports on Form 10-Q, current reports on Form 8-K and amendments to those reports filed or furnished pursuant to Section 13(a) or 15(d) of the Securities Exchange Act of 1934, as amended (the "Exchange Act") as soon as reasonably possible after we file such material with the Securities and Exchange Commission (the "SEC"). In addition, we have made available on our Internet website under the heading "Corporate Governance" the charters for our Board of Trustees' Audit, Nominating and Corporate Governance, Compensation and Investment Committees, as well as our Corporate Governance Guidelines, Code of Business Conduct and Ethics
4
and Code of Ethics for Financial Officers. We intend to make available on our website any future amendments or waivers to our Code of Business Conduct and Ethics and Code of Ethics for Financial Officers within four business days after any such amendments or waivers. The information on our Internet site is not part of this report.
The SEC maintains an Internet website that contains reports, proxy and information statements and other information regarding issuers that file electronically with the SEC. This Internet website can be accessed at www.sec.gov. The public may also read and copy paper filings that we have made with the SEC at the SEC's Public Reference Room, located at 100 F Street, NE, Washington, DC 20549. Information on the operation of the Public Reference Room may be obtained by calling (800) SEC-0330.
Significant 2011 Developments
During 2011, we:
5
as CEO and as a member of our Board of Trustees effective April 1, 2012. We expect Mr. Griffin to continue to serve as a member of our Board of Trustees. We also appointed Stephen E. Budorick as Executive Vice President and Chief Operating Officer effective September 29, 2011.
Business and Growth Strategies
Our primary objectives are to achieve sustainable long-term growth in results of operations and to maximize long-term shareholder value. This section sets forth key components of our business and growth strategies that we have in place to support these objectives.
Business Strategies
Customer Strategy: We believe that we differentiate ourselves by being a real estate company that does not view space in properties merely as a commodity. We focus on providing a level of service that exceeds customer expectations both in terms of the quality of the space we provide and our level of responsiveness to their needs. We believe that operating with such an emphasis on service enables us to be the landlord of choice with high quality customers and contributes to high levels of customer loyalty and retention.
Our focus on customers in the United States Government and defense information technology sectors is a key aspect of our customer strategy. A high percentage of our revenue is concentrated with these customers, and we expect to further increase this concentration level through our:
Market Strategy: We focus on owning properties where our tenants need to be, which in the case of the United States Government and defense information technology customers is mostly near government demand drivers. We also concentrate our operations in markets and submarkets that are located where we believe we already possess, or can effectively achieve, the critical mass necessary to maximize management efficiencies, operating synergies and competitive advantages through our acquisition, property management, leasing and development activities. The attributes we look for in selecting markets and submarkets include, among others: (1) proximity to large demand drivers; (2) strong demographics; (3) attractiveness to high quality tenants; (4) potential for growth and stability in economic down cycles; (5) future acquisition and development opportunities; and (6) minimal competition from other property owners. We typically focus on owning and operating office properties in large business parks located outside of central business districts. We believe that such parks generally attract long-term, high-quality tenants seeking to attract and retain quality work forces because they are typically situated along major transportation routes with easy access to support services, amenities and residential communities.
6
Capital Strategy: Our capital strategy is aimed at maintaining a flexible capital structure in order to facilitate growth and performance in the face of differing market conditions in the most cost-effective manner by:
Sustainability Strategy: We are focused on developing and operating our properties in a manner that minimizes global impact for the environment and have been committed to this effort since 2003. Our strategy includes:
We believe that our commitment to sustainability is evident in that as of December 31, 2011, we had 15 buildings certified LEED Gold, 13 buildings certified LEED Silver, two buildings certified LEED and three buildings certified LEED-EB, and all of our buildings that were under construction or redevelopment were registered in the LEED program. In addition, we had 18 professionals on staff who hold the LEED Accredited Professional designation at December 31, 2011. We believe that this strategy is important not just because our customers will demand it, but also because it is the right thing to do.
7
Growth Strategies
Acquisition and Property Development Strategy: We pursue acquisition and property development opportunities for properties that support our customer and market strategies discussed above. As a result, the focus of our acquisition and development activities includes properties that are either: (1) located near demand drivers that we believe are attractive to customers in the United States Government and defense information technology sectors or (2) located in markets or submarkets that we believe meet the criteria set forth above in our market strategy. We may also acquire or develop properties that do not align with our customer or market strategies but which we believe provide opportunity for favorable returns on investment given the associated risks.
We typically seek to make acquisitions at attractive yields and below replacement cost, or that otherwise meet our strategic objectives. We also seek to increase operating cash flow of certain acquisitions by repositioning the properties and capitalizing on existing below market leases and expansion opportunities. We pursue development activities as market conditions and leasing opportunities support favorable risk-adjusted returns on investment.
Disposition Strategy: In 2011, we implemented our Strategic Reallocation Plan to dispose of office properties and land that are no longer closely aligned with our strategy. We believe that the timely disposition of assets that no longer meet our strategic objectives is important for us to maximize our return on invested capital and be better positioned for long term growth.
Internal Growth Strategy: We aggressively manage our portfolio to maximize the operating performance of each property through: (1) proactive property management and leasing; (2) achieving operating efficiencies through increasing economies of scale and, where possible, aggregating vendor contracts to achieve volume pricing discounts; and (3) renewing tenant leases and re-tenanting at increased rents where market conditions permit.
Industry Segments
We operate in two primary industries: commercial office properties and our wholesale data center. We classify our properties containing data center space as commercial office real estate when tenants significantly funded the data center infrastructure costs. At December 31, 2011, our commercial office real estate operations were in geographical segments, as set forth below:
As of December 31, 2011, 203 of our office properties, or 83% of our square feet in operations, were located in the Greater Washington, DC/Baltimore region, which includes all the segments set forth
8
above except for San Antonio, Colorado Springs and Greater Philadelphia. Our wholesale data center, which is comprised of one property in Manassas, Virginia, is reported as a separate segment.
For information relating to our segments, you should refer to Note 16 to our consolidated financial statements, which is included in a separate section at the end of this Annual Report on Form 10-K beginning on page F-1.
Employees
As of December 31, 2011, we had 428 employees, none of whom were parties to collective bargaining agreements. We believe that our relations with our employees are good.
Competition
The commercial real estate market is highly competitive. Numerous commercial properties compete with our properties for tenants. Some of the properties competing with ours may be newer or in more desirable locations, or the competing properties' owners may be willing to accept lower rents than are acceptable to us. We also compete with our own tenants, many of whom have the right to sublease their space. The competitive environment for leasing is affected considerably by a number of factors including, among other things, changes in economic factors and supply of and demand for space. These factors may make it difficult for us to lease existing vacant space and space associated with future lease expirations at rental rates that are sufficient to meeting our short-term capital needs.
We also compete for the acquisition of commercial properties with many entities, including other publicly-traded commercial REITs. Many of our competitors for such acquisitions have substantially greater financial resources than ours. In addition, our competitors may be willing to accept lower returns on their investments. If our competitors prevent us from buying properties that we have targeted for acquisition, we may not be able to meet our property acquisition goals.
In addition, we also compete with other sellers of commercial properties for a limited number of buyers of properties. This competition could adversely affect our ability to complete property dispositions under the Strategic Reallocation Plan.
Set forth below are risks and uncertainties relating to our business and the ownership of our securities. You should carefully consider each of these risks and uncertainties and all of the information in this Annual Report on Form 10-K and its Exhibits, including our consolidated financial statements and notes thereto for the year ended December 31, 2011, which are included in a separate section at the end of this report beginning on page F-1.
Our performance and value are subject to risks associated with our properties and with the real estate industry. Real estate investments are subject to various risks and fluctuations in value and demand, many of which are beyond our control. Our economic performance and the value of our real estate assets may decline due to conditions in the general economy and the real estate business which, in turn, could have an adverse effect on our financial position, results of operations, cash flows and ability to make expected distributions to our shareholders. These conditions include, but are not limited to:
9
We may suffer adverse consequences as a result of adverse economic conditions. Our business may be affected by adverse economic conditions in the United States economy or real estate industry as a whole or by the local economic conditions in the markets in which our properties are located, including the impact of high unemployment and constrained credit. Adverse economic conditions could increase the likelihood of tenants encountering financial difficulties, including bankruptcy, insolvency or general downturn of business, and as a result could increase the likelihood of tenants defaulting in their lease obligations to us. Such conditions also could increase the likelihood of our being unsuccessful in renewing tenants, renewing tenants on terms less favorable to us or being unable to lease newly constructed properties. In addition, such conditions could increase the level of risk that we may not be able to obtain new financing for development activities, acquisitions, refinancing of existing debt or other capital requirements at reasonable terms, if at all. As a result, adverse economic conditions could collectively have an adverse effect on our financial position, results of operations, cash flows and ability to make expected distributions to our shareholders.
We may suffer adverse consequences as a result of our reliance on rental revenues for our income. We earn revenue from renting our properties. Our operating costs do not necessarily fluctuate in relation to changes in our rental revenue. This means that our costs will not necessarily decline and may increase even if our revenues decline.
For new tenants or upon lease expiration for existing tenants, we generally must make improvements and pay other leasing costs for which we may not receive increased rents. We also make building-related capital improvements for which tenants may not reimburse us.
If our properties do not generate revenue sufficient to meeting our operating expenses and capital costs, we may have to borrow additional amounts to cover these costs. In such circumstances, we would likely have lower profits or possibly incur losses. We may also find in such circumstances that we are unable to borrow to cover such costs, in which case our operations could be adversely affected. Moreover, there may be less or no cash available for distributions to our shareholders.
10
In addition, the competitive environment for leasing is affected considerably by a number of factors including, among other things, changes due to economic factors such as supply and demand. These factors may make it difficult for us to lease existing vacant space and space associated with future lease expirations at rental rates that are sufficient to meeting our short-term capital needs.
We rely on the ability of our tenants to pay rent and would be harmed by their inability to do so. Our performance depends on the ability of our tenants to fulfill their lease obligations by paying their rental payments in a timely manner. If one or more of our major tenants, or a number of our smaller tenants, were to experience financial difficulties, including bankruptcy, insolvency, government shutdown, or general downturn of business, there could be an adverse effect on financial position, results of operations, cash flows and ability to make expected distributions to our shareholders.
We may be adversely affected by developments concerning some of our major tenants and sector concentrations, including shutdowns of the United States Government and actual, or potential, reductions in government spending targeting tenants in the United States Government and defense information technology sectors. As of December 31, 2011, our 20 largest tenants accounted for 60.3% of the total annualized rental revenue of our office properties, and the four largest of these tenants accounted for 65% of that total. We computed the annualized rental revenue by multiplying by 12 the sum of monthly contractual base rents and estimated monthly expense reimbursements under active leases in our portfolio of office properties as of December 31, 2011. Information regarding our four largest tenants is set forth below:
Tenant
|
Annualized Rental Revenue at December 31, 2011 |
Percentage of Total Annualized Rental Revenue of Office Properties |
Number of Leases |
|||||||
|---|---|---|---|---|---|---|---|---|---|---|
| |
(in thousands) |
|
|
|||||||
United States of America |
$ | 104,517 | 22.2 | % | 79 | |||||
Northrop Grumman Corporation(1) |
32,326 | 6.9 | % | 17 | ||||||
Booz Allen Hamilton, Inc. |
24,178 | 5.1 | % | 8 | ||||||
Computer Sciences Corporation(1) |
22,355 | 4.8 | % | 7 | ||||||
Most of our leases with the United States Government provide for a series of one-year terms or provide for early termination rights. The United States Government may terminate its leases if, among other reasons, the United States Congress fails to provide funding. If any of our four largest tenants fail to make rental payments to us, including as a result of a government shutdown, or if the United States Government elects to terminate some or all of its leases and the space cannot be re-leased on satisfactory terms, there would be an adverse effect on our financial performance and ability to make distributions to our shareholders.
As of December 31, 2011, our properties that were occupied primarily by tenants in the United States Government and defense information technology sectors accounted for 59.9% of the total annualized rental revenue of our office properties. We expect to increase our reliance on these sectors for revenue. A reduction in government spending targeting these sectors could affect the ability of these tenants to fulfill lease obligations, decrease the likelihood that these tenants will renew their leases or enter into new leases and limit our future growth from these sectors. Moreover, uncertainty regarding the potential for future reduction in government spending targeting these sectors could also decrease or delay leasing activity from tenants in these sectors. The Budget Control Act passed in 2011, which imposed caps on the Federal budget in order to achieve targeted spending levels over the 2013-2021 fiscal years, has fueled further uncertainty regarding future government spending reductions. A reduction in government spending targeting the United States Government and defense information technology sectors and/or uncertainty regarding the potential for future spending reductions could have
11
an adverse effect on our results of operations, financial condition, cash flows and ability to make distributions to our shareholders.
We generally classify the revenue from our leases into this sector grouping based solely on our management's knowledge of the tenants' operations in leased space. Occasionally, classifications require subjective and complex judgments. We do not use independent sources such as Standard Industrial Classification codes for classifying our revenue into sector groupings and if we did, the resulting groupings would be materially different.
We may be unable to successfully execute plans to dispose of properties, such as our Strategic Reallocation Plan. In 2011, we implemented our Strategic Reallocation Plan to dispose of office properties and land that are no longer closely aligned with our strategy. We expect to complete the office property dispositions by the end of 2013 and use the proceeds to invest in properties that will serve customers in the United States Government, defense information technology and related data sectors, to repay borrowings and for general corporate purposes. Current economic conditions overall, and for suburban office properties in particular, could make it difficult for us to locate buyers for the properties on favorable terms, if at all. We also do not have significant experience in completing property disposition plans of the scale contemplated under the Strategic Reallocation Plan. Our failure to successfully execute the Strategic Reallocation Plan, and other similar property disposition plans, could adversely affect our ability to effectively execute our business strategy, which in turn could affect our financial position, results of operations, cash flows and ability to make expected distributions to shareholders.
We may suffer adverse consequences due to our inexperience in developing, managing and leasing wholesale data centers. We have significant experience in developing, managing and leasing single user data center space. However, we do not have the same depth and length of experience in relation to wholesale data centers, having acquired our one existing wholesale data center in 2010 and having completed no new leasing on that center through December 31, 2011. This may increase the likelihood of us being unsuccessful in executing our plans with respect to our existing wholesale data center or any such centers that we may acquire or develop in the future. If we are unsuccessful in executing our wholesale data center plans, it could adversely affect our financial position, results of operations, cash flows and ability to make expected distributions to our shareholders.
Most of our properties are geographically concentrated in the Mid-Atlantic region, particularly in the Greater Washington, DC/Baltimore region, or in particular office parks. We may suffer economic harm in the event of a decline in the real estate market or general economic conditions in those regions or parks. Most of our properties are located in the Mid-Atlantic region of the United States and, as of December 31, 2011, our properties located in the Greater Washington, DC/Baltimore region accounted for a combined 84.7% of our total annualized rental revenue from office properties. Our properties are also typically concentrated in office parks in which we own most of the properties. Consequently, we do not have a broad geographic distribution of our properties. As a result, a decline in the real estate market or general economic conditions in the Mid-Atlantic region, the Greater Washington, DC region or the office parks in which our properties are located could have an adverse effect on our financial position, results of operations, cash flows and ability to make expected distributions to our shareholders.
We would suffer economic harm if we were unable to renew our leases on favorable terms. When leases expire, our tenants may not renew or may renew on terms less favorable to us than the terms of their original leases. If a tenant vacates a property, we can expect to experience a vacancy for some period of time, as well as incur higher leasing costs than we would likely incur if a tenant renews. As a result, our financial performance and ability to make expected distributions to our shareholders could be adversely affected if we experience a high volume of tenant departures at the end of their lease terms.
12
We may be adversely affected by trends in the office real estate industry. Some businesses are rapidly evolving to make employee telecommuting, flexible work schedules, open workplaces and teleconferencing increasingly common. These practices enable businesses to reduce their space requirements. A continuation of the movement towards these practices could over time erode the overall demand for office space and, in turn, place downward pressure on occupancy, rental rates and property valuations, each of which could have an adverse effect on our financial position, results of operations, cash flows and ability to make expected distributions to our shareholders.
We may encounter a decline in the value of our real estate. The value of our real estate could be adversely affected by general economic and market conditions connected to a specific property, a market or submarket, a broader economic region or the office real estate industry. Examples of such conditions include a broader economic recession, declining demand and decreases in market rental rates and/or market values of real estate assets. If our real estate assets decline in value, it could result in our recognition of impairment losses. Moreover, a decline in the value of our real estate could adversely affect the amount of borrowings available to us under credit facilities and other loans, which could, in turn, adversely affect our cash flows and financial condition.
We may not be able to compete successfully with other entities that operate in our industry. The commercial real estate market is highly competitive. We compete for the purchase of commercial property with many entities, including other publicly traded commercial REITs. Many of our competitors have substantially greater financial resources than we do. If our competitors prevent us from buying properties that we target for acquisition, we may not be able to meet our property acquisition goals. Moreover, numerous commercial properties compete for tenants with our properties. Some of the properties competing with ours may be newer or in more desirable locations, or the competing properties' owners may be willing to accept lower rates than are acceptable to us. Competition for property acquisitions, or for tenants for properties that we own, could have an adverse effect on our financial position, results of operations, cash flows and ability to make expected distributions to our shareholders.
We are dependent on external sources of capital for future growth. Because we are a REIT, we must distribute at least 90% of our annual taxable income to our shareholders. Due to this requirement, we are not able to significantly fund our acquisition, construction and development activities using cash flow from operations. Therefore, our ability to fund these activities is dependent on our ability to access capital funded by third parties. Such capital could be in the form of new debt, equity issuances of common shares, preferred shares, common and preferred units in our Operating Partnership or joint venture funding. These capital sources may not be available on favorable terms or at all. Moreover, additional debt financing may substantially increase our leverage and subject us to covenants that restrict management's flexibility in directing our operations, and additional equity offerings may result in substantial dilution of our shareholders' interests. Our inability to obtain capital when needed could have a material adverse effect on our ability to expand our business and fund other cash requirements.
We use our Revolving Credit Facility to initially finance much of our investing and financing activities. We also use other credit facilities to fund a significant portion of our construction activities. Our lenders under these and other facilities could, for financial hardship or other reasons, fail to honor their commitments to fund our requests for borrowings under these facilities. In the event that one or more lenders under these facilities are not able or willing to fund a borrowing request, it would adversely affect our ability to access borrowing capacity under these facilities, which would in turn adversely affect our financial condition, cash flows and ability to make expected distributions to our shareholders.
We may be unable to successfully execute our plans to acquire existing commercial real estate properties. We intend to acquire existing commercial real estate properties to the extent that suitable
13
acquisitions can be made on advantageous terms. Acquisitions of commercial properties entail risks, such as the risks that we may not be in a position, or have the opportunity in the future, to make suitable property acquisitions on advantageous terms and/or that such acquisitions will fail to perform as expected. The failure of our acquisitions to perform as expected could adversely affect our financial position, results of operations, cash flows and ability to make expected distributions to our shareholders.
We may be exposed to unknown liabilities from acquired properties. We may acquire properties that are subject to liabilities in situations where we have no recourse, or only limited recourse, against the prior owners or other third parties with respect to unknown liabilities. As a result, if a liability were asserted against us based upon ownership of those properties, we might have to pay substantial sums to settle or contest it, which could adversely affect our results of operations and cash flow. Examples of unknown liabilities with respect to acquired properties include, but are not limited to:
We may suffer economic harm as a result of making unsuccessful acquisitions in new markets. We may pursue selective acquisitions of properties in regions where we have not previously owned properties. These acquisitions may entail risks in addition to those we face in other acquisitions where we are familiar with the regions, such as the risk that we do not correctly anticipate conditions or trends in a new market and are therefore not able to operate the acquired property profitably. If this occurs, it could adversely affect our financial position, results of operations, cash flows and ability to make expected distributions to our shareholders.
We may be unable to execute our plans to develop and construct additional properties. Although the majority of our investments are in currently leased properties, we also develop, construct and redevelop properties, including some that are not fully pre-leased. When we develop, construct and redevelop properties, we assume the risk that actual costs will exceed our budgets, that we will experience conditions which delay or preclude project completion and that projected leasing will not occur, any of which could adversely affect our financial performance, results of operations and our ability to make distributions to our shareholders. In addition, we generally do not obtain construction financing commitments until the development stage of a project is complete and construction is about to commence. We may find that we are unable to obtain financing needed to continue with the construction activities for such projects.
Our data centers may become obsolete. Data centers are much more expensive investments on a per square foot basis than office properties due to the level of infrastructure required to operate the centers. At the same time, technology, industry standards and service requirements for data centers are rapidly evolving and, as a result, the risk of investments we make in data centers becoming obsolete is higher than office properties. Our data centers may become obsolete due to the development of new systems to deliver power to or eliminate heat from the servers housed in the properties. Our data centers could also become obsolete from new server technology that requires less critical load and heat removal than our facilities are designed to provide. In addition, we may not be able to efficiently upgrade or change power and cooling systems to meet new demands or industry standards without incurring significant costs that we may not be able to pass on to our tenants. The obsolescence of our data centers could adversely affect our financial position, results of operations, cash flows and ability to make expected distributions to our shareholders.
14
Certain of our properties containing data centers contain space not suitable for lease other than as data centers, which could make it difficult or impractical to reposition them for alternative use. Certain of our properties contain data center space, which is highly specialized space containing extensive electrical and mechanical systems that are designed uniquely to run and maintain banks of computer servers. As a result, in the event that we needed to reposition such data center space for another use, major renovations and expenditures could be required.
Real estate investments are illiquid, and we may not be able to sell our properties on a timely basis when we determine it is appropriate to do so. Real estate investments can be difficult to sell and convert to cash quickly, especially if market conditions are not favorable, and we may find that to be increasingly the case under the current economic conditions due to a lack of credit availability for potential buyers. Such illiquidity could limit our ability to quickly change our portfolio of properties in response to changes in economic or other conditions. Moreover, under certain circumstances, the Internal Revenue Code imposes certain penalties on a REIT that sells property held for less than two years and limits the number of properties it can sell in a given year. In addition, for certain of our properties that we acquired by issuing units in our Operating Partnership, we are restricted by agreements with the sellers of the properties for a certain period of time from entering into transactions (such as the sale or refinancing of the acquired property) that will result in a taxable gain to the sellers without the seller's consent. Due to these factors, we may be unable to sell a property at an advantageous time.
We may suffer adverse effects as a result of the indebtedness that we carry and the terms and covenants that relate to this debt. Some of our properties are pledged by us to support repayment on indebtedness. In addition, we rely on borrowings to fund some or all of the costs of new property acquisitions, construction and development activities and other items. Our organizational documents do not limit the amount of indebtedness that we may incur.
Payments of principal and interest on our debt may leave us with insufficient cash to operate our properties or pay distributions to our shareholders required to maintain our qualification as a REIT. We are also subject to the risks that:
Some of our debt is cross-defaulted, which means that failure to pay interest or principal on the debt above a threshold value will create a default on certain of our other debt. In addition, some of our debt which is cross-defaulted also contains cross-collateralization provisions, which means that the collateral of the debt can also be used as collateral for certain of our other debt. Any foreclosure of our properties could result in loss of income and asset value that would negatively affect our financial condition, results of operations, cash flows and ability to make expected distributions to our shareholders. In addition, if we are in default and the value of the properties securing a loan is less than the loan balance, we may be required to pay the resulting shortfall to the lender using other assets.
If short-term interest rates were to rise, our debt service payments on debt with variable interest rates would increase, which would lower our net income and could decrease our distributions to our
15
shareholders. We use interest rate swap agreements from time to time to reduce the impact of changes in interest rates. Decreases in interest rates would result in increased interest payments due under interest rate swap agreements in place and, in the event we decided to unwind such agreements, could result in our recognizing a loss and remitting a payment.
We must refinance our debt in the future. As of December 31, 2011, our scheduled debt payments over the next five years, including maturities, were as follows:
Year
|
Amount(1) | |||
|---|---|---|---|---|
| |
(in thousands) |
|||
2012 |
$ | 66,063 | ||
2013 |
163,003 | |||
2014 |
820,780 | |||
2015 |
806,104 | |||
2016 |
278,642 | |||
Our operations likely will not generate enough cash flow to repay some or all of this debt without additional borrowings, equity issuances and/or property sales. If we cannot refinance our debt, extend the repayment dates, or raise additional equity prior to the dates when our debt matures, we would default on our existing debt, which would have an adverse effect on our financial position, results of operations, cash flows and ability to make expected distributions to our shareholders.
We have certain distribution requirements that reduce cash available for other business purposes. As a REIT, we must distribute at least 90% of our annual taxable income (excluding capital gains), which limits the amount of cash we can retain for other business purposes, including amounts to fund acquisitions and development activity. Also, it is possible that because of the differences between the time we actually receive revenue or pay expenses and the period during which we report those items for distribution purposes, we may have to borrow funds to meet the 90% distribution requirement.
We may be unable to continue to make shareholder distributions at expected levels. We declared a first quarter 2012 common share dividend to shareholders of record on March 31, 2012 of $0.275 per share, a 33% decrease from the fourth quarter 2011 dividend of $0.4125 per share, and expect to continue to pay dividends at this reduced rate at least through the remainder of 2012. We expect to make regular quarterly cash distributions to our shareholders. However, our ability to make such distributions depends on a number of factors, some of which are beyond our control. Some of our loan agreements contain provisions that could restrict future distributions. Our ability to make distributions at expected levels will also be dependent, in part, on other matters, including, but not limited to:
16
In addition, we can make distributions to the holders of our common shares only after we make preferential distributions to holders of our preferred shares.
Our ability to pay dividends may be limited, and we cannot provide assurance that we will be able to pay dividends regularly. Because we conduct substantially all of our operations through our Operating Partnership, our ability to pay dividends will depend almost entirely on payments and distributions received on our interests in our Operating Partnership, the payment of which depends in turn on our ability to operate profitably and generate cash flow from our operations. We cannot guarantee that we will be able to pay dividends on a regular quarterly basis in the future. Additionally, the terms of some of the debt to which our Operating Partnership is a party limit its ability to make some types of payments and other distributions to us. This in turn limits our ability to make some types of payments, including payment of dividends on common or preferred shares, unless we meet certain financial tests or such payments or dividends are required to maintain our qualification as a REIT. As a result, if we are unable to meet the applicable financial tests, we may not be able to pay dividends on our shares in one or more periods. Furthermore, any new shares of beneficial interest issued will substantially increase the cash required to continue to pay cash dividends at current levels. Any common or preferred shares that may in the future be issued for financing acquisitions, share-based compensation arrangements or otherwise would have a similar effect.
We may incur additional indebtedness, which may harm our financial position and cash flow and potentially impact our ability to pay dividends on any series of preferred shares. Our governing documents do not limit us from incurring additional indebtedness and other liabilities. As of December 31, 2011, we had $2.4 billion of indebtedness outstanding. We may incur additional indebtedness and become more highly leveraged, which could harm our financial position and potentially limit our cash available to pay dividends. As a result, we may not have sufficient funds remaining to satisfy our dividend obligations relating to any series of preferred shares if we incur additional indebtedness.
Our ability to pay dividends on preferred shares is further limited by the requirements of Maryland law. As a Maryland REIT, we may not under applicable Maryland law make a distribution if either of the following conditions exist after giving effect to the distribution: (1) the REIT would not be able to pay its debts as the debts become due in the usual course of business; or (2) the REIT's total assets would be less than the sum of its total liabilities plus the amount that would be needed, if the REIT were dissolved at the time of the distribution, to satisfy the preferential rights upon dissolution of shareholders whose preferential rights are superior to those receiving the distribution. Therefore, we may not make a distribution on any series of preferred shares if either of the above described conditions exists after giving effect to the distribution.
We may issue additional common or preferred shares that dilute our shareholders' interests. We may issue additional common shares and preferred shares without shareholder approval. Similarly, we may cause the Operating Partnership to issue its common or preferred units for contributions of cash or property without approval by the limited partners of the Operating Partnership or our shareholders. Our existing shareholders' interests could be diluted if such additional issuances were to occur.
We may suffer economic harm as a result of the actions of our partners in real estate joint ventures and other investments. We invest in certain entities in which we are not the exclusive investor or principal decision maker. Investments in such entities may, under certain circumstances, involve risks not present when a third party is not involved, including the possibility that the other parties to these investments might become bankrupt or fail to fund their share of required capital contributions. Our partners in these entities may have economic, tax or other business interests or goals
17
which are inconsistent with our business interests or goals, and may be in a position to take actions contrary to our policies or objectives. Such investments may also lead to impasses, for example, as to whether to sell a property, because neither we nor the other parties to these investments may have full control over the entity. In addition, we may in certain circumstances be liable for the actions of the other parties to these investments. Each of these factors could have an adverse effect on our financial condition, results of operations, cash flows and ability to make expected distributions to our shareholders.
We may need to make additional cash outlays to protect our investment in loans we make that are subordinate to other loans. We have made and may in the future make loans under which we have a secured interest in the ownership of a property that is subordinate to other loans on the property. If a default were to occur under the terms of any such loans with us or under the first mortgage loans related to the properties on such loans, we may be in a position where, in order to protect our investment, we would need to either (1) purchase the other loan or (2) foreclose on the ownership interest in the property and repay the first mortgage loan, either of which could have an adverse effect on our financial condition, results of operations, cash flows and ability to make expected distributions to our shareholders.
We may be subject to possible environmental liabilities. We are subject to various Federal, state and local environmental laws, including air and water quality, hazardous or toxic substances and health and safety. These laws can impose liability on current and prior property owners or operators for the costs of removal or remediation of hazardous substances released on a property, even if the property owner was not responsible for, or even aware of, the release of the hazardous substances. Costs resulting from environmental liability could be substantial. The presence of hazardous substances on our properties may also adversely affect occupancy and our ability to sell or borrow against those properties. In addition to the costs of government claims under environmental laws, private plaintiffs may bring claims for personal injury or other reasons. Additionally, various laws impose liability for the costs of removal or remediation of hazardous substances at the disposal or treatment facility. Anyone who arranges for the disposal or treatment of hazardous substances at such a facility is potentially liable under such laws. These laws often impose liability on an entity even if the facility was not owned or operated by the entity.
Although most of our properties have been subject to varying degrees of environmental assessment, many of these assessments are limited in scope and may not include or identify all potential environmental liabilities or risks associated with the property. Identification of new compliance concerns or undiscovered areas of contamination, changes in the extent or known scope of contamination, discovery of additional sites, human exposure to the contamination or changes in cleanup or compliance requirements could result in significant costs to us that could have an adverse effect on our financial condition, results of operations, cash flows and ability to make expected distributions to our shareholders.
Terrorist attacks, such as those of September 11, 2001, may adversely affect the value of our properties, our financial position and cash flows. We have significant investments in properties located in large metropolitan areas and near military installations. Future terrorist attacks could directly or indirectly damage our properties or cause losses that materially exceed our insurance coverage. After such an attack, tenants in these areas may choose to relocate their businesses to areas of the United States that may be perceived to be less likely targets of future terrorist activity, and fewer customers may choose to patronize businesses in these areas. This in turn would trigger a decrease in the demand for space in these areas, which could increase vacancies in our properties and force us to lease space on less favorable terms. As a result, the occurrence of terrorist attacks could adversely affect our financial position, results of operations, cash flows and ability to make expected distributions to our shareholders.
18
We may be subject to other possible liabilities that would adversely affect our financial position and cash flows. Our properties may be subject to other risks related to current or future laws, including laws benefiting disabled persons, state or local laws relating to zoning, construction, fire and life safety requirements and other matters. These laws may require significant property modifications in the future and could result in the levy of fines against us. In addition, although we believe that we adequately insure our properties, we are subject to the risk that our insurance may not cover all of the costs to restore a property that is damaged by a fire or other catastrophic events, including acts of war or, as mentioned above, terrorism. The occurrence of any of these events could have an adverse effect on our financial condition, results of operations, cash flows and ability to make expected distributions to our shareholders.
We may be subject to increased costs of insurance and limitations on coverage, particularly regarding acts of terrorism. Our portfolio of properties is insured for losses under our property, casualty and umbrella insurance policies through September 30, 2012. These policies include coverage for acts of terrorism. Future changes in the insurance industry's risk assessment approach and pricing structure may increase the cost of insuring our properties and decrease the scope of insurance coverage, either of which could adversely affect our financial position and operating results. Most of our loan agreements contain customary covenants requiring us to maintain insurance. Although we believe that we have adequate insurance coverage for purposes of these agreements, we may not be able to obtain an equivalent amount of coverage at reasonable costs, or at all, in the future. In addition, if lenders insist on greater coverage than we are able to obtain, it could adversely affect our ability to finance and/or refinance our properties and execute our growth strategies, which, in turn, would have an adverse effect on our financial condition, results of operations, cash flows and ability to make expected distributions to our shareholders.
Our business could be adversely affected by a negative audit by the United States Government. Agencies of the United States, including the Defense Contract Audit Agency and various agency Inspectors General, routinely audit and investigate government contractors. These agencies review a contractor's performance under its contracts, cost structure and compliance with applicable laws, regulations, and standards. The United States Government also reviews the adequacy of, and a contractor's compliance with, its internal control systems and policies. Any costs found to be misclassified may be subject to repayment. If an audit or investigation uncovers improper or illegal activities, we may be subject to civil or criminal penalties and administrative sanctions, including termination of contracts, forfeiture of profits, suspension of payments, fines, and suspension or prohibition from doing business with the United States Government. In addition, we could suffer serious reputational harm if allegations of impropriety were made against us.
Our ownership limits are important factors. Our Declaration of Trust limits ownership of our common shares by any single shareholder to 9.8% of the number of the outstanding common shares or 9.8% of the value of the outstanding common shares, whichever is more restrictive. Our Declaration of Trust also limits ownership by any single shareholder of our common and preferred shares in the aggregate to 9.8% of the aggregate value of the outstanding common and preferred shares. We call these restrictions the "Ownership Limit." Our Declaration of Trust allows our Board of Trustees to exempt shareholders from the Ownership Limit. The Ownership Limit and the restrictions on ownership of our common shares may delay or prevent a transaction or a change of control that might involve a premium price for our common shares or otherwise be in the best interest of our shareholders.
Our Declaration of Trust includes other provisions that may prevent or delay a change of control. Subject to the requirements of the New York Stock Exchange, our Board of Trustees has the authority, without shareholder approval, to issue additional securities on terms that could delay or prevent a change in control. In addition, our Board of Trustees has the authority to reclassify any of our unissued
19
common shares into preferred shares. Our Board of Trustees may issue preferred shares with such preferences, rights, powers and restrictions as our Board of Trustees may determine, which could also delay or prevent a change in control.
The Maryland business statutes impose potential restrictions that may discourage a change of control of our company. Various Maryland laws may have the effect of discouraging offers to acquire us, even if the acquisition would be advantageous to shareholders. Resolutions adopted by our Board of Trustees and/or provisions of our bylaws exempt us from such laws, but our Board of Trustees can alter its resolutions or change our bylaws at any time to make these provisions applicable to us.
Our failure to qualify as a REIT would have adverse tax consequences, which would substantially reduce funds available to make distributions to our shareholders. We believe that since 1992 we have qualified for taxation as a REIT for Federal income tax purposes. We plan to continue to meet the requirements for taxation as a REIT. Many of these requirements, however, are highly technical and complex. The determination that we are a REIT requires an analysis of various factual matters and circumstances that may not be totally within our control. For example, to qualify as a REIT, at least 95% of our gross income must come from certain sources that are specified in the REIT tax laws. We are also required to distribute to shareholders at least 90% of our REIT taxable income (excluding capital gains). The fact that we hold most of our assets through our Operating Partnership and its subsidiaries further complicates the application of the REIT requirements. Even a technical or inadvertent mistake could jeopardize our REIT status. Furthermore, Congress and the Internal Revenue Service might make changes to the tax laws and regulations and the courts might issue new rulings that make it more difficult or impossible for us to remain qualified as a REIT.
If we fail to qualify as a REIT, we would be subject to Federal income tax at regular corporate rates. Also, unless the Internal Revenue Service granted us relief under certain statutory provisions, we would remain disqualified as a REIT for four years following the year we first fail to qualify. If we fail to qualify as a REIT, we would have to pay significant income taxes and would therefore have less money available for investments or for distributions to our shareholders. In addition, if we fail to qualify as a REIT, we will no longer be required to pay dividends. As a result of all these factors, our failure to qualify as a REIT could impair our ability to expand our business and raise capital and would likely have a significant adverse effect on the value of our securities.
We could face possible adverse changes in tax laws, which may result in an increase in our tax liability. From time to time changes in state and local tax laws or regulations are enacted, which may result in an increase in our tax liability. The shortfall in tax revenues for states and municipalities in recent years may lead to an increase in the frequency and size of such changes. If such changes occur, we may be required to pay additional taxes on our assets or income. These increased tax costs could adversely affect our financial condition and results of operations and the amount of cash available for payment of dividends.
A number of factors could cause our security prices to decline. As is the case with any publicly-traded securities, certain factors outside of our control could influence the value of our common and preferred shares. These conditions include, but are not limited to:
20
We may experience significant losses and harm to our financial condition if financial institutions holding our cash and cash equivalents file for bankruptcy protection. We believe that we maintain our cash and cash equivalents with high quality financial institutions. We have not experienced any losses to date on our deposited cash. However, we may incur significant losses and harm to our financial condition in the future if any of these financial institutions files for bankruptcy protection.
Certain of our Trustees have potential conflicts of interest. Certain members of our Board of Trustees own partnership units in our Operating Partnership. These individuals may have personal interests that conflict with the interests of our shareholders. For example, if our Operating Partnership sells or refinances certain of the properties that these Trustees contributed to the Operating Partnership, the Trustees could suffer adverse tax consequences. Their personal interests could conflict with our interests if such a sale or refinancing would be advantageous to us. We have certain policies in place that are designed to minimize conflicts of interest. We cannot, however, provide assurance that these policies will be successful in eliminating the influence of such conflicts, and if they are not successful, decisions could be made that might fail to reflect fully the interests of all of our shareholders.
Item 1B. Unresolved Staff Comments
None
21
The following table provides certain information about our office properties as of December 31, 2011:
Property and Location
|
Submarket | Year Built/ Renovated |
Rentable Square Feet |
Occupancy(1) | Annualized Rental Revenue(2) |
Annualized Rental Revenue per Occupied Square Foot(2)(3) |
||||||||||||
|---|---|---|---|---|---|---|---|---|---|---|---|---|---|---|---|---|---|---|
Baltimore/Washington Corridor: |
||||||||||||||||||
2730 Hercules Road |
National Business Park | 1990 | 238,007 | 100.0 | % | $ | 8,745,038 | $ | 36.74 | |||||||||
Annapolis Junction, MD |
||||||||||||||||||
300 Sentinel Drive |
National Business Park | 2009 | 193,296 | 98.6 | % | 6,205,914 | 32.57 | |||||||||||
Annapolis Junction, MD |
||||||||||||||||||
304 Sentinel Drive |
National Business Park | 2005 | 162,483 | 100.0 | % | 5,149,530 | 31.69 | |||||||||||
Annapolis Junction, MD |
||||||||||||||||||
2720 Technology Drive |
National Business Park | 2004 | 158,929 | 100.0 | % | 5,289,305 | 33.28 | |||||||||||
Annapolis Junction, MD |
||||||||||||||||||
306 Sentinel Drive |
National Business Park | 2006 | 155,367 | 100.0 | % | 4,838,585 | 31.14 | |||||||||||
Annapolis Junction, MD |
||||||||||||||||||
302 Sentinel Drive |
National Business Park | 2007 | 153,566 | 99.6 | % | 5,250,120 | 34.34 | |||||||||||
Annapolis Junction, MD |
||||||||||||||||||
2711 Technology Drive |
National Business Park | 2002 | 152,209 | 100.0 | % | 5,013,808 | 32.94 | |||||||||||
Annapolis Junction, MD |
||||||||||||||||||
308 Sentinel Drive |
National Business Park | 2010 | 151,207 | 100.0 | % | 5,002,689 | 33.09 | |||||||||||
Annapolis Junction, MD |
||||||||||||||||||
318 Sentinel Drive |
National Business Park | 2005 | 125,635 | 100.0 | % | 4,385,786 | 34.91 | |||||||||||
Annapolis Junction, MD |
||||||||||||||||||
322 Sentinel Drive |
National Business Park | 2006 | 125,487 | 100.0 | % | 5,064,611 | 40.36 | |||||||||||
Annapolis Junction, MD |
||||||||||||||||||
320 Sentinel Drive |
National Business Park | 2007 | 125,325 | 100.0 | % | 5,058,121 | 40.36 | |||||||||||
Annapolis Junction, MD |
||||||||||||||||||
316 Sentinel Way |
National Business Park | 2011 | 125,150 | 0.0 | % | — | — | |||||||||||
Annapolis Junction, MD |
||||||||||||||||||
324 Sentinel Way |
National Business Park | 2010 | 125,118 | 100.0 | % | 3,638,688 | 29.08 | |||||||||||
Annapolis Junction, MD |
||||||||||||||||||
140 National Business Parkway |
National Business Park | 2003 | 119,466 | 100.0 | % | 4,219,827 | 35.32 | |||||||||||
Annapolis Junction, MD |
||||||||||||||||||
132 National Business Parkway |
National Business Park | 2000 | 118,150 | 100.0 | % | 3,906,628 | 33.06 | |||||||||||
Annapolis Junction, MD |
||||||||||||||||||
2721 Technology Drive |
National Business Park | 2000 | 117,242 | 100.0 | % | 3,821,020 | 32.59 | |||||||||||
Annapolis Junction, MD |
||||||||||||||||||
2701 Technology Drive |
National Business Park | 2001 | 117,068 | 100.0 | % | 3,833,914 | 32.75 | |||||||||||
Annapolis Junction, MD |
||||||||||||||||||
2691 Technology Drive |
National Business Park | 2005 | 103,578 | 100.0 | % | 3,588,956 | 34.65 | |||||||||||
Annapolis Junction, MD |
||||||||||||||||||
134 National Business Parkway |
National Business Park | 1999 | 92,327 | 100.0 | % | 2,982,958 | 32.31 | |||||||||||
Annapolis Junction, MD |
||||||||||||||||||
133 National Business Parkway |
National Business Park | 1997 | 88,057 | 100.0 | % | 2,883,341 | 32.74 | |||||||||||
Annapolis Junction, MD |
||||||||||||||||||
141 National Business Parkway |
National Business Park | 1990 | 87,364 | 100.0 | % | 2,760,773 | 31.60 | |||||||||||
Annapolis Junction, MD |
||||||||||||||||||
135 National Business Parkway |
National Business Park | 1998 | 86,437 | 100.0 | % | 3,023,246 | 34.98 | |||||||||||
Annapolis Junction, MD |
||||||||||||||||||
131 National Business Parkway |
National Business Park | 1990 | 69,702 | 100.0 | % | 2,291,554 | 32.88 | |||||||||||
Annapolis Junction, MD |
||||||||||||||||||
430 National Business Pkwy |
National Business Park | 2011 | 61,299 | 100.0 | % | 2,094,317 | 34.17 | |||||||||||
Annapolis Junction, MD |
||||||||||||||||||
114 National Business Parkway |
National Business Park | 2002 | 10,113 | 100.0 | % | 234,857 | 23.22 | |||||||||||
Annapolis Junction, MD |
||||||||||||||||||
314 Sentinel Way |
National Business Park | 2008 | 4,462 | 100.0 | % | 237,872 | 53.31 | |||||||||||
Annapolis Junction, MD |
||||||||||||||||||
22
Property and Location
|
Submarket | Year Built/ Renovated |
Rentable Square Feet |
Occupancy(1) | Annualized Rental Revenue(2) |
Annualized Rental Revenue per Occupied Square Foot(2)(3) |
||||||||||||
|---|---|---|---|---|---|---|---|---|---|---|---|---|---|---|---|---|---|---|
7740 Milestone Parkway(4) |
Arundel Preserve | 2009 | 144,610 | 6.0 | % | 283,691 | 32.77 | |||||||||||
Hanover, MD |
||||||||||||||||||
1550 West Nursery Road |
Airport Square | 2009 | 161,689 | 100.0 | % | 3,457,038 | 21.38 | |||||||||||
Linthicum, MD |
||||||||||||||||||
1306 Concourse Drive |
Airport Square | 1990 | 116,259 | 66.3 | % | 1,853,742 | 24.05 | |||||||||||
Linthicum, MD |
||||||||||||||||||
870 Elkridge Landing Road |
Airport Square | 1981 | 105,456 | 100.0 | % | 2,506,436 | 23.77 | |||||||||||
Linthicum, MD |
||||||||||||||||||
920 Elkridge Landing Road |
Airport Square | 1982 | 103,415 | 100.0 | % | 2,010,637 | 19.44 | |||||||||||
Linthicum, MD |
||||||||||||||||||
1304 Concourse Drive |
Airport Square | 2002 | 101,124 | 79.0 | % | 2,152,439 | 26.95 | |||||||||||
Linthicum, MD |
||||||||||||||||||
900 Elkridge Landing Road |
Airport Square | 1982 | 101,005 | 100.0 | % | 2,447,840 | 24.23 | |||||||||||
Linthicum, MD |
||||||||||||||||||
1199 Winterson Road |
Airport Square | 1988 | 100,104 | 100.0 | % | 2,741,631 | 27.39 | |||||||||||
Linthicum, MD |
||||||||||||||||||
1302 Concourse Drive |
Airport Square | 1996 | 83,717 | 78.5 | % | 1,748,380 | 26.61 | |||||||||||
Linthicum, MD |
||||||||||||||||||
881 Elkridge Landing Road |
Airport Square | 1986 | 75,385 | 100.0 | % | 2,005,117 | 26.60 | |||||||||||
Linthicum, MD |
||||||||||||||||||
1099 Winterson Road |
Airport Square | 1988 | 71,675 | 34.8 | % | 580,362 | 23.28 | |||||||||||
Linthicum, MD |
||||||||||||||||||
849 International Drive |
Airport Square | 1988 | 69,018 | 70.7 | % | 1,276,037 | 26.14 | |||||||||||
Linthicum, MD |
||||||||||||||||||
1190 Winterson Road |
Airport Square | 1987 | 69,016 | 100.0 | % | 1,838,589 | 26.64 | |||||||||||
Linthicum, MD |
||||||||||||||||||
911 Elkridge Landing Road |
Airport Square | 1985 | 68,373 | 100.0 | % | 1,610,324 | 23.55 | |||||||||||
Linthicum, MD |
||||||||||||||||||
1201 Winterson Road |
Airport Square | 1985 | 67,903 | 100.0 | % | 1,485,615 | 21.88 | |||||||||||
Linthicum, MD |
||||||||||||||||||
999 Corporate Boulevard |
Airport Square | 2000 | 67,083 | 34.8 | % | 603,933 | 25.83 | |||||||||||
Linthicum, MD |
||||||||||||||||||
891 Elkridge Landing Road |
Airport Square | 1984 | 57,987 | 80.0 | % | 1,277,213 | 27.52 | |||||||||||
Linthicum, MD |
||||||||||||||||||
901 Elkridge Landing Road |
Airport Square | 1984 | 57,872 | 51.7 | % | 870,301 | 29.09 | |||||||||||
Linthicum, MD |
||||||||||||||||||
900 International Drive |
Airport Square | 1986 | 57,140 | 100.0 | % | 920,936 | 16.12 | |||||||||||
Linthicum, MD |
||||||||||||||||||
930 International Drive |
Airport Square | 1986 | 56,685 | 99.8 | % | 1,090,061 | 19.27 | |||||||||||
Linthicum, MD |
||||||||||||||||||
800 International Drive |
Airport Square | 1988 | 56,585 | 59.9 | % | 760,515 | 22.43 | |||||||||||
Linthicum, MD |
||||||||||||||||||
921 Elkridge Landing Road |
Airport Square | 1983 | 56,452 | 0.0 | % | — | — | |||||||||||
Linthicum, MD |
||||||||||||||||||
938 Elkridge Landing Road |
Airport Square | 1984 | 56,270 | 100.0 | % | 1,269,166 | 22.55 | |||||||||||
Linthicum, MD |
||||||||||||||||||
939 Elkridge Landing Road |
Airport Square | 1983 | 54,224 | 86.9 | % | 834,431 | 17.71 | |||||||||||
Linthicum, MD |
||||||||||||||||||
5520 Research Park Drive |
UMBC | 2009 | 103,333 | 91.0 | % | 2,378,463 | 25.31 | |||||||||||
Catonsville, MD |
||||||||||||||||||
5522 Research Park Drive |
UMBC | 2007 | 23,925 | 100.0 | % | 841,112 | 35.16 | |||||||||||
Catonsville, MD |
||||||||||||||||||
7467 Ridge Road |
BWI South | 1990 | 74,545 | 65.5 | % | 1,156,254 | 23.70 | |||||||||||
Hanover, MD |
||||||||||||||||||
7240 Parkway Drive |
BWI South | 1985 | 74,475 | 92.8 | % | 1,447,466 | 20.94 | |||||||||||
Hanover, MD |
||||||||||||||||||
7272 Park Circle Drive |
BWI South | 1991/1996 | 60,041 | 79.8 | % | 1,011,682 | 21.11 | |||||||||||
Hanover, MD |
||||||||||||||||||
23
Property and Location
|
Submarket | Year Built/ Renovated |
Rentable Square Feet |
Occupancy(1) | Annualized Rental Revenue(2) |
Annualized Rental Revenue per Occupied Square Foot(2)(3) |
||||||||||||
|---|---|---|---|---|---|---|---|---|---|---|---|---|---|---|---|---|---|---|
7318 Parkway Drive |
BWI South | 1984 | 59,204 | 100.0 | % | 1,372,041 | 23.17 | |||||||||||
Hanover, MD |
||||||||||||||||||
7320 Parkway Drive |
BWI South | 1983 | 56,964 | 0.0 | % | — | — | |||||||||||
Hanover, MD |
||||||||||||||||||
1340 Ashton Road |
BWI South | 1989 | 45,867 | 100.0 | % | 860,760 | 18.77 | |||||||||||
Hanover, MD |
||||||||||||||||||
1362 Mellon Road |
BWI South | 2006 | 43,232 | 86.5 | % | 865,221 | 23.14 | |||||||||||
Hanover, MD |
||||||||||||||||||
1334 Ashton Road |
BWI South | 1989 | 38,128 | 100.0 | % | 868,745 | 22.78 | |||||||||||
Hanover, MD |
||||||||||||||||||
1331 Ashton Road |
BWI South | 1989 | 28,906 | 29.1 | % | 150,416 | 17.87 | |||||||||||
Hanover, MD |
||||||||||||||||||
1341 Ashton Road |
BWI South | 1989 | 15,314 | 100.0 | % | 331,569 | 21.65 | |||||||||||
Hanover, MD |
||||||||||||||||||
1343 Ashton Road |
BWI South | 1989 | 9,903 | 100.0 | % | 140,047 | 14.14 | |||||||||||
Hanover, MD |
||||||||||||||||||
2500 Riva Road |
Annapolis | 2000 | 155,000 | 100.0 | % | 2,262,067 | 14.59 | |||||||||||
Annapolis, MD |
||||||||||||||||||
7125 Columbia Gateway Drive |
Howard County Perimeter | 1973/1999 | 479,976 | 70.1 | % | 6,522,562 | 19.40 | |||||||||||
9140 Route 108 |
Howard County Perimeter | 1974/1985 | 171,436 | 100.0 | % | 7,389,857 | 43.11 | |||||||||||
7200 Riverwood Road |
Howard County Perimeter | 1986 | 160,000 | 100.0 | % | 4,756,599 | 29.73 | |||||||||||
7000 Columbia Gateway Drive |
Howard County Perimeter | 1999 | 145,386 | 100.0 | % | 2,440,493 | 16.79 | |||||||||||
6721 Columbia Gateway Drive |
Howard County Perimeter | 2009 | 131,451 | 100.0 | % | 3,970,916 | 30.21 | |||||||||||
6711 Columbia Gateway Drive |
Howard County Perimeter | 2006 - 2007 | 124,048 | 100.0 | % | 3,654,044 | 29.46 | |||||||||||
6731 Columbia Gateway Drive |
Howard County Perimeter | 2002 | 123,576 | 87.5 | % | 3,152,831 | 29.17 | |||||||||||
6950 Columbia Gateway Drive |
Howard County Perimeter | 1998 | 112,861 | 100.0 | % | 2,344,172 | 20.77 | |||||||||||
6940 Columbia Gateway Drive |
Howard County Perimeter | 1999 | 108,652 | 81.0 | % | 2,434,265 | 27.66 | |||||||||||
7067 Columbia Gateway Drive |
Howard County Perimeter | 2001 | 85,393 | 98.3 | % | 2,042,058 | 24.33 | |||||||||||
8621 Robert Fulton Drive |
Howard County Perimeter | 2005 - 2006 | 83,734 | 100.0 | % | 1,919,859 | 22.93 | |||||||||||
6700 Alexander Bell Drive |
Howard County Perimeter | 1988 | 76,359 | 75.8 | % | 1,416,089 | 24.45 | |||||||||||
6750 Alexander Bell Drive |
Howard County Perimeter | 2001 | 75,328 | 86.4 | % | 1,774,692 | 27.27 | |||||||||||
6740 Alexander Bell Drive |
Howard County Perimeter | 1992 | 63,161 | 100.0 | % | 1,834,668 | 29.05 | |||||||||||
7015 Albert Einstein Drive |
Howard County Perimeter | 1999 | 62,216 | 100.0 | % | 1,309,964 | 21.06 | |||||||||||
7160 Riverwood Drive |
Howard County Perimeter | 2000 | 62,041 | 94.6 | % | 1,709,961 | 29.14 | |||||||||||
8671 Robert Fulton Drive |
Howard County Perimeter | 2002 | 55,688 | 100.0 | % | 916,624 | 16.46 | |||||||||||
6716 Alexander Bell Drive |
Howard County Perimeter | 1990 | 52,114 | 66.8 | % | 914,617 | 26.28 | |||||||||||
8661 Robert Fulton Drive |
Howard County Perimeter | 2002 | 48,666 | 100.0 | % | 970,805 | 19.95 | |||||||||||
7142 Columbia Gateway Drive |
Howard County Perimeter | 1994 | 47,668 | 100.0 | % | 735,841 | 15.44 | |||||||||||
24
Property and Location
|
Submarket | Year Built/ Renovated |
Rentable Square Feet |
Occupancy(1) | Annualized Rental Revenue(2) |
Annualized Rental Revenue per Occupied Square Foot(2)(3) |
||||||||||||
|---|---|---|---|---|---|---|---|---|---|---|---|---|---|---|---|---|---|---|
9020 Mendenhall Court |
Howard County Perimeter | 1982/2005 | 47,603 | 88.2 | % | 679,199 | 16.18 | |||||||||||
7130 Columbia Gateway Drive |
Howard County Perimeter | 1989 | 45,882 | 100.0 | % | 900,939 | 19.64 | |||||||||||
9140 Guilford Road |
Howard County Perimeter | 1983 | 40,288 | 55.8 | % | 343,054 | 15.25 | |||||||||||
7150 Riverwood Drive |
Howard County Perimeter | 2000 | 39,496 | 100.0 | % | 799,144 | 20.23 | |||||||||||
9720 Patuxent Woods Drive |
Howard County Perimeter | 1986/2001 | 39,480 | 100.0 | % | 727,532 | 18.43 | |||||||||||
6708 Alexander Bell Drive |
Howard County Perimeter | 1988 | 39,128 | 100.0 | % | 948,041 | 24.23 | |||||||||||
7065 Columbia Gateway Drive |
Howard County Perimeter | 2000 | 38,560 | 100.0 | % | 790,810 | 20.51 | |||||||||||
7138 Columbia Gateway Drive |
Howard County Perimeter | 1990 | 38,285 | 100.0 | % | 906,894 | 23.69 | |||||||||||
9740 Patuxent Woods Drive |
Howard County Perimeter | 1986/2001 | 37,520 | 100.0 | % | 581,409 | 15.50 | |||||||||||
9160 Guilford Road |
Howard County Perimeter | 1984 | 36,919 | 100.0 | % | 751,420 | 20.35 | |||||||||||
7063 Columbia Gateway Drive |
Howard County Perimeter | 2000 | 36,295 | 100.0 | % | 981,167 | 27.03 | |||||||||||
6760 Alexander Bell Drive |
Howard County Perimeter | 1991 | 36,227 | 64.4 | % | 538,056 | 23.06 | |||||||||||
7150 Columbia Gateway Drive |
Howard County Perimeter | 1991 | 34,734 | 85.0 | % | 604,614 | 20.49 | |||||||||||
9700 Patuxent Woods Drive |
Howard County Perimeter | 1986/2001 | 31,117 | 100.0 | % | 678,387 | 21.80 | |||||||||||
7061 Columbia Gateway Drive |
Howard County Perimeter | 2000 | 30,730 | 82.7 | % | 609,680 | 24.00 | |||||||||||
9730 Patuxent Woods Drive |
Howard County Perimeter | 1986/2001 | 30,495 | 78.1 | % | 407,350 | 17.09 | |||||||||||
6724 Alexander Bell Drive |
Howard County Perimeter | 2001 | 28,107 | 80.3 | % | 575,448 | 25.51 | |||||||||||
7170 Riverwood Drive |
Howard County Perimeter | 2000 | 27,891 | 41.4 | % | 187,906 | 16.29 | |||||||||||
7134 Columbia Gateway Drive |
Howard County Perimeter | 1990 | 21,931 | 0.0 | % | — | — | |||||||||||
9150 Guilford Road |
Howard County Perimeter | 1984 | 18,405 | 100.0 | % | 380,283 | 20.66 | |||||||||||
10280 Old Columbia Road |
Howard County Perimeter | 1988/2001 | 16,145 | 90.2 | % | 252,562 | 17.33 | |||||||||||
10270 Old Columbia Road |
Howard County Perimeter | 1988/2001 | 15,914 | 60.6 | % | 162,122 | 16.80 | |||||||||||
9710 Patuxent Woods Drive |
Howard County Perimeter | 1986/2001 | 14,778 | 72.2 | % | 202,964 | 19.02 | |||||||||||
9130 Guilford Road |
Howard County Perimeter | 1984 | 13,647 | 0.0 | % | — | — | |||||||||||
10290 Old Columbia Road |
Howard County Perimeter | 1988/2001 | 10,229 | 77.2 | % | 163,482 | 20.70 | |||||||||||
6741 Columbia Gateway Drive |
Howard County Perimeter | 2008 | 4,592 | 100.0 | % | 144,372 | 31.44 | |||||||||||
Subtotal/Average |
8,859,080 | 87.9 | % | $ | 214,359,486 | $ | 27.53 | |||||||||||
Northern Virginia: |
||||||||||||||||||
15000 Conference Center Drive |
Dulles South | 1989 | 444,869 | 85.3 | % | $ | 9,652,813 | $ | 25.42 | |||||||||
Chantilly, VA |
||||||||||||||||||
15010 Conference Center Drive |
Dulles South | 2006 | 220,906 | 100.0 | % | 7,296,046 | 33.03 | |||||||||||
Chantilly, VA |
||||||||||||||||||
25
Property and Location
|
Submarket | Year Built/ Renovated |
Rentable Square Feet |
Occupancy(1) | Annualized Rental Revenue(2) |
Annualized Rental Revenue per Occupied Square Foot(2)(3) |
||||||||||||
|---|---|---|---|---|---|---|---|---|---|---|---|---|---|---|---|---|---|---|
15049 Conference Center Drive |
Dulles South | 1997 | 152,993 | 100.0 | % | 4,708,200 | 30.77 | |||||||||||
Chantilly, VA |
||||||||||||||||||
15059 Conference Center Drive |
Dulles South | 2000 | 146,801 | 98.8 | % | 4,551,549 | 31.37 | |||||||||||
Chantilly, VA |
||||||||||||||||||
14900 Conference Center Drive |
Dulles South | 1999 | 125,357 | 89.7 | % | 3,174,811 | 28.24 | |||||||||||
Chantilly, VA |
||||||||||||||||||
14280 Park Meadow Drive |
Dulles South | 1999 | 112,916 | 100.0 | % | 2,861,504 | 25.34 | |||||||||||
Chantilly, VA |
||||||||||||||||||
4851 Stonecroft Blvd. |
Dulles South | 2004 | 88,099 | 100.0 | % | 2,666,224 | 30.26 | |||||||||||
Chantilly, VA |
||||||||||||||||||
14850 Conference Center Drive |
Dulles South | 2000 | 72,194 | 33.4 | % | 334,537 | 13.89 | |||||||||||
Chantilly, VA |
||||||||||||||||||
14840 Conference Center Drive |
Dulles South | 2000 | 71,517 | 0.0 | % | — | — | |||||||||||
Chantilly, VA |
||||||||||||||||||
13200 Woodland Park Road |
Herndon | 2002 | 396,837 | 100.0 | % | 12,531,612 | 31.58 | |||||||||||
Herndon, VA |
||||||||||||||||||
13454 Sunrise Valley |
Herndon | 1998 | 112,284 | 86.1 | % | 2,421,055 | 25.05 | |||||||||||
Herndon, VA |
||||||||||||||||||
13450 Sunrise Valley |
Herndon | 1998 | 53,572 | 100.0 | % | 1,443,882 | 26.95 | |||||||||||
Herndon, VA |
||||||||||||||||||
2900 Towerview Road |
Route 28 South | 1982/2008 | 151,497 | 51.1 | % | 1,491,098 | 19.25 | |||||||||||
Herndon, VA |
||||||||||||||||||
1751 Pinnacle Drive |
Tyson's Corner | 1989/1995 | 260,150 | 91.6 | % | 8,394,841 | 35.24 | |||||||||||
McLean, VA |
||||||||||||||||||
1753 Pinnacle Drive |
Tyson's Corner | 1976/2004 | 184,480 | 100.0 | % | 7,171,364 | 38.87 | |||||||||||
McLean, VA |
||||||||||||||||||
1550 Westbranch Drive |
Tyson's Corner | 2002 | 160,461 | 100.0 | % | 4,719,440 | 29.41 | |||||||||||
McLean, VA |
||||||||||||||||||
3120 Fairview Park Drive |
Merrifield | 2008 | 180,853 | 24.9 | % | 1,649,957 | 36.58 | |||||||||||
Falls Church, VA |
||||||||||||||||||
Subtotal/Average |
2,935,786 | 84.8 | % | $ | 75,068,931 | $ | 30.16 | |||||||||||
San Antonio: |
||||||||||||||||||
7700 Potranco Road |
San Antonio | 1982/1985 | 508,412 | 100.0 | % | $ | 17,636,099 | $ | 34.69 | |||||||||
San Antonio, TX |
||||||||||||||||||
8000 Potranco Road |
San Antonio | 2010 | 125,157 | 100.0 | % | 3,298,570 | 26.36 | |||||||||||
San Antonio, TX |
||||||||||||||||||
8030 Potranco Road |
San Antonio | 2010 | 125,155 | 100.0 | % | 3,298,570 | 26.36 | |||||||||||
San Antonio, TX |
||||||||||||||||||
1101 Sentry Gateway |
San Antonio | 2011 | 94,920 | 1.2 | % | 19,635 | 17.00 | |||||||||||
San Antonio, TX |
||||||||||||||||||
1560B Cable Ranch Road |
San Antonio | 1985/2006 | 77,040 | 100.0 | % | 1,833,802 | 23.80 | |||||||||||
San Antonio, TX |
||||||||||||||||||
1560A Cable Ranch Road |
San Antonio | 1985/2007 | 45,935 | 100.0 | % | 598,969 | 13.04 | |||||||||||
San Antonio, TX |
||||||||||||||||||
7700-5 Potranco Road |
San Antonio | 2009 | 25,056 | 100.0 | % | 362,110 | 14.45 | |||||||||||
San Antonio, TX |
||||||||||||||||||
7700-1 Potranco Road |
San Antonio | 2007 | 8,674 | 100.0 | % | 292,755 | 33.75 | |||||||||||
San Antonio, TX |
||||||||||||||||||
Subtotal/Average |
1,010,349 | 90.7 | % | $ | 27,340,510 | $ | 29.83 | |||||||||||
Washington DC—Capitol Riverfront: |
||||||||||||||||||
1201 M Street |
Washington DC—Capitol Riverfront | 2001 | 202,273 | 83.9 | % | $ | 7,312,766 | $ | 43.09 | |||||||||
1220 12th Street, SE |
Washington DC—Capitol Riverfront | 2003 | 158,913 | 96.9 | % | 6,974,988 | 45.28 | |||||||||||
Subtotal/Average |
361,186 | 89.6 | % | $ | 14,287,754 | $ | 44.13 | |||||||||||
26
Property and Location
|
Submarket | Year Built/ Renovated |
Rentable Square Feet |
Occupancy(1) | Annualized Rental Revenue(2) |
Annualized Rental Revenue per Occupied Square Foot(2)(3) |
||||||||||||
|---|---|---|---|---|---|---|---|---|---|---|---|---|---|---|---|---|---|---|
St Mary's & King George Counties: |
||||||||||||||||||
16480 Commerce Drive |
King George County | 2000 | 70,875 | 100.0 | % | $ | 1,347,091 | $ | 19.01 | |||||||||
Dahlgren, VA |
||||||||||||||||||
16541 Commerce Drive |
King George County | 1996 | 37,292 | 100.0 | % | 716,644 | 19.22 | |||||||||||
Dahlgren, VA |
||||||||||||||||||
16539 Commerce Drive |
King George County | 1990 | 32,257 | 100.0 | % | 603,238 | 18.70 | |||||||||||
Dahlgren, VA |
||||||||||||||||||
16442 Commerce Drive |
King George County | 2002 | 25,606 | 73.5 | % | 359,078 | 19.08 | |||||||||||
Dahlgren, VA |
||||||||||||||||||
16501 Commerce Drive |
King George County | 2002 | 22,833 | 100.0 | % | 493,127 | 21.60 | |||||||||||
Dahlgren, VA |
||||||||||||||||||
16543 Commerce Drive |
King George County | 2002 | 17,286 | 87.3 | % | 392,699 | 26.02 | |||||||||||
Dahlgren, VA |
||||||||||||||||||
22309 Exploration Drive |
St. Mary's County | 1984/1997 | 98,860 | 100.0 | % | 1,517,477 | 15.35 | |||||||||||
Lexington Park, MD |
||||||||||||||||||
45310 Abell House Lane |
St. Mary's County | 2011 | 82,842 | 100.0 | % | 2,426,201 | 29.29 | |||||||||||
California, MD |
||||||||||||||||||
46591 Expedition Drive |
St. Mary's County | 2005 | 59,843 | 100.0 | % | 1,468,324 | 24.54 | |||||||||||
Lexington Park, MD |
||||||||||||||||||
46579 Expedition Drive |
St. Mary's County | 2002 | 58,989 | 100.0 | % | 1,501,990 | 25.46 | |||||||||||
Lexington Park, MD |
||||||||||||||||||
44425 Pecan Court |
St. Mary's County | 1997 | 58,694 | 97.1 | % | 1,267,067 | 22.23 | |||||||||||
California, MD |
||||||||||||||||||
22289 Exploration Drive |
St. Mary's County | 2000 | 58,633 | 87.5 | % | 1,230,427 | 23.97 | |||||||||||
Lexington Park, MD |
||||||||||||||||||
22299 Exploration Drive |
St. Mary's County | 1998 | 58,132 | 62.2 | % | 914,070 | 25.27 | |||||||||||
Lexington Park, MD |
||||||||||||||||||
44408 Pecan Court |
St. Mary's County | 1986 | 49,808 | 0.0 | % | — | — | |||||||||||
California, MD |
||||||||||||||||||
23535 Cottonwood Parkway |
St. Mary's County | 1984 | 46,656 | 100.0 | % | 593,488 | 12.72 | |||||||||||
California, MD |
||||||||||||||||||
22300 Exploration Drive |
St. Mary's County | 1997 | 45,093 | 100.0 | % | 755,412 | 16.75 | |||||||||||
Lexington Park, MD |
||||||||||||||||||
44417 Pecan Court |
St. Mary's County | 1989 | 29,053 | 100.0 | % | 313,914 | 10.80 | |||||||||||
California, MD |
||||||||||||||||||
44414 Pecan Court |
St. Mary's County | 1986 | 25,444 | 100.0 | % | 266,144 | 10.46 | |||||||||||
California, MD |
||||||||||||||||||
44420 Pecan Court |
St. Mary's County | 1989 | 25,338 | 0.0 | % | — | — | |||||||||||
California, MD |
||||||||||||||||||
Subtotal/Average |
903,534 | 87.3 | % | $ | 16,166,393 | $ | 20.50 | |||||||||||
Greater Baltimore: |
||||||||||||||||||
210 Research Blvd |
Harford County | 2010 | 79,573 | 34.6 | % | $ | 842,182 | $ | 30.57 | |||||||||
Aberdeen, MD |
||||||||||||||||||
209 Research Blvd |
Harford County | 2010 | 77,192 | 100.0 | % | 2,253,075 | 29.19 | |||||||||||
Aberdeen, MD |
||||||||||||||||||
11311 McCormick Road |
Hunt Valley/RTE 83 Corridor | 1984/1994 | 214,705 | 97.6 | % | 4,891,897 | 23.35 | |||||||||||
10150 York Road |
Hunt Valley/RTE 83 Corridor | 1985 | 175,207 | 84.1 | % | 2,998,959 | 20.35 | |||||||||||
9690 Deereco Road |
Hunt Valley/RTE 83 Corridor | 1988 | 134,950 | 100.0 | % | 3,359,741 | 24.90 | |||||||||||
200 International Circle |
Hunt Valley/RTE 83 Corridor | 1987 | 125,352 | 93.7 | % | 2,647,860 | 22.55 | |||||||||||
375 Padonia Road West |
Hunt Valley/RTE 83 Corridor | 1986 | 104,885 | 100.0 | % | 1,950,274 | 18.59 | |||||||||||
226 Schilling Circle |
Hunt Valley/RTE 83 Corridor | 1980 | 97,309 | 100.0 | % | 2,128,651 | 21.88 | |||||||||||
27
Property and Location
|
Submarket | Year Built/ Renovated |
Rentable Square Feet |
Occupancy(1) | Annualized Rental Revenue(2) |
Annualized Rental Revenue per Occupied Square Foot(2)(3) |
||||||||||||
|---|---|---|---|---|---|---|---|---|---|---|---|---|---|---|---|---|---|---|
201 International Circle |
Hunt Valley/RTE 83 Corridor | 1982 | 78,243 | 73.2 | % | 1,332,066 | 23.25 | |||||||||||
222 Schilling Circle |
Hunt Valley/RTE 83 Corridor | 1978/1997 | 28,617 | 64.4 | % | 386,543 | 20.96 | |||||||||||
224 Schilling Circle |
Hunt Valley/RTE 83 Corridor | 1978/1997 | 27,575 | 88.8 | % | 490,013 | 20.01 | |||||||||||
8110 Corporate Drive |
White Marsh | 2001 | 79,091 | 100.0 | % | 1,551,584 | 19.62 | |||||||||||
White Marsh, MD |
||||||||||||||||||
8140 Corporate Drive |
White Marsh | 2003 | 76,271 | 78.5 | % | 1,667,279 | 27.85 | |||||||||||
White Marsh, MD |
||||||||||||||||||
8031 Corporate Drive |
White Marsh | 1988/2004 | 66,000 | 100.0 | % | 1,111,740 | 16.84 | |||||||||||
White Marsh, MD |
||||||||||||||||||
9910 Franklin Square Drive |
White Marsh | 2005 | 57,812 | 100.0 | % | 1,317,180 | 22.78 | |||||||||||
White Marsh, MD |
||||||||||||||||||
7941-7949 Corporate Drive |
White Marsh | 1996 | 57,782 | 0.0 | % | — | — | |||||||||||
White Marsh, MD |
||||||||||||||||||
8020 Corporate Drive |
White Marsh | 1997 | 50,796 | 100.0 | % | 1,116,441 | 21.98 | |||||||||||
White Marsh, MD |
||||||||||||||||||
4940 Campbell Drive |
White Marsh | 1990 | 50,415 | 85.5 | % | 1,016,477 | 23.59 | |||||||||||
White Marsh, MD |
||||||||||||||||||
4979 Mercantile Road |
White Marsh | 1985 | 49,590 | 72.8 | % | 484,857 | 13.43 | |||||||||||
White Marsh, MD |
||||||||||||||||||
8094 Sandpiper Circle |
White Marsh | 1998 | 49,585 | 88.7 | % | 843,149 | 19.17 | |||||||||||
White Marsh, MD |
||||||||||||||||||
4969 Mercantile Road |
White Marsh | 1983 | 47,132 | 0.0 | % | — | — | |||||||||||
White Marsh, MD |
||||||||||||||||||
8098 Sandpiper Circle |
White Marsh | 1998 | 46,485 | 100.0 | % | 806,540 | 17.35 | |||||||||||
White Marsh, MD |
||||||||||||||||||
8114 Sandpiper Circle |
White Marsh | 1986 | 45,803 | 72.8 | % | 862,119 | 25.84 | |||||||||||
White Marsh, MD |
||||||||||||||||||
5020 Campbell Blvd. |
White Marsh | 1986 - 1988 | 43,623 | 76.3 | % | 488,330 | 14.68 | |||||||||||
White Marsh, MD |
||||||||||||||||||
9920 Franklin Square Drive |
White Marsh | 2006 | 42,891 | 88.2 | % | 914,414 | 24.18 | |||||||||||
White Marsh, MD |
||||||||||||||||||
8007 Corporate Drive |
White Marsh | 1995 | 41,799 | 78.0 | % | 606,248 | 18.60 | |||||||||||
White Marsh, MD |
||||||||||||||||||
9930 Franklin Square Drive |
White Marsh | 2001 | 39,750 | 100.0 | % | 733,020 | 18.44 | |||||||||||
White Marsh, MD |
||||||||||||||||||
8010 Corporate Drive |
White Marsh | 1998 | 38,487 | 100.0 | % | 732,922 | 19.04 | |||||||||||
White Marsh, MD |
||||||||||||||||||
8615 Ridgely's Choice |
White Marsh | 2005 | 37,746 | 91.7 | % | 693,998 | 20.04 | |||||||||||
White Marsh, MD |
||||||||||||||||||
5355 Nottingham Drive |
White Marsh | 2005 | 35,930 | 79.6 | % | 558,846 | 19.54 | |||||||||||
White Marsh, MD |
||||||||||||||||||
5325 Nottingham Drive |
White Marsh | 2002 | 35,678 | 100.0 | % | 785,058 | 22.00 | |||||||||||
White Marsh, MD |
||||||||||||||||||
9900 Franklin Square Drive |
White Marsh | 1999 | 33,800 | 85.7 | % | 529,855 | 18.29 | |||||||||||
White Marsh, MD |
||||||||||||||||||
5024 Campbell Blvd. |
White Marsh | 1986 - 1988 | 33,710 | 73.3 | % | 387,022 | 15.66 | |||||||||||
White Marsh, MD |
||||||||||||||||||
8019 Corporate Drive |
White Marsh | 1990 | 32,424 | 75.9 | % | 519,112 | 21.10 | |||||||||||
White Marsh, MD |
||||||||||||||||||
9940 Franklin Square Drive |
White Marsh | 2000 | 32,242 | 49.4 | % | 298,101 | 18.72 | |||||||||||
White Marsh, MD |
||||||||||||||||||
5026 Campbell Blvd. |
White Marsh | 1986 - 1988 | 30,163 | 77.8 | % | 380,216 | 16.20 | |||||||||||
White Marsh, MD |
||||||||||||||||||
8013 Corporate Drive |
White Marsh | 1990 | 29,995 | 27.6 | % | 135,117 | 16.31 | |||||||||||
White Marsh, MD |
||||||||||||||||||
28
Property and Location
|
Submarket | Year Built/ Renovated |
Rentable Square Feet |
Occupancy(1) | Annualized Rental Revenue(2) |
Annualized Rental Revenue per Occupied Square Foot(2)(3) |
||||||||||||
|---|---|---|---|---|---|---|---|---|---|---|---|---|---|---|---|---|---|---|
7939 Honeygo Blvd. |
White Marsh | 1984 | 28,208 | 80.7 | % | 503,596 | 22.13 | |||||||||||
White Marsh, MD |
||||||||||||||||||
8133 Perry Hall Blvd. |
White Marsh | 1988 | 27,995 | 81.1 | % | 457,830 | 20.16 | |||||||||||
White Marsh, MD |
||||||||||||||||||
5022 Campbell Blvd. |
White Marsh | 1986 - 1988 | 26,748 | 92.6 | % | 401,005 | 16.19 | |||||||||||
White Marsh, MD |
||||||||||||||||||
8029 Corporate Drive |
White Marsh | 1988/2004 | 25,000 | 100.0 | % | 449,990 | 18.00 | |||||||||||
White Marsh, MD |
||||||||||||||||||
7923 Honeygo Blvd. |
White Marsh | 1985 | 23,481 | 89.1 | % | 370,936 | 17.72 | |||||||||||
White Marsh, MD |
||||||||||||||||||
8003 Corporate Drive |
White Marsh | 1999 | 17,599 | 0.0 | % | — | — | |||||||||||
White Marsh, MD |
||||||||||||||||||
8015 Corporate Drive |
White Marsh | 1990 | 15,669 | 68.9 | % | 210,349 | 19.49 | |||||||||||
White Marsh, MD |
||||||||||||||||||
8023 Corporate Drive |
White Marsh | 1990 | 9,486 | 100.0 | % | 182,267 | 19.21 | |||||||||||
White Marsh, MD |
||||||||||||||||||
1501 South Clinton Street |
Baltimore City | 2006 | 481,277 | 92.6 | % | 14,757,194 | 33.11 | |||||||||||
Baltimore, MD |
||||||||||||||||||
Subtotal/Average |
2,984,071 | 84.5 | % | $ | 59,154,055 | $ | 23.46 | |||||||||||
Suburban Maryland: |
||||||||||||||||||
110 Thomas Johnson Drive |
Frederick | 1987/1999 | 120,318 | 91.0 | % | $ | 2,710,260 | $ | 24.76 | |||||||||
Frederick, MD |
||||||||||||||||||
400 Professional Drive |
Gaithersburg | 2000 | 129,853 | 66.7 | % | 2,114,604 | 24.41 | |||||||||||
Gaithersburg, MD |
||||||||||||||||||
4230 Forbes Boulevard |
Lanham | 2003 | 55,866 | 43.0 | % | 375,808 | 15.65 | |||||||||||
Lanham, MD(4) |
||||||||||||||||||
11800 Tech Road |
North Silver Spring | 1989 | 239,776 | 82.5 | % | 3,309,988 | 16.74 | |||||||||||
Silver Spring, MD |
||||||||||||||||||
45 West Gude Drive |
Rockville | 1987 | 122,555 | 54.3 | % | 1,497,285 | 22.50 | |||||||||||
Rockville, MD |
||||||||||||||||||
15 West Gude Drive |
Rockville | 1986 | 108,485 | 100.0 | % | 2,739,649 | 25.25 | |||||||||||
Rockville, MD |
||||||||||||||||||
5850 University Research Court |
College Park | 2008 | 123,449 | 100.0 | % | 3,757,009 | 30.43 | |||||||||||
College Park, MD(4) |
||||||||||||||||||
5825 University Research Court |
College Park | 2008 | 118,620 | 79.5 | % | 2,784,416 | 29.53 | |||||||||||
College Park, MD(4) |
||||||||||||||||||
Subtotal/Average |
1,018,922 | 79.6 | % | $ | 19,289,019 | $ | 23.80 | |||||||||||
Colorado Springs: |
||||||||||||||||||
3535 Northrop Grumman Point |
Colorado Springs East | 2008 | 124,305 | 100.0 | % | $ | 2,451,462 | $ | 19.72 | |||||||||
Colorado Springs, CO |
||||||||||||||||||
985 Space Center Drive |
Colorado Springs East | 1989 | 104,028 | 94.6 | % | 2,128,568 | 21.63 | |||||||||||
Colorado Springs, CO |
||||||||||||||||||
655 Space Center Drive |
Colorado Springs East | 2008 | 103,970 | 100.0 | % | 2,185,622 | 21.02 | |||||||||||
Colorado Springs, CO |
||||||||||||||||||
565 Space Center Drive |
Colorado Springs East | 2009 | 89,899 | 8.6 | % | 36,980 | 4.78 | |||||||||||
Colorado Springs, CO |
||||||||||||||||||
1670 North Newport Road |
Colorado Springs East | 1986/1987 | 67,500 | 56.2 | % | 805,032 | 21.22 | |||||||||||
Colorado Springs, CO |
||||||||||||||||||
1055 North Newport Road |
Colorado Springs East | 2007 - 2008 | 59,763 | 100.0 | % | 1,235,529 | 20.67 | |||||||||||
Colorado Springs, CO |
||||||||||||||||||
745 Space Center Drive |
Colorado Springs East | 2006 | 51,500 | 100.0 | % | 1,405,270 | 27.29 | |||||||||||
Colorado Springs, CO |
||||||||||||||||||
1915 Aerotech Drive |
Colorado Springs East | 1985 | 37,946 | 15.8 | % | 83,937 | 14.02 | |||||||||||
Colorado Springs, CO |
||||||||||||||||||
1925 Aerotech Drive |
Colorado Springs East | 1985 | 37,946 | 60.1 | % | 527,177 | 23.11 | |||||||||||
Colorado Springs, CO |
||||||||||||||||||
29
Property and Location
|
Submarket | Year Built/ Renovated |
Rentable Square Feet |
Occupancy(1) | Annualized Rental Revenue(2) |
Annualized Rental Revenue per Occupied Square Foot(2)(3) |
||||||||||||
|---|---|---|---|---|---|---|---|---|---|---|---|---|---|---|---|---|---|---|
980 Technology Court |
Colorado Springs East | 1995 | 33,207 | 100.0 | % | 682,857 | 20.56 | |||||||||||
Colorado Springs, CO |
||||||||||||||||||
525 Babcock Road |
Colorado Springs East | 1967 | 14,000 | 100.0 | % | 198,430 | 14.17 | |||||||||||
Colorado Springs, CO |
||||||||||||||||||
5725 Mark Dabling Blvd. |
Colorado Springs Northwest | 1984 | 108,976 | 100.0 | % | 2,046,254 | 18.78 | |||||||||||
5775 Mark Dabling Blvd. |
Colorado Springs Northwest | 1984 | 108,640 | 61.6 | % | 1,152,156 | 17.22 | |||||||||||
5755 Mark Dabling Blvd. |
Colorado Springs Northwest | 1989 | 104,848 | 88.4 | % | 1,991,314 | 21.48 | |||||||||||
10807 New Allegiance Drive |
I-25 North Corridor | 2009 | 145,723 | 41.2 | % | 1,296,364 | 21.61 | |||||||||||
Colorado Springs, CO |
||||||||||||||||||
9965 Federal Drive |
I-25 North Corridor | 1983/2007 | 74,749 | 100.0 | % | 1,372,347 | 18.36 | |||||||||||
Colorado Springs, CO |
||||||||||||||||||
9945 Federal Drive |
I-25 North Corridor | 2009 | 74,005 | 0.0 | % | — | — | |||||||||||
Colorado Springs, CO |
||||||||||||||||||
9950 Federal Drive |
I-25 North Corridor | 2001 | 66,223 | 100.0 | % | 1,046,628 | 15.80 | |||||||||||
Colorado Springs, CO |
||||||||||||||||||
12515 Academy Ridge View |
I-25 North Corridor | 2006 | 61,372 | 100.0 | % | 1,585,824 | 25.84 | |||||||||||
Colorado Springs, CO |
||||||||||||||||||
9925 Federal Drive |
I-25 North Corridor | 2008 | 53,788 | 90.8 | % | 768,341 | 15.74 | |||||||||||
Colorado Springs, CO |
||||||||||||||||||
9960 Federal Drive |
I-25 North Corridor | 2001 | 46,948 | 78.3 | % | 781,262 | 21.24 | |||||||||||
Colorado Springs, CO |
||||||||||||||||||
Subtotal/Average |
1,569,336 | 74.9 | % | $ | 23,781,354 | $ | 20.22 | |||||||||||
Greater Philadelphia: |
||||||||||||||||||
785 Jolly Road |
Greater Philadelphia | 1991 - 1996 | 219,065 | 100.0 | % | $ | 2,884,072 | $ | 13.17 | |||||||||
Blue Bell, PA |
||||||||||||||||||
801 Lakeview Drive |
Greater Philadelphia | 1991 - 1996 | 218,653 | 99.4 | % | 5,341,961 | 24.58 | |||||||||||
Blue Bell, PA |
||||||||||||||||||
Subtotal/Average |
437,718 | 99.7 | % | $ | 8,226,033 | $ | 18.85 | |||||||||||
Other Region: |
||||||||||||||||||
11751 Meadowville Lane |
Richmond Southwest | 2007 | 193,000 | 100.0 | % | 5,366,053 | 27.80 | |||||||||||
Richmond, VA |
||||||||||||||||||
201 Technology Drive |
Southwest Virginia | 2007 | 102,842 | 100.0 | % | 3,559,958 | 34.62 | |||||||||||
Lebanon, VA |
||||||||||||||||||
310 The Bridge Street |
Huntsville | 2009 | 138,466 | 100.0 | % | 3,558,174 | 25.70 | |||||||||||
Huntsville, AL |
||||||||||||||||||
Subtotal/Average |
434,308 | 100.0 | % | $ | 12,484,186 | $ | 28.75 | |||||||||||
Total/Average |
20,514,290 | 86.2 | % | $ | 470,157,772 | $ | 26.59 | |||||||||||
30
The following table provides certain information about our office properties that were under construction or redevelopment as of December 31, 2011:
Property and Location
|
Submarket | Estimated Rentable Square Feet Upon Completion |
Percentage Leased at December 31, 2011 |
||||||
|---|---|---|---|---|---|---|---|---|---|
Under Construction |
|||||||||
Baltimore/Washington Corridor: |
|||||||||
7205 Riverwood Road |
Howard County Perimeter | 89,295 | 0 | % | |||||
Columbia, MD |
|||||||||
410 National Business Parkway |
BWI Airport | 110,362 | 0 | % | |||||
Annapolis Junction, MD |
|||||||||
430 National Business Parkway |
BWI Airport | 109,559 | 73 | % | |||||
Annapolis Junction, MD |
|||||||||
Subtotal/Average |
309,216 | 26 | % | ||||||
Northern Virginia: |
|||||||||
7770 Backlick Road (Patriot Ridge) |
Springfield | 237,000 | 44 | % | |||||
Springfield, VA |
|||||||||
Greater Baltimore: |
|||||||||
206 Research Boulevard |
Harford County | 128,119 | 0 | % | |||||
Aberdeen, MD |
|||||||||
Huntsville: |
|||||||||
1000 Redstone Gateway |
Huntsville | 114,891 | 0 | % | |||||
Huntsville, AL |
|||||||||
Total Under Construction |
789,226 | 23 | % | ||||||
Under Redevelopment |
|||||||||
Greater Philadelphia: |
|||||||||
751 Arbor Way (Hillcrest I) |
Greater Philadelphia | 113,291 | 39 | % | |||||
Blue Bell, PA |
|||||||||
Total Under Redevelopment |
113,291 | 39 | % | ||||||
31
The following table provides certain information about our land held or under pre-construction as of December 31, 2011:
Land Location
|
Submarket | Acres | Estimated Developable Square Feet |
||||||
|---|---|---|---|---|---|---|---|---|---|
Baltimore/Washington Corridor: |
|||||||||
National Business Park North |
BWI Airport | 183 | 1,674,000 | ||||||
Annapolis Junction, MD |
|||||||||
National Business Park |
BWI Airport | 12 | 385,000 | ||||||
Annapolis Junction, MD |
|||||||||
1243 Winterson Road (AS 22) |
BWI Airport | 2 | 30,000 | ||||||
Linthicum, MD |
|||||||||
940 Elkridge Landing Road (AS 7) |
BWI Airport | 2 | 54,000 | ||||||
Linthicum, MD |
|||||||||
West Nursery Road |
BWI Airport | 1 | 5,000 | ||||||
Linthicum, MD |
|||||||||
Arundel Preserve |
BWI Airport | 84 | 1,382,000 | ||||||
Hanover, MD |
|||||||||
1460 Dorsey Road |
BWI Airport | 6 | 60,000 | ||||||
Hanover, MD |
|||||||||
Columbia Gateway Parcel T-11 |
Howard Co. Perimeter | 14 | 220,000 | ||||||
Columbia, MD |
|||||||||
7125 Columbia Gateway Drive |
Howard Co. Perimeter | 8 | 300,000 | ||||||
Columbia, MD |
|||||||||
Riverwood |
Howard Co. Perimeter | 5 | 27,000 | ||||||
Columbia, MD |
|||||||||
Subtotal |
318 | 4,137,000 | |||||||
Northern Virginia: |
|||||||||
Westfields Corporate Center |
Dulles South | 23 | 400,000 | ||||||
Chantilly, VA |
|||||||||
Westfields—Park Center |
Dulles South | 33 | 400,000 | ||||||
Chantilly, VA |
|||||||||
Woodland Park |
Herndon | 5 | 225,000 | ||||||
Herndon, VA |
|||||||||
Patriot Ridge |
Springfield | 11 | 739,000 | ||||||
Springfield, VA |
|||||||||
Subtotal |
72 | 1,764,000 | |||||||
San Antonio: |
|||||||||
8100 Potranco Road |
San Antonio Northwest | 9 | 125,000 | ||||||
San Antonio, TX |
|||||||||
Northwest Crossroads |
San Antonio Northwest | 31 | 375,000 | ||||||
San Antonio, TX |
|||||||||
Military Drive |
San Antonio Northwest | 41 | 752,000 | ||||||
San Antonio, TX |
|||||||||
Subtotal |
81 | 1,252,000 | |||||||
32
Land Location
|
Submarket | Acres | Estimated Developable Square Feet |
||||||
|---|---|---|---|---|---|---|---|---|---|
St. Mary's & King George Counties |
|||||||||
Dahlgren Technology Center |
King George County | 38 | 64,000 | ||||||
Dahlgren, MD |
|||||||||
Expedition VII |
St. Mary's County | 6 | 45,000 | ||||||
Lexington Park, MD |
|||||||||
Subtotal |
44 | 109,000 | |||||||
Greater Baltimore: |
|||||||||
Canton Crossing |
Baltimore | 10 | 773,000 | ||||||
Baltimore, MD |
|||||||||
White Marsh |
White Marsh | 138 | 1,352,000 | ||||||
White Marsh, MD |
|||||||||
North Gate Business Park |
Harford County | 39 | 567,000 | ||||||
Aberdeen, MD |
|||||||||
Subtotal |
187 | 2,692,000 | |||||||
Suburban Maryland |
|||||||||
Thomas Johnson Drive |
Frederick | 6 | 170,000 | ||||||
Frederick, MD |
|||||||||
Route 15 / Biggs Ford Road |
Frederick | 107 | 1,000,000 | ||||||
Frederick, MD |
|||||||||
Rockville Corporate Center |
Rockville | 10 | 220,000 | ||||||
Rockville, MD |
|||||||||
M Square Research Park |
College Park | 49 | 510,000 | ||||||
College Park, MD |
|||||||||
Subtotal |
172 | 1,900,000 | |||||||
Colorado Springs: |
|||||||||
InterQuest |
I-25 North Corridor | 94 | 1,450,000 | ||||||
Colorado Springs, CO |
|||||||||
9965 Federal Drive |
I-25 North Corridor | 4 | 30,000 | ||||||
Colorado Springs, CO |
|||||||||
Patriot Park |
Colorado Springs East | 71 | 1,000,000 | ||||||
Colorado Springs, CO |
|||||||||
Aerotech Commerce |
Colorado Springs East | 6 | 90,000 | ||||||
Colorado Springs, CO |
|||||||||
Subtotal |
175 | 2,570,000 | |||||||
Greater Philadelphia: |
|||||||||
Arborcrest |
Blue Bell | 8 | 722,000 | ||||||
Blue Bell, PA |
|||||||||
Other: |
|||||||||
Redstone Gateway |
Huntsville, AL | 465 | 4,485,000 | ||||||
Huntsville, AL |
|||||||||
Indian Head |
Charles County, MD | 217 | 967,000 | ||||||
Charles County, MD |
|||||||||
Fort Ritchie |
Fort Ritchie | 591 | — | ||||||
Cascade, MD |
|||||||||
Subtotal |
1,273 | 5,452,000 | |||||||
Total Land Held and Under Preconstruction |
2,330 | 20,598,000 | |||||||
33
The following table provides certain information about our wholesale data center property as of December 31, 2011:
Property and Location
|
Year Built |
Gross Building Area |
Raised Floor Square Footage(1) |
Initial Stabilization Critical Load (in MWs)(2) |
Critical Load Upon Completion Leased at December 31, 2011 |
MW Operational |
|||||||||||||
|---|---|---|---|---|---|---|---|---|---|---|---|---|---|---|---|---|---|---|---|
9651 Hornbaker Road |
2010 | 233,000 | 100,000 | 18 | 17 | % | 17 | % | |||||||||||
Manassas, Virginia |
|||||||||||||||||||
Lease Expirations
The following table provides a summary schedule of the lease expirations for leases in place at our office properties as of December 31, 2011, assuming that none of the tenants exercise renewal options. This analysis includes the effect of early renewals completed on existing leases but excludes the effect of new tenant leases on 399,802 square feet executed but yet to commence as of December 31, 2011.
Year of Lease Expiration(1)
|
Number of Leases Expiring |
Square Footage of Leases Expiring |
Percentage of Total Occupied Square Feet |
Annualized Rental Revenue of Expiring Leases(2) |
Percentage of Total Annualized Rental Revenue Expiring(2) |
Total Annualized Rental Revenue of Expiring Leases Per Occupied Square Foot |
|||||||||||||
|---|---|---|---|---|---|---|---|---|---|---|---|---|---|---|---|---|---|---|---|
| |
|
|
|
(in thousands) |
|
|
|||||||||||||
2012 |
171 | 2,349,450 | 13.3 | % | $ | 58,048 | 12.3 | % | $ | 24.71 | |||||||||
2013 |
118 | 2,021,184 | 11.4 | % | 59,678 | 12.7 | % | 29.53 | |||||||||||
2014 |
131 | 2,147,570 | 12.1 | % | 57,535 | 12.2 | % | 26.79 | |||||||||||
2015 |
116 | 2,688,720 | 15.2 | % | 68,954 | 14.7 | % | 25.65 | |||||||||||
2016 |
99 | 1,843,069 | 10.4 | % | 46,445 | 9.9 | % | 25.20 | |||||||||||
2017 |
60 | 1,338,885 | 7.6 | % | 36,769 | 7.8 | % | 27.46 | |||||||||||
2018 |
46 | 1,115,484 | 6.3 | % | 29,522 | 6.3 | % | 26.46 | |||||||||||
2019 |
27 | 886,856 | 5.0 | % | 22,395 | 4.8 | % | 25.25 | |||||||||||
2020 |
26 | 1,285,972 | 7.3 | % | 32,410 | 6.9 | % | 25.20 | |||||||||||
2021 |
22 | 662,096 | 3.7 | % | 17,765 | 3.8 | % | 26.83 | |||||||||||
2022 |
11 | 737,163 | 4.2 | % | 20,911 | 4.4 | % | 28.37 | |||||||||||
2023 |
2 | 52,899 | 0.3 | % | 1,176 | 0.3 | % | 22.24 | |||||||||||
2024 |
— | — | 0.0 | % | — | 0.0 | % | — | |||||||||||
2025 |
4 | 555,370 | 3.1 | % | 18,550 | 3.9 | % | 33.40 | |||||||||||
Total/Weighted Average |
833 | 17,684,718 | 100.0 | % | $ | 470,158 | 100.0 | % | $ | 26.59 | |||||||||
34
The following table provides a summary schedule of the lease expirations for leases in place at our wholesale data center property as of December 31, 2011:
Year of Lease Expiration
|
Number of Leases Expiring |
Raised Floor Square Footage Expiring |
Critical Load Leased (in megawatts) |
Critical Load Used (in megawatts) |
Annualized Rental Revenue of Expiring Leases(2) |
|||||||||||
|---|---|---|---|---|---|---|---|---|---|---|---|---|---|---|---|---|
| |
|
|
|
|
(in thousands) |
|||||||||||
2019 |
1 | 7,172 | 1 | 1.00 | $ | 2,057 | ||||||||||
2020 |
1 | 19,023 | 2 | 1.25 | 2,570 | |||||||||||
Total/Weighted Average |
2 | 26,195 | 3 | 2.25 | $ | 4,627 | ||||||||||
We are not currently involved in any other material litigation nor, to our knowledge, is any material litigation currently threatened against the Company (other than routine litigation arising in the ordinary course of business, substantially all of which is expected to be covered by liability insurance).
Item 4. Mine Safety Disclosures
Not applicable.
35
Item 5. Market for Registrant's Common Equity, Related Stockholder Matters and Issuer Purchases of Equity Securities
Market Information
Our common shares trade on the New York Stock Exchange ("NYSE") under the symbol "OFC." The table below shows the range of the high and low sale prices for our common shares as reported on the NYSE, as well as the quarterly common share dividends per share declared:
| |
Price Range | |
||||||||
|---|---|---|---|---|---|---|---|---|---|---|
| |
Dividends Per Share |
|||||||||
2010
|
Low | High | ||||||||
First Quarter |
$ | 32.69 | $ | 42.44 | $ | 0.3925 | ||||
Second Quarter |
$ | 34.82 | $ | 43.61 | $ | 0.3925 | ||||
Third Quarter |
$ | 35.04 | $ | 39.85 | $ | 0.4125 | ||||
Fourth Quarter |
$ | 33.33 | $ | 38.96 | $ | 0.4125 | ||||
| |
Price Range | |
||||||||
|---|---|---|---|---|---|---|---|---|---|---|
| |
Dividends Per Share |
|||||||||
2011
|
Low | High | ||||||||
First Quarter |
$ | 33.83 | $ | 36.90 | $ | 0.4125 | ||||
Second Quarter |
$ | 30.63 | $ | 36.79 | $ | 0.4125 | ||||
Third Quarter |
$ | 21.75 | $ | 32.07 | $ | 0.4125 | ||||
Fourth Quarter |
$ | 19.35 | $ | 25.96 | $ | 0.4125 | ||||
The number of holders of record of our common shares was 640 as of December 31, 2011. This number does not include shareholders whose shares are held of record by a brokerage house or clearing agency, but does include any such brokerage house or clearing agency as one record holder.
We will pay dividends at the discretion of our Board of Trustees. Our ability to pay cash dividends will be dependent upon: (1) the income and cash flow generated from our operations; (2) cash generated or used by our financing and investing activities; and (3) the annual distribution requirements under the REIT provisions of the Code described above and such other factors as the Board of Trustees deems relevant. Our ability to make cash dividends will also be limited by the terms of our Operating Partnership Agreement, as well as by limitations imposed by state law. In addition, we are prohibited from paying cash dividends in excess of the amount necessary for us to qualify for taxation as a REIT if a default or event of default exists pursuant to the terms of our Revolving Credit Facility; this restriction does not currently limit our ability to pay dividends, and we do not believe that this restriction is reasonably likely to limit our ability to pay future dividends because we expect to comply with the terms of our Revolving Credit Facility.
We declared a first quarter 2012 common share dividend to shareholders of record on March 31, 2012 of $0.275 per share, a 33% decrease from the fourth quarter 2011 dividend of $0.4125 per share, and expect to continue to pay dividends at this reduced rate at least through the remainder of 2012.
Unregistered Sales of Equity Securities and Use of Proceeds
During the three months ended December 31, 2011, 17,433 of the Operating Partnership's common units were exchanged for 17,433 common shares in accordance with the Operating Partnership's Second Amended and Restated Limited Partnership Agreement, as amended. The issuance of these common shares was effected in reliance upon the exemption from registration under Section 4(2) of the Securities Act of 1933, as amended.
36
Common Shares Performance Graph
The graph and the table set forth below assume $100 was invested on December 31, 2006 in the common shares of Corporate Office Properties Trust. The graph and the table compare the cumulative return (assuming reinvestment of dividends) of this investment with a $100 investment at that time in the S&P 500 Index or the All Equity REIT Index of the National Association of Real Estate Investment Trusts ("NAREIT"):
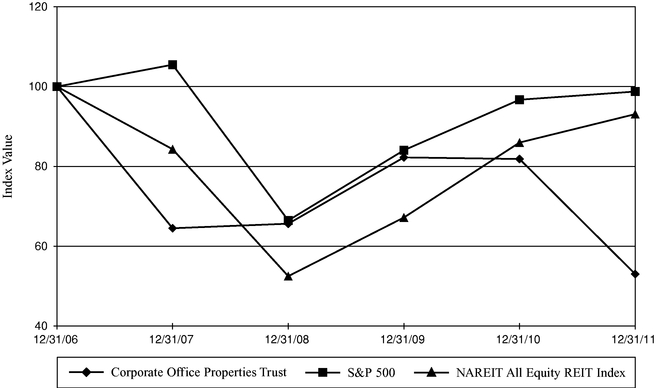
| |
Period Ended | ||||||||||||||||||
|---|---|---|---|---|---|---|---|---|---|---|---|---|---|---|---|---|---|---|---|
Index
|
12/31/06 | 12/31/07 | 12/31/08 | 12/31/09 | 12/31/10 | 12/31/11 | |||||||||||||
Corporate Office Properties Trust |
100.00 | 64.51 | 65.65 | 82.26 | 81.86 | 53.04 | |||||||||||||
S&P 500 |
100.00 | 105.49 | 66.46 | 84.05 | 96.71 | 98.76 | |||||||||||||
NAREIT All Equity REIT Index |
100.00 | 84.31 | 52.50 | 67.20 | 85.98 | 93.10 | |||||||||||||
37
Item 6. Selected Financial Data
The following table sets forth summary financial data as of and for each of the years ended December 31, 2007 through 2011. Since this information is only a summary, you should refer to our consolidated financial statements and notes thereto and the section of this report entitled "Management's Discussion and Analysis of Financial Condition and Results of Operations" for additional information.
Corporate Office Properties Trust and Subsidiaries
(in thousands, except per share data and number of properties)
| |
2011 | 2010 | 2009 | 2008 | 2007 | |||||||||||
|---|---|---|---|---|---|---|---|---|---|---|---|---|---|---|---|---|
Revenues |
||||||||||||||||
Revenues from real estate operations(1) |
$ | 472,496 | $ | 432,923 | $ | 394,541 | $ | 367,205 | $ | 333,838 | ||||||
Construction contract and other service revenues |
84,345 | 104,675 | 343,087 | 188,385 | 41,225 | |||||||||||
Total revenues |
556,841 | 537,598 | 737,628 | 555,590 | 375,063 | |||||||||||
Expenses |
||||||||||||||||
Property operating expenses(1) |
186,833 | 169,325 | 145,973 | 129,736 | 112,266 | |||||||||||
Depreciation and amortization associated with real estate operations(1) |
127,444 | 113,234 | 97,869 | 89,854 | 91,036 | |||||||||||
Construction contract and other service expenses |
81,639 | 102,302 | 336,519 | 184,142 | 39,793 | |||||||||||
Impairment losses |
127,765 | — | — | — | — | |||||||||||
General and administrative expenses |
25,843 | 24,008 | 23,240 | 24,096 | 20,227 | |||||||||||
Business development expenses |
3,195 | 4,197 | 3,699 | 1,233 | 1,477 | |||||||||||
Total operating expenses |
552,719 | 413,066 | 607,300 | 429,061 | 264,799 | |||||||||||
Operating income |
4,122 | 124,532 | 130,328 | 126,529 | 110,264 | |||||||||||
Interest expense(1) |
(101,281 | ) | (98,748 | ) | (79,789 | ) | (82,401 | ) | (85,076 | ) | ||||||
Interest and other income |
5,603 | 9,568 | 5,164 | 2,070 | 3,030 | |||||||||||
Loss on interest rate derivatives |
(29,805 | ) | — | — | — | — | ||||||||||
(Loss) gain on early extinguishment of debt |
(1,683 | ) | — | — | 8,101 | — | ||||||||||
(Loss) income from continuing operations before equity in (loss) income of unconsolidated entities and income taxes |
(123,044 | ) | 35,352 | 55,703 | 54,299 | 28,218 | ||||||||||
Equity in (loss) income of unconsolidated entities |
(331 | ) | 1,376 | (941 | ) | (147 | ) | (224 | ) | |||||||
Income tax benefit (expense) |
10,679 | (108 | ) | (196 | ) | (201 | ) | (569 | ) | |||||||
(Loss) income from continuing operations |
(112,696 | ) | 36,620 | 54,566 | 53,951 | 27,425 | ||||||||||
Discontinued operations(1)(2) |
(14,343 | ) | 6,055 | 6,733 | 6,261 | 6,480 | ||||||||||
(Loss) income before gain on sales of real estate |
(127,039 | ) | 42,675 | 61,299 | 60,212 | 33,905 | ||||||||||
Gain on sales of real estate, net of income taxes(1)(3) |
2,721 | 2,829 | — | 1,104 | 2,037 | |||||||||||
Net (loss) income |
(124,318 | ) | 45,504 | 61,299 | 61,316 | 35,942 | ||||||||||
Net loss (income) attributable to noncontrolling interests |
6,643 | (2,744 | ) | (4,970 | ) | (7,351 | ) | (3,741 | ) | |||||||
Net (loss) income attributable to Corporate Office Properties Trust |
(117,675 | ) | 42,760 | 56,329 | 53,965 | 32,201 | ||||||||||
Preferred share dividends |
(16,102 | ) | (16,102 | ) | (16,102 | ) | (16,102 | ) | (16,068 | ) | ||||||
Net (loss) income attributable to Corporate Office Properties Trust common shareholders |
$ | (133,777 | ) | $ | 26,658 | $ | 40,227 | $ | 37,863 | $ | 16,133 | |||||
Basic earnings per common share(4) |
||||||||||||||||
(Loss) income from continuing operations |
$ | (1.75 | ) | $ | 0.34 | $ | 0.59 | $ | 0.66 | $ | 0.22 | |||||
Net (loss) income |
$ | (1.94 | ) | $ | 0.43 | $ | 0.70 | $ | 0.77 | $ | 0.34 | |||||
Diluted earnings per common share(4) |
||||||||||||||||
(Loss) income from continuing operations |
$ | (1.75 | ) | $ | 0.34 | $ | 0.59 | $ | 0.65 | $ | 0.21 | |||||
Net (loss) income |
$ | (1.94 | ) | $ | 0.43 | $ | 0.70 | $ | 0.76 | $ | 0.33 | |||||
Weighted average common shares outstanding—basic |
69,382 |
59,611 |
55,930 |
48,132 |
46,527 |
|||||||||||
Weighted average common shares outstanding—diluted |
69,382 | 59,944 | 56,407 | 48,820 | 47,518 | |||||||||||
38
| |
2011 | 2010 | 2009 | 2008 | 2007 | |||||||||||
|---|---|---|---|---|---|---|---|---|---|---|---|---|---|---|---|---|
Balance Sheet Data (as of year end): |
||||||||||||||||
Investment in real estate |
$ | 3,352,975 | $ | 3,445,455 | $ | 3,029,900 | $ | 2,778,466 | $ | 2,604,836 | ||||||
Total assets |
$ | 3,867,524 | $ | 3,844,517 | $ | 3,380,022 | $ | 3,114,239 | $ | 2,932,364 | ||||||
Debt |
$ | 2,426,303 | $ | 2,323,681 | $ | 2,053,841 | $ | 1,856,751 | $ | 1,809,610 | ||||||
Total liabilities |
$ | 2,649,459 | $ | 2,521,379 | $ | 2,259,390 | $ | 2,031,816 | $ | 1,962,884 | ||||||
Total equity |
$ | 1,218,065 | $ | 1,323,138 | $ | 1,120,632 | $ | 1,082,423 | $ | 969,480 | ||||||
Other Financial Data (for the year ended): |
||||||||||||||||
Cash flows provided by (used in): |
||||||||||||||||
Operating activities |
$ | 152,143 | $ | 156,436 | $ | 194,817 | $ | 180,892 | $ | 138,391 | ||||||
Investing activities |
$ | (260,387 | ) | $ | (479,167 | ) | $ | (349,076 | ) | $ | (290,822 | ) | $ | (328,404 | ) | |
Financing activities |
$ | 103,701 | $ | 324,571 | $ | 155,746 | $ | 92,067 | $ | 206,728 | ||||||
Numerator for diluted EPS |
$ | (134,814 | ) | $ | 25,587 | $ | 39,217 | $ | 37,135 | $ | 15,616 | |||||
Diluted funds from operations(5) |
$ | 56,320 | $ | 148,645 | $ | 152,626 | $ | 143,592 | $ | 121,371 | ||||||
Diluted funds from operations per share(5) |
$ | 0.76 | $ | 2.30 | $ | 2.46 | $ | 2.52 | $ | 2.17 | ||||||
Cash dividends declared per common share |
$ | 1.65 | $ | 1.61 | $ | 1.53 | $ | 1.425 | $ | 1.30 | ||||||
Property Data (as of year end): |
||||||||||||||||
Number of properties owned(1)(6) |
238 | 256 | 253 | 240 | 230 | |||||||||||
Total rentable square feet owned(1)(6) |
20,514 | 20,432 | 19,543 | 18,559 | 17,966 | |||||||||||
39
Item 7. Management's Discussion and Analysis of Financial Condition and Results of Operations
You should refer to our consolidated financial statements and the notes thereto and our Selected Financial Data table as you read this section.
This section contains "forward-looking" statements, as defined in the Private Securities Litigation Reform Act of 1995, that are based on our current expectations, estimates and projections about future events and financial trends affecting the financial condition and operations of our business. Forward-looking statements can be identified by the use of words such as "may," "will," "should," "could," "believe," "anticipate," "expect," "estimate," "plan" or other comparable terminology. Forward-looking statements are inherently subject to risks and uncertainties, many of which we cannot predict with accuracy and some of which we might not even anticipate. Although we believe that the expectations, estimates and projections reflected in such forward-looking statements are based on reasonable assumptions at the time made, we can give no assurance that these expectations, estimates and projections will be achieved. Future events and actual results may differ materially from those discussed in the forward-looking statements. Important factors that may affect these expectations, estimates and projections include, but are not limited to:
We undertake no obligation to update or supplement forward-looking statements.
Overview
We are an office real estate investment trust ("REIT") that focuses primarily on serving the specialized requirements of strategic customers in the United States Government and defense information technology sectors. We acquire, develop, manage and lease office and data center
40
properties that are typically concentrated in large office parks primarily located adjacent to government demand drivers and/or in office markets that we believe possess growth opportunities.
Our revenues relating to real estate operations are derived from rents and property operating expense reimbursements earned from tenants leasing space in our properties. Most of our expenses relating to our real estate operations take the form of: (1) property operating costs, such as real estate taxes, utilities and repairs and maintenance; (2) interest costs; and (3) depreciation and amortization associated with our operating properties. Most of our profitability from real estate operations depends on our ability to maintain high levels of occupancy and increase rents, which is affected by a number of factors, including, among other things, our tenants' ability to fulfill their lease obligations and their continuing space needs based on, among other things, employment levels, business confidence and competition and general economic conditions of the markets in which we operate.
As described further in Item 1 to this Annual Report on Form 10-K in the section entitled, "Business and Growth Strategies," our strategy for operations and growth focuses on establishing and nurturing long-term relationships with quality tenants and accommodating their multi-locational needs, particularly tenants in the United States Government and defense information technology sectors. As a result of this strategy, a large concentration of our revenue is derived from several large tenants. At December 31, 2011, 60.3% of our annualized rental revenue (as defined below) from office properties was from our 20 largest tenants, 39.0% from our four largest tenants, 22.2% from our largest tenant, the United States Government, and 59.9% from properties occupied primarily by tenants in the United States Government and defense information technology sectors.
Our operations in recent years were adversely affected by the challenging economic conditions in the United States. Most of our regions experienced job losses to varying extents due in large part to these conditions, particularly in 2008 through 2010, prompting businesses to close, downsize their space requirements or cancel or delay expansion plans, which placed downward pressure on occupancy and rental rates. We did see some improvement in the leasing environment in 2011, although not as much as we were originally expecting. Tenants continued to be hesitant to make long-term leasing commitments given the uncertainty in the economy, and requests for lease renewals were often accompanied by a downsizing of space or reduction of rent, although to a lesser extent than in 2010. Our leasing activity in 2011 was further hindered by delays in the Federal budget approvals for the 2011 and 2012 fiscal years and uncertainty regarding the potential for future reductions in government spending targeting the United States Government and defense information technology sectors, both of which delayed new government and program contractor leasing. These factors, along with our placing into service of 286,000 newly constructed or redeveloped square feet that were unoccupied, contributed to a decrease in our office property occupancy from 87.6% at December 31, 2010 to 86.2% at December 31, 2011. Our occupancy of Same Office Properties also decreased from 90.1% at December 31, 2010 to 89.9% at December 31, 2011.
We expect our leasing efforts in early 2012 to benefit from the passage in late December 2011 of the defense budget bill for the 2012 fiscal year, which we expect will result in much of our previously delayed government and program contractor leasing taking place. However, we also expect the tepid economic recovery and continuing uncertainty regarding future defense spending cuts to contribute to a challenging lease environment in 2012, and perhaps beyond. We believe that our customer and market strategies are competitive advantages in the current leasing environment because we expect the United States Government and defense information technology sectors to fuel economic growth in many of our regions. In 2011, Federal agencies completed their relocation to government installations at Fort George G. Meade (in the Baltimore/Washington Corridor), Aberdeen Proving Ground (in the Greater Baltimore region), Redstone Arsenal (in Huntsville, Alabama), Fort Belvoir (in Springfield, Virginia) and San Antonio primarily in connection with mandates by the Base Realignment and Closure Commission of the United States Congress ("BRAC"). In addition, the newly-formed United States Cyber Command is located at Fort George G. Meade. We expect program contractors supporting those
41
agencies to locate near these installations. We expect that demand created by these government installations will, over the longer term, help stabilize the leasing markets in these regions and will provide future growth for us due to the installations' proximity to many of our properties. Although future defense spending cuts could reduce demand for new office space at our business parks, we do not believe that such spending decreases, were they to occur, would significantly affect existing defense information technology programs at the installations adjacent to our business parks. In addition, if military construction spending is cut, government demand to lease space in our business parks could possibly increase if the government decides to lease space instead of build it.
Our investing activities in 2011 were highlighted by the implementation of our Strategic Reallocation Plan, under which we plan to dispose of office properties and land that are no longer closely aligned with our strategy. The properties included in the Strategic Reallocation Plan had an estimated fair value of approximately $562 million at December 31, 2011. We expect to complete the office property dispositions by the end of 2013 and use the proceeds to invest in properties that will serve customers in the United States Government, defense information technology and related data sectors, to repay borrowings and for general corporate purposes. We completed sales under the Strategic Reallocation Plan totaling $76.7 million in 2011. In 2011, we also:
Our financing activities in 2011 were highlighted by our entry into a new Revolving Credit Facility effective September 1, 2011 with an aggregate lender commitment of $1.0 billion, with a right for us to further increase such commitment during the term to a maximum of $1.5 billion, subject to certain conditions. The facility matures on September 1, 2014, and may be extended by one year at our option, subject to certain conditions. In 2011, we also:
Our net income attributable to common shareholders decreased $160.4 million from 2010 to 2011. This decrease was due in large part to impairment losses of $151.0 million recognized primarily on
42
properties indentified for disposition under our Strategic Reallocation Plan and $29.8 million in losses recognized in connection with interest rate swaps that no longer qualified for hedge accounting since the originally forecasted borrowings associated with the swaps were no longer expected to occur.
We evaluate the operating performance of our properties using net operating income ("NOI") from real estate operations, our segment performance measure, which is derived by subtracting property operating expenses from revenues from real estate operations (please refer to the section below entitled "Results of Operations" for additional information pertaining to this measure). Our NOI from real estate operations increased from 2010 to 2011 due primarily to NOI from newly constructed or newly acquired properties. However, this increase was offset by decreases of $4.5 million in NOI from properties that were owned and 100% operational in 2010 and 2011, excluding properties held for future disposition (properties that we refer to collectively as "Same Office Properties"), and $6.5 million from operating properties held for future disposition or included in discontinued operations.
We discuss significant factors contributing to changes in our net income attributable to common shareholders and diluted earnings per share over the last three years in the section below entitled "Results of Operations." In addition, the section below entitled "Liquidity and Capital Resources" includes discussions of, among other things:
We refer to the measure "annualized rental revenue" in various sections of the Management's Discussion and Analysis of Financial Condition and Results of Operations section of this Annual Report on Form 10-K. Annualized rental revenue is a measure that we use to evaluate the source of our rental revenue as of a point in time. It is computed by multiplying by 12 the sum of monthly contractual base rents and estimated monthly expense reimbursements under active leases as of a point in time. Our computation of annualized rental revenue excludes the effect of lease incentives, although the effect of this exclusion is generally not material. We consider annualized rental revenue to be a useful measure for analyzing revenue sources because, since it is point-in-time based, it does not contain increases and decreases in revenue associated with periods in which lease terms were not in effect; historical revenue under generally accepted accounting principles in the United States of America ("GAAP") does contain such fluctuations. We find the measure particularly useful for leasing, tenant, segment and industry analysis.
Critical Accounting Policies and Estimates
Our consolidated financial statements are prepared in accordance with GAAP, which require us to make certain estimates and assumptions. A summary of our significant accounting policies is provided in Note 2 to our consolidated financial statements. The following section is a summary of certain aspects of those accounting policies involving estimates and assumptions that (1) require our most difficult, subjective or complex judgments in accounting for uncertain matters or matters that are susceptible to change and (2) materially affect our reported operating performance or financial condition. It is possible that the use of different reasonable estimates or assumptions in making these judgments could result in materially different amounts being reported in our consolidated financial statements. While reviewing this section, you should refer to Note 2 to our consolidated financial statements, including terms defined therein.
43
Acquisitions of Properties
When we acquire properties, we allocate the purchase price to numerous tangible and intangible components. Most of the terms in this bullet section are discussed in further detail in Note 2 to the consolidated financial statements entitled "Acquisitions of Properties." Our process for determining the allocation to these components requires many estimates and assumptions, including the following: (1) determination of market rental rates; (2) estimation of leasing and tenant improvement costs associated with the remaining term of acquired leases; (3) assumptions used in determining the in-place lease value, if-vacant value and tenant relationship value, including the rental rates, period of time that it will take to lease vacant space and estimated tenant improvement and leasing costs; and (4) allocation of the if-vacant value between land and building. A change in any of the above key assumptions, which are subjective, can materially change not only the presentation of acquired properties in our consolidated financial statements but also our reported results of operations. The allocation to different components affects the following:
Impairment of Long-Lived Assets
If events or changes in circumstances indicate that the carrying values of operating properties, properties in development or land held for future development may be impaired, we perform a recovery analysis based on the estimated undiscounted future cash flows to be generated from the operations and eventual disposition of such properties. If the analysis indicates that the carrying value of a tested property is not recoverable from estimated future cash flows, it is written down to its estimated fair value and an impairment loss is recognized. Fair values are determined based on estimated future cash flows using appropriate discount and capitalization rates or third-party valuations or appraisals. The estimated cash flows used for the impairment analysis and determining the fair values are based on our plans for the tested property and our views of market and economic conditions. The estimates consider matters such as current and future rental rates, occupancies for the tested property and comparable properties, estimated operating and capital expenditures and recent sales data for comparable properties. Determining the appropriate capitalization rate also requires
44
significant judgment and is typically based on many factors, including the prevailing rate for the market or submarket, as well as the quality and location of the properties. Changes in the estimated future cash flows due to changes in our plans for a property, views of market and economic conditions and/or our ability to obtain development rights could result in recognition of impairment losses which, under the applicable accounting guidance, could be substantial.
Properties held for sale are carried at the lower of their carrying values (i.e., cost less accumulated depreciation and any impairment loss recognized, where applicable) or estimated fair values less costs to sell. Accordingly, decisions to sell certain operating properties, properties in development or land held for development will result in impairment losses if carrying values of the specific properties exceed their estimated fair values less costs to sell. The estimates of fair value consider matters such as recent sales data for comparable properties and, where applicable, contracts or the results of negotiations with prospective purchasers. These estimates are subject to revision as market conditions, and our assessment of such conditions, change.
Assessment of Lease Term
As discussed above, a significant portion of our portfolio is leased to the United States Government, and the majority of those leases consist of a series of one-year renewal options. Applicable accounting guidance requires us to recognize minimum rental payments on a straight-line basis over the terms of each lease and to assess the lease terms as including all periods for which failure to renew the lease imposes a penalty on the lessee in such amounts that a renewal appears, at the inception of the lease, to be reasonably assured. Factors to consider when determining whether a penalty is significant include the uniqueness of the purpose or location of the property, the availability of a comparable replacement property, the relative importance or significance of the property to the continuation of the lessee's line of business and the existence of leasehold improvements or other assets whose value would be impaired by the lessee vacating or discontinuing use of the leased property. We have concluded for a number of our leases, based on the factors above, that the United States Government's exercise of all of those renewal options is reasonably assured. Changes in these assessments could result in the write-off of any recorded assets associated with straight-line rental revenue and acceleration of depreciation and amortization expense associated with costs we have incurred related to these leases.
Revenue Recognition on Tenant Improvements
Most of our leases involve some form of improvements to leased space. When we are required to provide improvements under the terms of a lease, we need to determine whether the improvements constitute landlord assets or tenant assets. If the improvements are landlord assets, we capitalize the cost of the improvements and recognize depreciation expense associated with such improvements over the shorter of the useful life of the assets or the term of the lease and recognize any payments from the tenant as rental revenue over the term of the lease. If the improvements are tenant assets, we defer the cost of improvements funded by us as a lease incentive asset and amortize it as a reduction of rental revenue over the term of the lease. Our determination of whether improvements are landlord assets or tenant assets also may affect when we commence revenue recognition in connection with a lease.
In determining whether improvements constitute landlord or tenant assets, we consider numerous factors that may require subjective or complex judgments, including: whether the improvements are unique to the tenant or reusable by other tenants; whether the tenant is permitted to alter or remove the improvements without our consent or without compensating us for any lost fair value; whether the ownership of the improvements remains with us or remains with the tenant at the end of the lease term; and whether the economic substance of the lease terms is properly reflected.
45
Collectability of Accounts and Deferred Rent Receivable
Allowances for doubtful accounts and deferred rent receivable are established based on quarterly analyses of the risk of loss on specific accounts. The analyses place particular emphasis on past-due accounts and consider information such as the nature and age of the receivables, the payment history of the tenants, the financial condition of the tenants and our assessment of their ability to meet their lease obligations, the basis for any disputes and the status of related negotiations. Our estimate of the required allowance is subject to revision as these factors change and is sensitive to the effects of economic and market conditions on tenants.
Accounting Method for Investments
We use three different accounting methods to report our investments in entities: the consolidation method; the equity method; and the cost method (see Note 2 to our consolidated financial statements). We use the consolidation method when we own most of the outstanding voting interests in an entity and can control its operations. We also consolidate certain entities when control of such entities can be achieved through means other than voting rights ("variable interest entities" or "VIEs") if we are deemed to be the primary beneficiary. Generally, this applies when either (1) the equity investors (if any) lack one or more of the essential characteristics of a controlling financial interest; (2) the equity investment at risk is insufficient to finance that entity's activities without additional subordinated financial support; or (3) the equity investors have voting rights that are not proportionate to their economic interests and the activities of the entity involve, or are conducted on behalf of, an investor with a disproportionately small voting interest. We use the equity method of accounting when we own an interest in an entity and can exert significant influence over, but cannot control, the entity's operations.
In making these determinations, we need to make subjective estimates and judgments regarding the entity's future operating performance, financial condition, future valuation and other variables that may affect the cash flows of the entity. We must consider both our and our partner's ability to participate in the management of the entity's operations and make decisions that allow the parties to manage their economic risks. We may also need to estimate the probability of different scenarios taking place over time and their effect on the partners' cash flows. The conclusion reached as a result of this process affects whether or not we use the consolidation method in accounting for our investment or the equity method. Whether or not we consolidate an investment can materially affect our consolidated financial statements.
Accounting for Interest Rate Derivatives
We use interest rate derivatives to hedge the cash flows associated with interest rates on debt, including forecasted borrowings. When we designate a derivative as a cash flow hedge, we defer the effective portion of changes in its fair value to the accumulated other comprehensive income (loss) section of shareholders' equity and recognize the ineffective portion of changes in fair value of derivatives in earnings. If and when a derivative ceases to qualify as a cash flow hedge, we reclassify the associated accumulated other comprehensive income (loss) to net earnings (loss). Our accounting for derivatives requires that we make judgments in determining the nature of the derivatives and their effectiveness as hedges, including ones regarding the likelihood that a forecasted transaction will take place. Therefore, these judgments could materially affect our consolidated financial statements.
46
Concentration of Operations
Customer Concentration of Property Operations
The following schedule lists our 20 largest tenants in our portfolio of office properties based on percentage of annualized rental revenue:
| |
Percentage of Annualized Rental Revenue of Office Properties for 20 Largest Tenants as of December 31, |
|||||||||
|---|---|---|---|---|---|---|---|---|---|---|
Tenant
|
2011 | 2010 | 2009 | |||||||
United States of America |
22.2 | % | 21.6 | % | 19.0 | % | ||||
Northrop Grumman Corporation(1) |
6.9 | % | 7.2 | % | 7.8 | % | ||||
Booz Allen Hamilton, Inc. |
5.1 | % | 4.7 | % | 5.0 | % | ||||
Computer Sciences Corporation(1) |
4.8 | % | 4.1 | % | 2.9 | % | ||||
The MITRE Corporation |
1.8 | % | 1.8 | % | N/A | |||||
ITT Corporation(1) |
1.7 | % | 1.8 | % | 1.7 | % | ||||
Wells Fargo & Company(1) |
1.7 | % | 1.6 | % | 1.8 | % | ||||
The Aerospace Corporation(1) |
1.7 | % | 1.7 | % | 1.8 | % | ||||
L-3 Communications Holdings, Inc.(1) |
1.6 | % | 1.6 | % | 1.8 | % | ||||
CareFirst, Inc. |
1.6 | % | 1.7 | % | 1.6 | % | ||||
General Dynamics Corporation(1) |
1.5 | % | 1.0 | % | 1.9 | % | ||||
Kratos Defense & Security Solution, Inc.(1) |
1.4 | % | 1.4 | % | 1.4 | % | ||||
The Boeing Company(1) |
1.3 | % | 1.3 | % | 1.1 | % | ||||
Comcast Corporation(1) |
1.2 | % | 1.3 | % | 1.4 | % | ||||
AT&T Corporation(1) |
1.2 | % | 1.2 | % | 1.3 | % | ||||
Ciena Corporation |
1.1 | % | 1.0 | % | 1.0 | % | ||||
Raytheon Company(1) |
1.0 | % | N/A | N/A | ||||||
Science Applications International Corporation(1) |
0.9 | % | N/A | N/A | ||||||
Unisys Corporation |
0.8 | % | 0.9 | % | 1.1 | % | ||||
The Johns Hopkins Institutions(1) |
0.8 | % | 0.8 | % | 0.8 | % | ||||
Merck & Co., Inc.(1) |
N/A | 0.6 | % | 0.6 | % | |||||
First Mariner Bank(1) |
N/A | 0.6 | % | N/A | ||||||
BAE Systems PLC(1) |
N/A | N/A | 0.7 | % | ||||||
Lockheed Martin Corporation |
N/A | N/A | 0.6 | % | ||||||
Subtotal of 20 largest tenants |
60.3 | % | 57.9 | % | 55.3 | % | ||||
All remaining tenants |
39.7 | % | 42.1 | % | 44.7 | % | ||||
Total |
100.0 | % | 100.0 | % | 100.0 | % | ||||
The United States Government increased in large part due to it taking occupancy of a significant portion of our newly-constructed square feet placed in service.
47
Our properties occupied primarily by tenants in the United States Government and defense information technology sectors accounted for 59.9% of our annualized rental revenue from office properties at December 31, 2011, an increase from 58.5% at December 31, 2010 and 53.8% at December 31, 2009. The increase is due primarily to newly-constructed properties placed into service and acquisitions of operating properties, although the disposition of properties under the Strategic Reallocation Plan also contributed to the increase in 2011. We believe that we are well positioned for future growth in the concentration of our revenue derived from customers in these sectors, as discussed further in the section in Item 1 to this Annual Report on Form 10-K entitled "Business and Growth Strategies." We generally classify the revenue from our leases into sector groupings based solely on our knowledge of the tenants' operations in leased space. We do not use independent sources such as Standard Industrial Classification codes for classifying our revenue into industry groupings and if we did, the resulting groupings would be materially different.
Geographic Concentration of Property Operations
The table below sets forth the regional allocation of our annualized rental revenue of office properties as of the end of the last three calendar years:
| |
Percentage of Annualized Rental Revenue of Office Properties as of December 31, |
Number of Office Properties as of December 31, |
|||||||||||||||||
|---|---|---|---|---|---|---|---|---|---|---|---|---|---|---|---|---|---|---|---|
Region
|
2011 | 2010 | 2009 | 2011 | 2010 | 2009 | |||||||||||||
Baltimore/Washington Corridor |
45.6 | % | 44.1 | % | 45.5 | % | 111 | 112 | 110 | ||||||||||
Northern Virginia |
16.0 | % | 16.4 | % | 17.4 | % | 17 | 17 | 15 | ||||||||||
San Antonio |
5.8 | % | 5.7 | % | 3.5 | % | 9 | 8 | 6 | ||||||||||
Washington, DC—Capitol Riverfront |
3.0 | % | 3.4 | % | N/A | 2 | 2 | N/A | |||||||||||
St. Mary's and King George Counties |
3.4 | % | 2.9 | % | 3.3 | % | 19 | 18 | 18 | ||||||||||
Greater Baltimore |
12.6 | % | 14.9 | % | 15.5 | % | 46 | 66 | 64 | ||||||||||
Suburban Maryland |
4.1 | % | 3.9 | % | 4.7 | % | 8 | 8 | 8 | ||||||||||
Colorado Springs |
5.1 | % | 5.2 | % | 5.9 | % | 21 | 21 | 21 | ||||||||||
Greater Philadelphia |
1.7 | % | 1.5 | % | 1.6 | % | 2 | 2 | 3 | ||||||||||
Other |
2.7 | % | 2.0 | % | 2.6 | % | 3 | 2 | 8 | ||||||||||
|
100.0 | % | 100.0 | % | 100.0 | % | 238 | 256 | 253 | ||||||||||
The most significant changes in our regional allocations set forth above was due to newly-constructed properties placed into service and acquisitions of operating office properties, although the disposition of properties under our Strategic Reallocation Plan contributed to much of the decrease in the Greater Baltimore region in 2011.
48
Occupancy and Leasing
Office Properties
The tables below set forth occupancy information pertaining to our portfolio of operating office properties:
| |
December 31, | |||||||||
|---|---|---|---|---|---|---|---|---|---|---|
| |
2011 | 2010 | 2009 | |||||||
Occupancy rates at year end |
||||||||||
Total |
86.2 | % | 87.6 | % | 90.0 | % | ||||
Baltimore/Washington Corridor |
87.9 | % | 88.1 | % | 90.2 | % | ||||
Northern Virginia |
84.8 | % | 91.9 | % | 96.6 | % | ||||
San Antonio |
90.7 | % | 100.0 | % | 100.0 | % | ||||
Washington, DC—Capitol Riverfront |
89.6 | % | 98.5 | % | N/A | |||||
St. Mary's and King George Counties |
87.3 | % | 86.8 | % | 97.8 | % | ||||
Greater Baltimore |
84.5 | % | 85.0 | % | 80.3 | % | ||||
Suburban Maryland |
79.6 | % | 76.5 | % | 89.6 | % | ||||
Colorado Springs |
74.9 | % | 76.2 | % | 85.8 | % | ||||
Greater Philadelphia |
99.7 | % | 100.0 | % | 100.0 | % | ||||
Other |
100.0 | % | 100.0 | % | 99.6 | % | ||||
Average contractual annual rental rate per square foot at year end(1) |
$ | 26.59 | $ | 25.58 | $ | 24.60 | ||||
| |
Rentable Square Feet |
Occupied Square Feet |
|||||
|---|---|---|---|---|---|---|---|
| |
(in thousands) |
||||||
December 31, 2010 |
20,432 | 17,899 | |||||
Square feet vacated upon lease expiration(1) |
— | (932 | ) | ||||
Square feet retenanted after lease expiration(2) |
— | 802 | |||||
Square feet constructed or redeveloped |
801 | 515 | |||||
Acquisition |
138 | 138 | |||||
Dispositions |
(894 | ) | (739 | ) | |||
Other changes |
37 | 2 | |||||
December 31, 2011 |
20,514 | 17,685 | |||||
Please refer to the section above entitled "Overview" for discussion regarding our leasing activity in 2011 and our expectations regarding the future outlook. Most of the decrease in occupancy rates reflected above for our Northern Virginia and San Antonio regions was attributable to newly constructed or redeveloped square feet placed in service that were unoccupied.
We were successful in completing 3.8 million square feet of leasing in 2011, including 811,000 of construction, redevelopment and other first generation (never before occupied) space, and the renewal of 74.8% of the square footage of our lease expirations (including the effect of early renewals) for the year ended December 31, 2011. For leasing of second generation (previously occupied) space completed in 2011, annualized rents decreased on average by approximately 3.2% and revenue under
49
GAAP increased on average by approximately 5.2% relative to the leases previously in place for the space; these leases had a weighted average lease term of approximately 4.4 years and the average estimated tenant improvements and lease costs associated with completing this leasing was approximately $11.85 per square foot.
At December 31, 2011, we had 789,000 square feet under construction that was 23% leased. We are constructing this space in anticipation of demand from the United States Government and defense information technology sectors. We believe that we need to commence construction on properties that are not pre-leased to a certain extent to enable us to meet demand from these sectors in a short timeframe. However, we expect that we will be less likely to commence construction on projects prior to more definitive leasing prospects being in place in 2012 than we have been historically.
We believe that our continuing exposure to the challenging leasing environment is mitigated to a certain extent by the generally long-term nature of our leases and the staggered timing of our future lease expirations. Our weighted average lease term for office properties at December 31, 2011 was approximately five years. The table below sets forth as of December 31, 2011 our scheduled lease expirations of office properties by region in terms of percentage of annualized rental revenue:
| |
Year of Lease Expiration of Annualized Rental Revenue of Office Properties |
|
||||||||||||||||||||
|---|---|---|---|---|---|---|---|---|---|---|---|---|---|---|---|---|---|---|---|---|---|---|
| |
2012 | 2013 | 2014 | 2015 | 2016 | Thereafter | Total | |||||||||||||||
Baltimore/Washington Corridor |
6.4 | % | 8.6 | % | 5.1 | % | 6.9 | % | 5.4 | % | 13.2 | % | 45.6 | % | ||||||||
Northern Virginia |
2.2 | % | 0.8 | % | 3.0 | % | 4.2 | % | 0.6 | % | 5.0 | % | 16.0 | % | ||||||||
San Antonio |
0.3 | % | 0.0 | % | 0.0 | % | 0.0 | % | 0.0 | % | 5.5 | % | 5.8 | % | ||||||||
Washington, DC—Capitol Riverfront |
0.1 | % | 1.2 | % | 0.7 | % | 0.3 | % | 0.4 | % | 0.4 | % | 3.0 | % | ||||||||
St. Mary's and King George Counties |
1.4 | % | 0.5 | % | 0.4 | % | 0.3 | % | 0.3 | % | 0.6 | % | 3.4 | % | ||||||||
Greater Baltimore |
1.5 | % | 0.7 | % | 1.0 | % | 1.3 | % | 2.1 | % | 6.0 | % | 12.6 | % | ||||||||
Suburban Maryland |
0.1 | % | 0.3 | % | 0.5 | % | 0.6 | % | 0.5 | % | 2.0 | % | 4.1 | % | ||||||||
Colorado Springs |
0.3 | % | 0.6 | % | 0.8 | % | 0.4 | % | 0.6 | % | 2.4 | % | 5.1 | % | ||||||||
Greater Philadelphia |
0.0 | % | 0.0 | % | 0.0 | % | 0.6 | % | 0.0 | % | 1.1 | % | 1.7 | % | ||||||||
Other |
0.0 | % | 0.0 | % | 0.8 | % | 0.0 | % | 0.0 | % | 1.9 | % | 2.7 | % | ||||||||
Total |
12.3 | % | 12.7 | % | 12.2 | % | 14.7 | % | 9.9 | % | 38.2 | % | 100.0 | % | ||||||||
As noted above, most of the leases with our largest tenant, the United States Government, provide for consecutive one-year terms or provide for early termination rights; all of the leasing statistics set forth above assume that the United States Government will remain in the space that they lease through the end of the respective arrangements, without ending consecutive one-year leases prematurely or exercising early termination rights.
Wholesale Data Center Property
Our shell-complete wholesale data center property, which upon completion and stabilization is expected to have a critical load of 18 megawatts, had three megawatts in operation at December 31, 2011 and 2010 that was leased to tenants with further expansion rights of up to a combined five megawatts. We did not complete any leases on this property in 2011.
Results of Operations
As discussed above, we evaluate the operating performance of our properties using NOI from real estate operations, our segment performance measure which is derived by subtracting property operating
50
expenses from revenues from real estate operations. We view our NOI from real estate operations as being comprised of the following primary categories:
You may refer to Note 18 of the consolidated financial statements for a summary of operating properties that were either disposed or classified as held for sale and therefore are included in discontinued operations.
In addition to owning real estate properties, we provide construction management and other services. The primary manner in which we evaluate the operating performance of our construction contract and other services is through a measure we define as NOI from service operations, which is based on the net of the revenues and expenses from these activities. The revenues and expenses from these activities consist primarily of subcontracted costs that are reimbursed to us by customers along with a management fee. The operating margins from these activities are small relative to the revenue. We believe NOI from service operations is a useful measure in assessing both our level of activity and our profitability in conducting such operations.
We believe that operating income, as reported on our consolidated statements of operations, is the most directly comparable GAAP measure for both NOI from real estate operations and NOI from service operations. Since both of these measures exclude certain items includable in operating income, reliance on these measures has limitations; management compensates for these limitations by using the measures simply as supplemental measures that are considered alongside other GAAP and non-GAAP measures.
The table below reconciles NOI from real estate operations and NOI from service operations to operating income reported on our consolidated statement of operations:
| |
For the Years Ended December 31, | |||||||||
|---|---|---|---|---|---|---|---|---|---|---|
| |
2011 | 2010 | 2009 | |||||||
| |
(in thousands) |
|||||||||
NOI from real estate operations |
$ | 299,816 | $ | 281,965 | $ | 292,315 | ||||
NOI from service operations |
2,706 | 2,373 | 6,568 | |||||||
NOI from discontinued operations |
(14,153 | ) | (18,367 | ) | (43,747 | ) | ||||
Depreciation and amortization associated with real estate operations |
(127,444 | ) | (113,234 | ) | (97,869 | ) | ||||
Impairment losses |
(127,765 | ) | — | — | ||||||
General and administrative expense |
(25,843 | ) | (24,008 | ) | (23,240 | ) | ||||
Business development expenses |
(3,195 | ) | (4,197 | ) | (3,699 | ) | ||||
Operating income |
$ | 4,122 | $ | 124,532 | $ | 130,328 | ||||
51
Comparison of the Year Ended December 31, 2011 to the Year Ended December 31, 2010
| |
For the Years Ended December 31, | |||||||||
|---|---|---|---|---|---|---|---|---|---|---|
| |
2011 | 2010 | Variance | |||||||
| |
(in thousands) |
|||||||||
Revenues |
||||||||||
Revenues from real estate operations |
$ | 472,496 | $ | 432,923 | $ | 39,573 | ||||
Construction contract and other service revenues |
84,345 | 104,675 | (20,330 | ) | ||||||
Total revenues |
556,841 | 537,598 | 19,243 | |||||||
Expenses |
||||||||||
Property operating expenses |
186,833 | 169,325 | 17,508 | |||||||
Depreciation and amortization associated with real estate operations |
127,444 | 113,234 | 14,210 | |||||||
Construction contract and other service expenses |
81,639 | 102,302 | (20,663 | ) | ||||||
Impairment losses |
127,765 | — | 127,765 | |||||||
General and administrative expense |
25,843 | 24,008 | 1,835 | |||||||
Business development expenses |
3,195 | 4,197 | (1,002 | ) | ||||||
Total operating expenses |
552,719 | 413,066 | 139,653 | |||||||
Operating income |
4,122 | 124,532 | (120,410 | ) | ||||||
Interest expense |
(101,281 | ) | (98,748 | ) | (2,533 | ) | ||||
Interest and other income |
5,603 | 9,568 | (3,965 | ) | ||||||
Loss on interest rate derivatives |
(29,805 | ) | — | (29,805 | ) | |||||
Loss on early extinguishment of debt |
(1,683 | ) | — | (1,683 | ) | |||||
Equity in (loss) income of unconsolidated entities |
(331 | ) | 1,376 | (1,707 | ) | |||||
Income tax benefit (expense) |
10,679 | (108 | ) | 10,787 | ||||||
(Loss) income from continuing operations |
(112,696 | ) | 36,620 | (149,316 | ) | |||||
Discontinued operations |
(14,343 | ) | 6,055 | (20,398 | ) | |||||
Gain (loss) on sales of real estate, net of income taxes |
2,721 | 2,829 | (108 | ) | ||||||
Net (loss) income |
(124,318 | ) | 45,504 | (169,822 | ) | |||||
Net loss (income) attributable to noncontrolling interests |
6,643 | (2,744 | ) | 9,387 | ||||||
Preferred share dividends |
(16,102 | ) | (16,102 | ) | — | |||||
Net (loss) income attributable to COPT common shareholders |
$ | (133,777 | ) | $ | 26,658 | $ | (160,435 | ) | ||
52
NOI from Real Estate Operations
| |
For the Years Ended December 31, | |||||||||
|---|---|---|---|---|---|---|---|---|---|---|
| |
2011 | 2010 | Variance | |||||||
| |
(in thousands) |
|||||||||
Revenues |
||||||||||
Same Office Properties |
$ | 370,473 | $ | 370,727 | $ | (254 | ) | |||
Constructed properties placed in service |
31,895 | 11,100 | 20,795 | |||||||
Acquired properties |
30,348 | 8,377 | 21,971 | |||||||
Operating properties held for future disposition |
38,399 | 40,276 | (1,877 | ) | ||||||
Discontinued operations |
23,336 | 28,805 | (5,469 | ) | ||||||
Other |
1,381 | 2,443 | (1,062 | ) | ||||||
|
495,832 | 461,728 | 34,104 | |||||||
Property operating expenses |
||||||||||
Same Office Properties |
144,077 | 139,873 | 4,204 | |||||||
Constructed properties placed in service |
7,475 | 2,831 | 4,644 | |||||||
Acquired properties |
12,891 | 3,494 | 9,397 | |||||||
Operating properties held for future disposition |
15,069 | 14,656 | 413 | |||||||
Discontinued operations |
9,183 | 10,438 | (1,255 | ) | ||||||
Other |
7,321 | 8,471 | (1,150 | ) | ||||||
|
196,016 | 179,763 | 16,253 | |||||||
NOI from real estate operations |
||||||||||
Same Office Properties |
226,396 | 230,854 | (4,458 | ) | ||||||
Constructed properties placed in service |
24,420 | 8,269 | 16,151 | |||||||
Acquired properties |
17,457 | 4,883 | 12,574 | |||||||
Operating properties held for future disposition |
23,330 | 25,620 | (2,290 | ) | ||||||
Discontinued operations |
14,153 | 18,367 | (4,214 | ) | ||||||
Other |
(5,940 | ) | (6,028 | ) | 88 | |||||
|
$ | 299,816 | $ | 281,965 | $ | 17,851 | ||||
As the table above indicates, our increase in NOI from real estate operations was attributable to the additions of properties through construction and acquisition activities.
With regard to changes in NOI from real estate operations attributable to Same Office Properties:
53
NOI from Service Operations
| |
For the Years Ended December 31, | |||||||||
|---|---|---|---|---|---|---|---|---|---|---|
| |
2011 | 2010 | Variance | |||||||
| |
(in thousands) |
|||||||||
Construction contract and other service revenues |
$ | 84,345 | $ | 104,675 | $ | (20,330 | ) | |||
Construction contract and other service expenses |
81,639 | 102,302 | (20,663 | ) | ||||||
NOI from service operations |
$ | 2,706 | $ | 2,373 | $ | 333 | ||||
NOI from service operations decreased due primarily to a lower volume of construction activity in connection with one large construction contract that was nearing completion. As evidenced in the changes set forth above, our volume of construction contract activity is inherently subject to significant variability depending on the volume and nature of projects undertaken by us (primarily on behalf of tenants). We view our service operations as an ancillary component of our overall operations that should generally be a small contributor to our operating income relative to our real estate operations.
Depreciation and Amortization Associated with Real Estate Operations
Depreciation and amortization expense associated with real estate included in continuing operations increased due primarily to expense attributable to properties added into operations through construction and acquisition activities.
General and Administrative Expenses
During 2011, certain of our executives voluntarily cancelled performance share units ("PSUs") that were originally granted to such executives in 2010. We recognized a non-cash compensation charge of $1.2 million in 2011 in connection with these PSU cancellations, most of which was included in general and administrative expenses. We will have no further compensation charges in the future in connection with the cancelled PSUs.
Impairment Losses
We recognized the impairment losses described below in 2011:
54
The table below sets forth the impairment losses recognized in 2011 by period of recognition and by property classification:
| |
Three Months Ended | ||||||||||||
|---|---|---|---|---|---|---|---|---|---|---|---|---|---|
| |
3/31/2011 | 6/30/2011 | 12/31/2011 | Total | |||||||||
| |
(in thousands) |
||||||||||||
Non-operating properties |
$ | 27,742 | $ | 13,574 | $ | 39,193 | $ | 80,509 | |||||
Operating properties |
— | 31,031 | 39,481 | 70,512 | |||||||||
Total |
$ | 27,742 | $ | 44,605 | $ | 78,674 | $ | 151,021 | |||||
The timely disposition of assets that no longer meet our strategic objectives is a key component of our strategy. Our identification of additional properties for disposition in future periods could result in our recognition of additional impairment losses in such periods.
Interest Expense
The table below sets forth the components of our interest expense included in continuing operations:
| |
For the Years Ended December 31, | |||||||||
|---|---|---|---|---|---|---|---|---|---|---|
| |
2011 | 2010 | Variance | |||||||
| |
(in thousands) |
|||||||||
Interest on mortgage and other secured loans |
$ | 75,760 | $ | 82,635 | $ | (6,875 | ) | |||
Interest on Exchangeable Senior Notes |
20,267 | 19,348 | 919 | |||||||
Interest on Revolving Credit Facility |
10,158 | 5,923 | 4,235 | |||||||
Interest expense recognized on interest rate swaps |
4,600 | 3,689 | 911 | |||||||
Amortization of deferred financing costs |
6,596 | 5,871 | 725 | |||||||
Other interest |
4,320 | 1,186 | 3,134 | |||||||
Interest expense reclassified to discontinued operations |
(3,020 | ) | (3,380 | ) | 360 | |||||
Capitalized interest |
(17,400 | ) | (16,524 | ) | (876 | ) | ||||
Total |
$ | 101,281 | $ | 98,748 | $ | 2,533 | ||||
The increase in interest expense included the effect of a $181.4 million increase in our average outstanding debt resulting primarily from our financing of acquisition and construction activities. The table above reflects the effects of our repayments of secured debt and our maintaining a higher weighted average borrowing level on the Revolving Credit Facility in 2011.
55
Loss on Interest Rate Swaps
On April 5, 2011, we entered into two forward starting LIBOR swaps for an aggregate notional amount of $175 million designated as cash flow hedges of interest payments on ten-year, fixed-rate borrowings forecasted to occur between August 2011 and April 2012. After meeting with our Board of Trustees on December 21, 2011, we determined that we would pursue other financing options and concluded that the originally forecasted borrowings were expected not to occur. Accordingly, the swaps no longer qualified for hedge accounting. On December 22, 2011, we entered into two reverse forward starting LIBOR swaps for an aggregate notional amount of $175 million in order to remove the majority of the variability in the termination value of the forward starting swaps entered into on April 5, 2011. We recognized an aggregate loss of $29.8 million on these interest rate swaps in December 2011, most of which was reclassified from accumulated other comprehensive losses at the time the swaps entered into on April 5, 2011 no longer qualified for hedge accounting. On January 5, 2012, we cash settled all of the forward starting swaps entered into on April 5, 2011 and December 22, 2011 for an aggregate of $29.7 million using borrowings from our Revolving Credit Facility.
Interest and Other Income
The decrease in interest and other income was due primarily to a decrease in gain recognized on our investment in common stock of The KEYW Holding Corporation ("KEYW"), an entity supporting the intelligence community's operations and transformation to Cyber Age mission by providing engineering services and integrated platforms that support the intelligence process. We used the equity method of accounting for our investment in KEYW common stock until the resignation of our Chief Executive Officer from the Board of Directors of KEYW effective July 1, 2011, at which time we began accounting for our investment in KEYW's common stock as a trading marketable equity security to be reported at fair value, with unrealized gains and losses recognized through earnings. Most of the decrease in gain was attributable to additional equity issued by KEYW in connection with its initial public offering of common stock in 2010; no similar event occurred in 2011.
Income Tax (Benefit) Expense
The income tax benefit in 2011 was due primarily to an $8.7 million benefit on impairment losses recognized by our taxable REIT subsidiary in connection with the Strategic Reallocation Plan; we recognized $4.6 million of this benefit in the three months ended June 30, 2011 and $4.1 million in the three months ended December 31, 2011
Discontinued Operations
The decrease in discontinued operations was due primarily to $23.3 million in impairment losses recognized in connection with the Strategic Reallocation Plan described above.
Net Loss (Income) Attributable to Noncontrolling Interests
Interests in our Operating Partnership are in the form of preferred and common units. The line entitled net loss (income) attributable to noncontrolling interests includes primarily loss or income allocated to preferred and common units not owned by us. Income is allocated to noncontrolling preferred unitholders in an amount equal to the priority return from the Operating Partnership to which they are entitled. Income is allocated to noncontrolling common unitholders based on income earned by the Operating Partnership, after allocation to preferred unitholders, multiplied by the percentage of the common units in the Operating Partnership owned by those common unitholders.
The net loss (income) attributable to noncontrolling interests changed due primarily to the decrease in net income available to allocate to noncontrolling holders of common units in the Operating Partnership primarily resulting from the reasons set forth above.
56
Comparison of the Year Ended December 31, 2010 to the Year Ended December 31, 2009
| |
For the Years Ended December 31, | |||||||||
|---|---|---|---|---|---|---|---|---|---|---|
| |
2010 | 2009 | Variance | |||||||
| |
(in thousands) |
|||||||||
Revenues |
||||||||||
Revenues from real estate operations |
$ | 432,923 | $ | 394,541 | $ | 38,382 | ||||
Construction contract and other service revenues |
104,675 | 343,087 | (238,412 | ) | ||||||
Total revenues |
537,598 | 737,628 | (200,030 | ) | ||||||
Expenses |
||||||||||
Property operating expenses |
169,325 | 145,973 | 23,352 | |||||||
Depreciation and amortization associated with real estate operations |
113,234 | 97,869 | 15,365 | |||||||
Construction contract and other service expenses |
102,302 | 336,519 | (234,217 | ) | ||||||
General and administrative expense |
24,008 | 23,240 | 768 | |||||||
Business development expenses |
4,197 | 3,699 | 498 | |||||||
Total operating expenses |
413,066 | 607,300 | (194,234 | ) | ||||||
Operating income |
124,532 | 130,328 | (5,796 | ) | ||||||
Interest expense |
(98,748 | ) | (79,789 | ) | (18,959 | ) | ||||
Interest and other income |
9,568 | 5,164 | 4,404 | |||||||
Equity in income (loss) of unconsolidated entities |
1,376 | (941 | ) | 2,317 | ||||||
Income tax expense |
(108 | ) | (196 | ) | 88 | |||||
Income from continuing operations |
36,620 | 54,566 | (17,946 | ) | ||||||
Discontinued operations |
6,055 | 6,733 | (678 | ) | ||||||
Gain on sales of real estate, net of income taxes |
2,829 | — | 2,829 | |||||||
Net income |
45,504 | 61,299 | (15,795 | ) | ||||||
Net income attributable to noncontrolling interests |
(2,744 | ) | (4,970 | ) | 2,226 | |||||
Preferred share dividends |
(16,102 | ) | (16,102 | ) | — | |||||
Net income attributable to COPT common shareholders |
$ | 26,658 | $ | 40,227 | $ | (13,569 | ) | |||
57
NOI from Continuing Real Estate Operations
| |
For the Years Ended December 31, | |||||||||
|---|---|---|---|---|---|---|---|---|---|---|
| |
2010 | 2009 | Variance | |||||||
| |
(in thousands) |
|||||||||
Revenues |
||||||||||
Same Office Properties |
$ | 337,844 | $ | 337,251 | $ | 593 | ||||
Acquired properties |
28,324 | 3,333 | 24,991 | |||||||
Constructed properties placed in service |
24,361 | 6,467 | 17,894 | |||||||
Operating properties held for future disposition |
40,276 | 39,869 | 407 | |||||||
Discontinued operations |
28,805 | 32,314 | (3,509 | ) | ||||||
Other |
2,118 | 7,621 | (5,503 | ) | ||||||
|
461,728 | 426,855 | 34,873 | |||||||
Property operating expenses |
||||||||||
Same Office Properties |
126,739 | 120,534 | 6,205 | |||||||
Acquired properties |
11,465 | 932 | 10,533 | |||||||
Constructed properties placed in service |
8,177 | 2,810 | 5,367 | |||||||
Operating properties held for future disposition |
14,656 | 13,888 | 768 | |||||||
Discontinued operations |
10,438 | 11,433 | (995 | ) | ||||||
Other |
8,288 | 7,809 | 479 | |||||||
|
179,763 | 157,406 | 22,357 | |||||||
NOI from continuing real estate operations |
||||||||||
Same Office Properties |
211,105 | 216,717 | (5,612 | ) | ||||||
Acquired properties |
16,859 | 2,401 | 14,458 | |||||||
Constructed properties placed in service |
16,184 | 3,657 | 12,527 | |||||||
Operating properties held for future disposition |
25,620 | 25,981 | (361 | ) | ||||||
Discontinued operations |
18,367 | 20,881 | (2,514 | ) | ||||||
Other |
(6,170 | ) | (188 | ) | (5,982 | ) | ||||
|
$ | 281,965 | $ | 269,449 | $ | 12,516 | ||||
As the table above indicates, most of our increase in NOI from continuing real estate operations was attributable to the additions of properties through acquisition and construction activities. In addition, the lines in the table above entitled "Other" include the effects of vacancies in three properties expected to be redeveloped, including approximately 300,000 square feet at two properties in Greater Philadelphia; we experienced a $5.4 million decrease in NOI from continuing real estate operations attributable to these properties.
With regard to changes in NOI from continuing real estate operations attributable to Same Office Properties:
58
NOI from Service Operations
| |
For the Years Ended December 31, | |||||||||
|---|---|---|---|---|---|---|---|---|---|---|
| |
2010 | 2009 | Variance | |||||||
| |
(in thousands) |
|||||||||
Construction contract and other service revenues |
$ | 104,675 | $ | 343,087 | $ | (238,412 | ) | |||
Construction contract and other service expenses |
102,302 | 336,519 | (234,217 | ) | ||||||
NOI from service operations |
$ | 2,373 | $ | 6,568 | $ | (4,195 | ) | |||
NOI from service operations decreased due primarily to a lower volume of construction activity in connection with one large construction contract that was winding down.
Depreciation and Amortization Associated with Real Estate Operations
Depreciation and amortization expense associated with real estate included in continuing operations increased due primarily to expense attributable to properties added into operations through acquisition and construction activities.
Interest Expense
The table below sets forth the components of our interest expense included in continuing operations:
| |
For the Years Ended December 31, | |||||||||
|---|---|---|---|---|---|---|---|---|---|---|
| |
2010 | 2009 | Variance | |||||||
| |
(in thousands) |
|||||||||
Interest on mortgage and other secured loans |
$ | 82,635 | $ | 70,624 | $ | 12,011 | ||||
Interest on Exchangeable Senior Notes |
19,348 | 9,207 | 10,141 | |||||||
Interest on Revolving Credit Facility |
5,923 | 6,272 | (349 | ) | ||||||
Interest expense recognized on interest rate swaps |
3,689 | 6,941 | (3,252 | ) | ||||||
Amortization of deferred financing costs |
5,871 | 4,215 | 1,656 | |||||||
Other interest |
1,186 | 622 | 564 | |||||||
Interest expense reclassified to discontinued operations |
(3,380 | ) | (2,631 | ) | (749 | ) | ||||
Capitalized interest |
(16,524 | ) | (15,461 | ) | (1,063 | ) | ||||
Total |
$ | 98,748 | $ | 79,789 | $ | 18,959 | ||||
The increase in interest expense included the effect of a $319.2 million increase in our average outstanding debt resulting from our financing of acquisition and construction activities. Also included was an increase in our weighted average interest rates of debt from 4.86% to 5.01%. The increase in the proportion of our interest expense attributable to Exchangeable Senior Notes resulted from our issuance of a $240.0 million aggregate principal amount of 4.25% Exchangeable Senior Notes in April 2010.
59
Interest and Other Income
Interest and other income increased due primarily to:
Gain on Sales of Real Estate, Net of Income Taxes
The increase in gain on sales of real estate was attributable to the sale of a land parcel in Central New Jersey in 2010.
Net Income Attributable to Noncontrolling Interests
Net income attributable to noncontrolling interests decreased due primarily to a decrease in net income available to allocate to noncontrolling holders of common units in the Operating Partnership primarily resulting from the reasons set forth above.
Adjusted Earnings Before Interest, Taxes, Depreciation and Amortization ("Adjusted EBITDA") Interest Coverage Ratio and Adjusted EBITDA Fixed Charge Coverage Ratio
Adjusted EBITDA is net (loss) income adjusted for the effects of interest expense, depreciation and amortization, impairment losses, loss on interest rate swaps and income taxes. We believe that Adjusted EBITDA is a useful supplemental measure for assessing our un-levered performance. We believe that net income, as reported on our consolidated statements of operations, is the most directly comparable GAAP measure to Adjusted EBITDA. Adjusted EBITDA excludes items that are included in net income, including some that require cash outlays; we compensate for this limitation by using the measure simply as a supplemental measure that is considered alongside other GAAP and non-GAAP measures. It should not be used as an alternative to net income when evaluating our financial performance or to cash flow from operating, investing and financing activities when evaluating our liquidity or ability to make cash distributions or pay debt service.
We use Adjusted EBITDA to calculate Adjusted EBITDA Interest Coverage Ratio and Adjusted EBITDA Fixed Charge Coverage Ratio. We calculate Adjusted EBITDA interest coverage by dividing Adjusted EBITDA by interest expense on continuing and discontinued operations (excluding amortization of deferred financing costs and amortization of debt discounts and premiums, net of amounts capitalized). We calculate Adjusted EBITDA fixed charge coverage ratio by dividing Adjusted EBITDA by the sum of: (1) interest expense on continuing and discontinued operations (excluding amortization of deferred financing costs and amortization of debt discounts and premiums, net of amounts capitalized); (2) dividends on preferred shares; and (3) distributions on preferred units in the Operating Partnership not owned by us.
60
The tables below set forth the computation of our Adjusted EBITDA interest and fixed charge coverage ratios and reconciliations of Adjusted EBITDA to net income reported on our consolidated statements of operations:
| |
For the Years Ended December 31, | |||||||||
|---|---|---|---|---|---|---|---|---|---|---|
| |
2011 | 2010 | 2009 | |||||||
| |
(Dollars in thousands) |
|||||||||
Net (loss) income |
$ | (124,318 | ) | $ | 45,504 | $ | 61,299 | |||
Interest expense(1) |
104,301 | 102,128 | 82,420 | |||||||
Income tax expense(2) |
(10,679 | ) | 119 | 196 | ||||||
Depreciation and amortization(1) |
136,594 | 125,819 | 111,811 | |||||||
Impairment losses(1) |
151,021 | — | — | |||||||
Loss on interest rate swaps |
29,805 | — | — | |||||||
Adjusted EBITDA |
$ | 286,724 | $ | 273,570 | $ | 255,726 | ||||
Interest expense(1) |
$ | 104,301 | $ | 102,128 | $ | 82,420 | ||||
Less: Amortization of deferred financing costs |
(6,596 | ) | (5,871 | ) | (4,214 | ) | ||||
Less: Amortization of net debt discounts and premiums, net of amounts capitalized |
(4,680 | ) | (4,974 | ) | (2,847 | ) | ||||
Denominator for Adjusted EBITDA interest coverage ratio |
$ | 93,025 | $ | 91,283 | $ | 75,359 | ||||
Preferred share dividends |
16,102 | 16,102 | 16,102 | |||||||
Preferred distributions |
660 | 660 | 660 | |||||||
Denominator for Adjusted EBITDA fixed charge coverage ratio |
$ | 109,787 | $ | 108,045 | $ | 92,121 | ||||
Adjusted EBITDA interest coverage ratio |
3.08x | 3.00x | 3.39x | |||||||
Adjusted EBITDA fixed charge coverage ratio |
2.61x | 2.53x | 2.78x | |||||||
Funds From Operations
Funds from operations ("FFO") is defined as net income computed using GAAP, excluding gains on sales of, and impairment losses on, previously depreciated operating properties, net of related tax benefit, plus real estate-related depreciation and amortization. We believe that we use the National Association of Real Estate Investment Trusts' ("NAREIT") definition of FFO, although others may interpret the definition differently and, accordingly, our presentation of FFO may differ from those of other REITs. We believe that FFO is useful to management and investors as a supplemental measure of operating performance because, by excluding gains related to sales of, and impairment losses on, previously depreciated operating properties, net of related tax benefit, and excluding real estate-related depreciation and amortization, FFO can help one compare our operating performance between periods. In addition, since most equity REITs provide FFO information to the investment community, we believe that FFO is useful to investors as a supplemental measure for comparing our results to those of other equity REITs. We believe that net income is the most directly comparable GAAP measure to FFO.
Since FFO excludes certain items includable in net income, reliance on the measure has limitations; management compensates for these limitations by using the measure simply as a supplemental measure that is weighed in the balance with other GAAP and non GAAP measures. FFO is not necessarily an indication of our cash flow available to fund cash needs. Additionally, it should not
61
be used as an alternative to net income when evaluating our financial performance or to cash flow from operating, investing and financing activities when evaluating our liquidity or ability to make cash distributions or pay debt service.
Basic FFO available to common share and common unit holders ("Basic FFO") is FFO adjusted to subtract (1) preferred share dividends, (2) income attributable to noncontrolling interests through ownership of preferred units in the Operating Partnership or interests in other consolidated entities not owned by us, (3) depreciation and amortization allocable to noncontrolling interests in other consolidated entities and (4) Basic FFO allocable to restricted shares. With these adjustments, Basic FFO represents FFO available to common shareholders and common unitholders. Common units in the Operating Partnership are substantially similar to our common shares and are exchangeable into common shares, subject to certain conditions. We believe that Basic FFO is useful to investors due to the close correlation of common units to common shares. We believe that net income is the most directly comparable GAAP measure to Basic FFO. Basic FFO has essentially the same limitations as FFO; management compensates for these limitations in essentially the same manner as described above for FFO.
Diluted FFO available to common share and common unit holders ("Diluted FFO") is Basic FFO adjusted to add back any changes in Basic FFO that would result from the assumed conversion of securities that are convertible or exchangeable into common shares. We believe that Diluted FFO is useful to investors because it is the numerator used to compute Diluted FFO per share, discussed below. We believe that the numerator for diluted EPS is the most directly comparable GAAP measure to Diluted FFO. Since Diluted FFO excludes certain items includable in the numerator to diluted EPS, reliance on the measure has limitations; management compensates for these limitations by using the measure simply as a supplemental measure that is weighed in the balance with other GAAP and non-GAAP measures. Diluted FFO is not necessarily an indication of our cash flow available to fund cash needs. Additionally, it should not be used as an alternative to net income when evaluating our financial performance or to cash flow from operating, investing and financing activities when evaluating our liquidity or ability to make cash distributions or pay debt service.
Diluted FFO, as adjusted for comparability is defined as Diluted FFO adjusted to exclude operating property acquisition costs, gain or loss on early extinguishment of debt, loss on interest rate swaps and other impairment losses, net of associated income tax. We believe that the excluded items are not reflective of normal operations and, as a result, we believe that a measure that excludes these items is a useful supplemental measure in evaluating our operating performance. We believe that the numerator to diluted EPS is the most directly comparable GAAP measure to this non-GAAP measure. This measure has essentially the same limitations as Diluted FFO, as well as the further limitation of not reflecting the effects of the excluded items; we compensate for these limitations in essentially the same manner as described above for Diluted FFO.
Diluted FFO per share is (1) Diluted FFO divided by (2) the sum of the (a) weighted average common shares outstanding during a period, (b) weighted average common units outstanding during a period and (c) weighted average number of potential additional common shares that would have been outstanding during a period if other securities that are convertible or exchangeable into common shares were converted or exchanged. We believe that Diluted FFO per share is useful to investors because it provides investors with a further context for evaluating our FFO results in the same manner that investors use earnings per share ("EPS") in evaluating net income available to common shareholders. In addition, since most equity REITs provide Diluted FFO per share information to the investment community, we believe that Diluted FFO per share is a useful supplemental measure for comparing us to other equity REITs. We believe that diluted EPS is the most directly comparable GAAP measure to Diluted FFO per share. Diluted FFO per share has most of the same limitations as Diluted FFO (described above); management compensates for these limitations in essentially the same manner as described above for Diluted FFO.
62
Diluted FFO per share, as adjusted for comparability is (1) Diluted FFO, as adjusted for comparability divided by (2) the sum of the (a) weighted average common shares outstanding during a period, (b) weighted average common units outstanding during a period and (c) weighted average number of potential additional common shares that would have been outstanding during a period if other securities that are convertible or exchangeable into common shares were converted or exchanged. We believe that this measure is useful to investors because it provides investors with a further context for evaluating our FFO results. We believe that diluted EPS is the most directly comparable GAAP measure to this per share measure. This measure has most of the same limitations as Diluted FFO (described above) as well as the further limitation of not reflecting the effects of the excluded items; we compensate for these limitations in essentially the same manner as described above for Diluted FFO.
The computations for all of the above measures on a diluted basis assume the conversion of common units in our Operating Partnership but do not assume the conversion of other securities that are convertible into common shares if the conversion of those securities would increase per share measures in a given period.
We use a measure called diluted FFO payout ratio, adjusted for comparability as a supplemental measure of our ability to make distributions to investors. This measure is defined as (1) the sum of (a) dividends on common shares and (b) distributions to holders of interests in the Operating Partnership and dividends on convertible preferred shares when such distributions and dividends are included in Diluted FFO divided by (2) Diluted FFO, adjusted for comparability.
63
The tables appearing below and on the following page set forth the computation of the above stated measures for the years ended December 31, 2007 through 2011 and provide reconciliations to the GAAP measures associated with such measures:
| |
For the Years Ended December 31, (Dollars and shares in thousands, except per share data) |
|||||||||||||||
|---|---|---|---|---|---|---|---|---|---|---|---|---|---|---|---|---|
| |
2011 | 2010 | 2009 | 2008 | 2007 | |||||||||||
Net (loss) income |
$ | (124,318 | ) | $ | 45,504 | $ | 61,299 | $ | 61,316 | $ | 35,942 | |||||
Add: Real estate-related depreciation and amortization |
134,131 | 123,243 | 109,386 | 102,772 | 106,260 | |||||||||||
Add: Depreciation and amortization on unconsolidated real estate entities |
492 | 631 | 640 | 648 | 666 | |||||||||||
Add: Impairment losses on previously depreciated operating properties |
70,512 | — | — | — | — | |||||||||||
Less: Gain on sales of previously depreciated operating properties, net of income taxes |
(4,811 | ) | (1,077 | ) | — | (2,630 | ) | (3,827 | ) | |||||||
FFO |
76,006 | 168,301 | 171,325 | 162,106 | 139,041 | |||||||||||
Less: Noncontrolling interests-preferred units in the Operating Partnership |
(660 | ) | (660 | ) | (660 | ) | (660 | ) | (660 | ) | ||||||
Less: Noncontrolling interests-other consolidated entities |
(1,038 | ) | 32 | 185 | (172 | ) | 122 | |||||||||
Less: Preferred share dividends |
(16,102 | ) | (16,102 | ) | (16,102 | ) | (16,102 | ) | (16,068 | ) | ||||||
Less: Depreciation and amortization allocable to noncontrolling interests in other consolidated entities |
(849 | ) | (1,402 | ) | (493 | ) | (270 | ) | (188 | ) | ||||||
Basic and Diluted FFO allocable to restricted shares |
(1,037 | ) | (1,524 | ) | (1,629 | ) | (1,310 | ) | (876 | ) | ||||||
Basic and Diluted FFO |
$ | 56,320 | $ | 148,645 | $ | 152,626 | $ | 143,592 | $ | 121,371 | ||||||
Operating property acquisition costs |
156 | 3,424 | 1,967 | — | — | |||||||||||
Other impairment losses |
80,509 | — | — | — | — | |||||||||||
Income tax benefit from other impairment losses |
(8,744 | ) | — | — | — | — | ||||||||||
Loss (gain) on early extinguishment of debt, net |
2,023 | — | — | (8,026 | ) | — | ||||||||||
Loss on interest rate derivatives |
29,805 | — | — | — | — | |||||||||||
Diluted FFO, as adjusted for comparability |
$ | 160,069 | $ | 152,069 | $ | 154,593 | $ | 135,566 | $ | 121,371 | ||||||
Weighted average common shares |
69,382 | 59,611 | 55,930 | 48,132 | 46,527 | |||||||||||
Conversion of weighted average common units |
4,355 | 4,608 | 5,717 | 8,107 | 8,296 | |||||||||||
Weighted average common shares/units—Basic FFO |
73,737 | 64,219 | 61,647 | 56,239 | 54,823 | |||||||||||
Dilutive effect of share-based compensation awards |
111 | 333 | 477 | 688 | 991 | |||||||||||
Weighted average common shares/units—Diluted FFO |
73,848 | 64,552 | 62,124 | 56,927 | 55,814 | |||||||||||
Diluted FFO per share |
$ | 0.76 | $ | 2.30 | $ | 2.46 | $ | 2.52 | $ | 2.17 | ||||||
Diluted FFO per share, as adjusted for comparability |
$ | 2.17 | $ | 2.36 | $ | 2.49 | $ | 2.38 | $ | 2.17 | ||||||
64
| |
For the Years Ended December 31, (Dollars and shares in thousands, except per share data) |
|||||||||||||||
|---|---|---|---|---|---|---|---|---|---|---|---|---|---|---|---|---|
| |
2011 | 2010 | 2009 | 2008 | 2007 | |||||||||||
Numerator for diluted EPS |
$ | (134,814 | ) | $ | 25,587 | $ | 39,217 | $ | 37,135 | $ | 15,616 | |||||
Add: Income allocable to noncontrolling interests-common units in the Operating Partnership |
(8,341 | ) | 2,116 | 4,495 | 6,519 | 3,203 | ||||||||||
Add: Real estate-related depreciation and amortization |
134,131 | 123,243 | 109,386 | 102,772 | 106,260 | |||||||||||
Add: Depreciation and amortization of unconsolidated real estate entities |
492 | 631 | 640 | 648 | 666 | |||||||||||
Add: Impairment losses on previously depreciated operating properties |
70,512 | — | — | — | — | |||||||||||
Add: Numerator for diluted EPS allocable to restricted shares |
1,037 | 1,071 | 1,010 | 728 | 517 | |||||||||||
Less: Depreciation and amortization allocable to noncontrolling interests in other consolidated entities |
(849 | ) | (1,402 | ) | (493 | ) | (270 | ) | (188 | ) | ||||||
Less: Basic and diluted FFO allocable to restricted shares |
(1,037 | ) | (1,524 | ) | (1,629 | ) | (1,310 | ) | (876 | ) | ||||||
Less: Gain on sales of previously depreciated operating properties, net of income taxes |
(4,811 | ) | (1,077 | ) | — | (2,630 | ) | (3,827 | ) | |||||||
Basic and Diluted FFO |
$ | 56,320 | $ | 148,645 | $ | 152,626 | $ | 143,592 | $ | 121,371 | ||||||
Operating property acquisition costs |
156 | 3,424 | 1,967 | — | — | |||||||||||
Other impairment losses |
80,509 | — | — | — | — | |||||||||||
Income tax benefit from other impairment losses |
(8,744 | ) | — | — | — | — | ||||||||||
Loss (gain) on early extinguishment of debt, net |
2,023 | — | — | (8,026 | ) | — | ||||||||||
Loss on interest rate derivatives |
29,805 | — | — | — | — | |||||||||||
Diluted FFO, as adjusted for comparability |
$ | 160,069 | $ | 152,069 | $ | 154,593 | $ | 135,566 | $ | 121,371 | ||||||
Denominator for diluted EPS |
69,382 | 59,944 | 56,407 | 48,820 | 47,518 | |||||||||||
Weighted average common units |
4,355 | 4,608 | 5,717 | 8,107 | 8,296 | |||||||||||
Anti-dilutive EPS effect of share-based compensation awards |
111 | — | — | — | — | |||||||||||
Denominator for diluted FFO per share measures |
73,848 | 64,552 | 62,124 | 56,927 | 55,814 | |||||||||||
Dividends on common shares |
116,717 | 98,510 | 87,596 | 70,836 | 61,331 | |||||||||||
Common unit distributions |
7,173 | 7,266 | 7,962 | 11,510 | 10,682 | |||||||||||
Numerator for diluted FFO payout ratio, adjusted for comparability |
123,890 | 105,776 | 95,558 | 82,346 | 72,013 | |||||||||||
Diluted FFO payout ratio, as adjusted for comparability |
77.4 | % | 69.6 | % | 61.8 | % | 60.7 | % | 59.3 | % | ||||||
65
Property Additions
The table below sets forth the major components of our additions to properties for 2011 and 2010:
| |
For the Years Ended December 31, | |||||||||
|---|---|---|---|---|---|---|---|---|---|---|
| |
2011 | 2010 | Variance | |||||||
| |
(in thousands) |
|||||||||
Construction, development and redevelopment(1) |
$ | 240,360 | $ | 303,586 | $ | (63,226 | ) | |||
Acquisitions of operating properties(2) |
26,887 | 187,052 | (160,165 | ) | ||||||
Tenant improvements on operating properties(3) |
47,147 | 23,781 | 23,366 | |||||||
Capital improvements on operating properties |
16,572 | 10,991 | 5,581 | |||||||
|
$ | 330,966 | $ | 525,410 | $ | (194,444 | ) | |||
Cash Flows
Our net cash flow provided by operating activities decreased $4.3 million from 2010 to 2011 due primarily to: (1) $17.3 million in previously accreted interest paid in connection with our repurchase of the 3.5% Exchangeable Senior Notes; offset in part by (2) an increase in cash flow received from real estate operations attributable to newly constructed and newly acquired properties.
Our net cash flow used in investing activities decreased $218.8 million from 2010 to 2011 due primarily to:
66
Our cash flow provided by financing activities decreased $220.9 million from 2010 to 2011 due primarily to:
Liquidity and Capital Resources
Our primary cash requirements are for operating expenses, debt service, development of new properties, improvements to existing properties and acquisitions. We expect to continue to use cash flow provided by operations as the primary source to meeting our short-term capital needs, including property operating expenses, general and administrative expenses, interest expense, scheduled principal amortization of debt, dividends to our shareholders, distributions to our noncontrolling interest holders of preferred and common units in the Operating Partnership and improvements to existing properties. We believe that our liquidity and capital resources are adequate for our near-term and longer-term requirements without necessitating property sales. However, we do expect to generate significant cash by selling properties in 2012 and 2013.
We have historically relied on fixed-rate, non-recourse mortgage loans from banks and institutional lenders for long-term financing and to restore availability on our Revolving Credit Facility. In recent years, we have relied more on fixed-rate, unsecured bank loans and publicly issued, convertible unsecured debt for long-term financing. We also periodically access the public equity markets to raise capital by issuing common and/or preferred shares.
67
We often use our Revolving Credit Facility to initially finance much of our investing activities. We then pay down the facility using proceeds from long-term borrowings, equity issuances and property sales. Effective September 1, 2011, we entered into the Revolving Credit Facility with a group of lenders for which J.P. Morgan Securities LLC and KeyBanc Capital Markets acted as join lead arrangers and joint book runners, KeyBank National Association acted as administrative agent and JPMorgan Chase Bank, N.A. and Bank of America, N.A. acted as co-syndication agents. The lenders' aggregate commitment under the new facility is $1.0 billion, with a right for us to increase the lenders' aggregate commitment to $1.5 billion, provided that there is no default under the facility. Amounts available under the facility are computed based on 60% of our unencumbered asset value, as defined in the agreement. The Revolving Credit Facility matures on September 1, 2014, and may be extended by one year at our option, provided that there is no default under the facility and we pay an extension fee of 0.20% of the total availability of the facility. As of December 31, 2011, the maximum borrowing capacity under this facility totaled $1.0 billion, of which $329.6 million was available.
We also have a Term Loan Agreement with the same group of lenders as the new Revolving Credit Facility under which we borrowed $400.0 million, with a right for us to borrow an additional $100.0 million, provided that there is no default under the agreement, and construction loan facilities that provide for aggregate borrowings of up to $123.8 million, $83.5 million of which was available at December 31, 2011 to fund future construction costs at specific projects.
The following table summarizes our contractual obligations as of December 31, 2011 (in thousands):
| |
For the Years Ending December 31, | |
||||||||||||||||||||
|---|---|---|---|---|---|---|---|---|---|---|---|---|---|---|---|---|---|---|---|---|---|---|
Contractual obligations(1)
|
2012 | 2013 | 2014 | 2015 | 2016 | Thereafter | Total | |||||||||||||||
Debt(2) |
||||||||||||||||||||||
Balloon payments due upon maturity |
$ | 52,952 | $ | 152,718 | $ | 813,681 | $ | 800,366 | $ | 274,605 | $ | 300,621 | $ | 2,394,943 | ||||||||
Scheduled principal payments |
13,111 | 10,285 | 7,099 | 5,738 | 4,037 | 3,258 | 43,528 | |||||||||||||||
Interest on debt(3) |
98,611 | 91,361 | 76,715 | 49,977 | 25,441 | 3,905 | 346,010 | |||||||||||||||
New construction and redevelopment obligations(4)(5) |
37,506 | — | — | — | — | — | 37,506 | |||||||||||||||
Third-party construction and development obligations(5)(6) |
44,999 | 5,000 | — | — | — | — | 49,999 | |||||||||||||||
Capital expenditures for operating properties(5)(7) |
26,527 | — | — | — | — | — | 26,527 | |||||||||||||||
Operating leases(8) |
1,128 | 1,071 | 986 | 866 | 810 | 70,478 | 75,339 | |||||||||||||||
Interest rate swaps(9) |
29,737 | — | — | — | — | — | 29,737 | |||||||||||||||
Other purchase obligations(10) |
4,305 | 3,846 | 2,700 | 1,755 | 1,232 | 327 | 14,165 | |||||||||||||||
Total contractual cash obligations |
$ | 308,876 | $ | 264,281 | $ | 901,181 | $ | 858,702 | $ | 306,125 | $ | 378,589 | $ | 3,017,754 | ||||||||
68
Activity
|
Number of Properties |
Square Feet (in thousands) |
Estimated Remaining Costs (in millions) |
Expected Year For Costs to be Incurred Through |
|||||||||
|---|---|---|---|---|---|---|---|---|---|---|---|---|---|
Construction of new office properties |
6 | 789 | $ | 69.9 | 2013 | ||||||||
Redevelopment of existing office properties |
1 | 113 | 9.6 | 2012 | |||||||||
We expect to spend more than $200 million on construction and development costs and approximately $80 million on improvements to operating properties (including the commitments set forth in the table above) in 2012. We expect to fund these costs and our 2012 debt maturities using primarily a combination of borrowings under our Revolving Credit Facility and existing construction loan facilities. We expect to close on a $175 to $200 million unsecured long-term borrowing in the first half of 2012 and use the proceeds primarily to pay down our Revolving Credit Facility. We also expect to sell more than $200 million of properties and use the proceeds primarily to pay down our Revolving Credit Facility and pay off debt secured by the properties.
Certain of our debt instruments require that we comply with a number of restrictive financial covenants, including maximum leverage ratio, unencumbered leverage ratio, minimum net worth, minimum fixed charge coverage, minimum unencumbered interest coverage ratio, minimum debt service and maximum secured indebtedness ratio. As of December 31, 2011, we were well within the compliance requirements of these financial covenants.
Off-Balance Sheet Arrangements
During 2011, we owned an investment in an unconsolidated real estate joint venture accounted for using the equity method of accounting. This real estate joint venture was entered into in 2005 to enable us to contribute office properties that were previously wholly owned by us into the joint venture in order to partially dispose of our interest in the properties. We manage the real estate joint venture's property operations and any required construction projects. This real estate joint venture has a two-member management committee that is responsible for making major decisions (as defined in the joint venture agreement) and we control one of the management committee positions.
We and our partner may receive returns in proportion to our investments in the joint venture. As part of our obligations under the joint venture arrangement, we entered into standard nonrecourse loan guarantees (environmental indemnifications and guarantees against fraud and misrepresentation, and springing guarantees of partnership debt in the event of a voluntary bankruptcy of the partnership).
69
The maximum amount we could be required to pay under the guarantees is approximately $65 million. We are entitled to recover 20% of any amounts paid under the guarantees from an affiliate of our partner pursuant to an indemnity agreement so long as we continue to manage the properties. In the event that we no longer manage the properties, the percentage that we are entitled to recover is increased to 80%. Management estimates that the aggregate fair value of the guarantees is not material and would not exceed the amounts included in distributions received in excess of investment in unconsolidated real estate joint venture reported on the consolidated balance sheets.
We have distributions in excess of our investment in this unconsolidated real estate joint venture of $6.1 million at December 31, 2011 due to our not recognizing gain on the contribution of properties into the joint venture; we did not recognize a gain on the contribution since we have the contingent obligations described above. We recognized equity in the losses of this joint venture of $495,000 in 2011.
We had no other material off-balance sheet arrangements during 2011.
Inflation
Most of our tenants are obligated to pay their share of a building's operating expenses to the extent such expenses exceed amounts established in their leases, based on historical expense levels. Some of our tenants are obligated to pay their full share of a building's operating expenses. These arrangements somewhat reduce our exposure to increases in such costs resulting from inflation.
Recent Accounting Pronouncements
In May 2011, the Financial Accounting Standards Board ("FASB") issued guidance to amend measurement and disclosure requirements related to fair value measurements to improve consistency with International Financial Reporting Standards. This guidance will be effective prospectively for interim and annual periods beginning after December 15, 2011. We are in the process of evaluating this guidance and currently do not believe that it will have a material effect on our consolidated financial statements.
In June 2011, the FASB issued guidance on the presentation of comprehensive income that will require us to present the total of comprehensive income, the components of net income and the components of other comprehensive income either in a single continuous statement of comprehensive income or in two separate but consecutive statements. This guidance eliminates the option to present the components of other comprehensive income as part of the statement of equity. This guidance requires retrospective application and is effective for fiscal years, and interim periods within those years, beginning after December 15, 2011.
In September 2011, the FASB issued guidance on the testing of goodwill for impairment that will permit us to first assess qualitative factors to determine whether it is more likely than not that the fair value of a reporting unit is less than its carrying amount as a basis for determining whether it is necessary to perform the two-step goodwill impairment test. This guidance eliminates the requirement to calculate the fair value of a reporting unit unless the entity determines that it is more likely than not that its fair value is less than its carrying amount. The guidance will be effective for annual and interim goodwill impairment tests performed for fiscal years beginning after December 15, 2011. We are in the process of evaluating this guidance and currently do not believe that it will have a material effect on our consolidated financial statements.
70
Item 7A. Quantitative and Qualitative Disclosures about Market Risk
We are exposed to certain market risks, the most predominant of which is change in interest rates. Increases in interest rates can result in increased interest expense under our Revolving Credit Facility and other variable rate debt. Increases in interest rates can also result in increased interest expense when our fixed rate debt matures and needs to be refinanced.
The following table sets forth as of December 31, 2011 our debt obligations and weighted average interest rates for fixed rate debt by expected maturity date (dollars in thousands):
| |
For the Years Ending December 31, | |
||||||||||||||||||||
|---|---|---|---|---|---|---|---|---|---|---|---|---|---|---|---|---|---|---|---|---|---|---|
| |
2012 | 2013 | 2014 | 2015 | 2016 | Thereafter | Total | |||||||||||||||
Long term debt:(1) |
||||||||||||||||||||||
Fixed rate(2) |
$ | 48,496 | $ | 144,345 | $ | 157,965 | $ | 363,595 | $ | 278,642 | $ | 303,879 | $ | 1,296,922 | ||||||||
Weighted average interest rate |
6.36 | % | 5.62 | % | 6.41 | % | 4.66 | % | 6.57 | % | 5.52 | % | 5.66 | % | ||||||||
Variable rate |
$ | 17,567 | $ | 18,658 | $ | 662,815 | $ | 442,509 | $ | — | $ | — | $ | 1,141,549 | ||||||||
The fair market value of our debt was $2.4 billion at December 31, 2011 and $2.3 billion at December 31, 2010. If interest rates had been 1% lower, the fair value of our fixed-rate debt would have increased by $77.5 million at December 31, 2011 and $65.8 million at December 31, 2010.
The following table sets forth information pertaining to our interest rate swap contracts in place as of December 31, 2011 and 2010 and their respective fair values (dollars in thousands):
| |
|
|
|
|
Fair Value at December 31, |
||||||||||||||
|---|---|---|---|---|---|---|---|---|---|---|---|---|---|---|---|---|---|---|---|
| Notional Amount |
Fixed Rate |
|
Effective Date |
Expiration Date |
|||||||||||||||
| Floating Rate Index | 2011 | 2010 | |||||||||||||||||
| $ | 50,000 | 0.5025 | % | One-Month LIBOR | 1/3/2011 | 1/3/2012 | $ | (1 | ) | $ | (64 | ) | |||||||
| 50,000 | 0.5025 | % | One-Month LIBOR | 1/3/2011 | 1/3/2012 | (1 | ) | (64 | ) | ||||||||||
| 50,000 | 0.4400 | % | One-Month LIBOR | 1/4/2011 | 1/3/2012 | — | (34 | ) | |||||||||||
| 120,000 | 1.7600 | % | One-Month LIBOR | 1/2/2009 | 5/1/2012 | (552 | ) | (2,062 | ) | ||||||||||
| 100,000 | 1.9750 | % | One-Month LIBOR | 1/1/2010 | 5/1/2012 | (532 | ) | (2,002 | ) | ||||||||||
| 100,000 | 0.6123 | % | One-Month LIBOR | 1/3/2012 | 9/1/2014 | 55 | N/A | ||||||||||||
| 100,000 | 0.6100 | % | One-Month LIBOR | 1/3/2012 | 9/1/2014 | 56 | N/A | ||||||||||||
| 100,000 | 0.8320 | % | One-Month LIBOR | 1/3/2012 | 9/1/2015 | (66 | ) | N/A | |||||||||||
| 100,000 | 0.8320 | % | One-Month LIBOR | 1/3/2012 | 9/1/2015 | (49 | ) | N/A | |||||||||||
| 40,000 | (1) | 3.8300 | % | One-Month LIBOR | 11/2/2010 | 11/2/2015 | (1,054 | ) | 644 | ||||||||||
| 100,000 | (2) | 3.8415 | % | Three-Month LIBOR | 9/30/2011 | 9/30/2021 | (16,333 | ) | N/A | ||||||||||
| 75,000 | (2) | 3.8450 | % | Three-Month LIBOR | 9/30/2011 | 9/30/2021 | (12,275 | ) | N/A | ||||||||||
| 100,000 | (2) | 2.0525 | % | Three-Month LIBOR-Reverse | 12/30/2011 | 9/30/2021 | 345 | N/A | |||||||||||
| 75,000 | (2) | 2.0525 | % | Three-Month LIBOR-Reverse | 12/30/2011 | 9/30/2021 | 260 | N/A | |||||||||||
| $ | (30,147 | ) | $ | (3,582 | ) | ||||||||||||||
71
Based on our variable-rate debt balances, including the effect of interest rate swap contracts, our interest expense would have increased by $3.8 million in 2011 and $2.5 million in 2010 if short-term interest rates were 1% higher.
Item 8. Financial Statements and Supplementary Data
This item is included in a separate section at the end of this report beginning on page F-1.
Item 9. Changes in and Disagreements with Accountants on Accounting and Financial Disclosure
None.
Item 9A. Controls and Procedures
Our management, with the participation of our Chief Executive Officer and Chief Financial Officer, evaluated the effectiveness of our disclosure controls and procedures (as defined in Rule 13a-15(e) under the Exchange Act) as of December 31, 2011. Based on this evaluation, our Chief Executive Officer and Chief Financial Officer concluded that our disclosure controls and procedures as of December 31, 2011 were functioning effectively to provide reasonable assurance that the information required to be disclosed by us in reports filed or submitted under the Securities Exchange Act of 1934, as amended, is (i) recorded, processed, summarized and reported within the time periods specified in the SEC's rules and forms, and (ii) accumulated and communicated to our management, including our principal executive and principal financial officers, or persons performing similar functions, as appropriate to allow timely decisions regarding required disclosure.
Management's Annual Report on Internal Control Over Financial Reporting is included in a separate section at the end of this report on page F-2.
The Report of Independent Registered Public Accounting Firm is included in a separate section at the end of this report on page F-3.
No change in our internal control over financial reporting occurred during the most recent fiscal quarter that has materially affected, or is reasonably likely to materially affect, our internal control over financial reporting.
None.
Items 10, 11, 12, 13 & 14. Directors, Executive Officers and Corporate Governance; Executive Compensation; Security Ownership of Certain Beneficial Owners and Management and Related Stockholder Matters; Certain Relationships and Related Transactions, and Director Independence; and Principal Accountant Fees and Services
For the information required by Item 10, Item 11, Item 12, Item 13 and Item 14, you should refer to our definitive proxy statement relating to the 2012 Annual Meeting of our Shareholders to be filed with the Securities and Exchange Commission no later than 120 days after the end of the fiscal year covered by this Annual Report on Form 10-K.
72
Item 15. Exhibits and Financial Statement Schedules
| EXHIBIT NO. |
DESCRIPTION | ||
|---|---|---|---|
| 3.1.1 | Amended and Restated Declaration of Trust of Registrant (filed with the Registrant's Registration Statement on Form S-4 (Commission File No. 333-45649) and incorporated herein by reference). | ||
3.1.2 |
Articles of Amendment of Amended and Restated Declaration of Trust (filed on March 22, 2002 with the Company's Annual Report on Form 10-K for the year ended December 31, 2001 and incorporated herein by reference). |
||
3.1.3 |
Articles of Amendment of Amended and Restated Declaration of Trust (filed with the Company's Current Report on Form 8-K on December 29, 2004 and incorporated herein by reference). |
||
3.1.4 |
Articles Supplementary of Corporate Office Properties Trust Series B Cumulative Redeemable Preferred Shares, dated July 2, 1999 (filed with the Company's Current Report on Form 8-K on July 7, 1999 and incorporated herein by reference). |
||
3.1.5 |
Articles Supplementary of Corporate Office Properties Trust relating to the Series B Cumulative Redeemable Preferred Shares (filed with the Company's Current Report on Form 8-K on December 29, 2004 and incorporated herein by reference). |
||
3.1.6 |
Articles Supplementary of Corporate Office Properties Trust relating to the Series D Convertible Preferred Shares (filed with the Company's Current Report on Form 8-K on December 29, 2004 and incorporated herein by reference). |
||
3.1.7 |
Articles Supplementary of Corporate Office Properties Trust relating to the Series E Cumulative Redeemable Preferred Shares, dated April 3, 2001 (filed with the Registrant's Current Report on Form 8-K on April 4, 2001 and incorporated herein by reference). |
||
3.1.8 |
Articles Supplementary of Corporate Office Properties Trust relating to the Series F Cumulative Redeemable Preferred Shares, dated September 13, 2001 (filed with the Registrant's Amended Current Report on Form 8-K on September 14, 2001 and incorporated herein by reference). |
||
3.1.9 |
Articles Supplementary of Corporate Office Properties Trust relating to the Series G Cumulative Redeemable Preferred Shares, dated August 6, 2003 (filed with the Registrant's Registration Statement on Form 8-A on August 7, 2003 and incorporated herein by reference). |
||
73
| EXHIBIT NO. |
DESCRIPTION | ||
|---|---|---|---|
| 3.1.10 | Articles Supplementary of Corporate Office Properties Trust relating to the Series H Cumulative Redeemable Preferred Shares, dated December 11, 2003 (filed with the Current Report on Form 8-K on December 12, 2003 and incorporated herein by reference). | ||
3.1.11 |
Articles Supplementary of Corporate Office Properties Trust relating to the Series J Cumulative Redeemable Preferred Shares of Beneficial Interest (filed with the Company's Current Report on Form 8-K dated July 19, 2006 and incorporated herein by reference). |
||
3.1.12 |
Articles Supplementary of Corporate Office Properties Trust relating to the Series K Cumulative Redeemable Convertible Preferred Shares of Beneficial Interest (filed with the Company's Current Report on Form 8-K dated January 16, 2007 and incorporated herein by reference). |
||
3.1.13 |
Articles of Amendment of Amended and Restated Declaration of Trust (filed with the Company's Current Report on Form 8-K dated May 28, 2008 and incorporated herein by reference). |
||
3.1.14 |
Articles of Amendment of Amended and Restated Declaration of Trust (filed with the Company's Current Report on Form 8-K dated May 19, 2010 and incorporated herein by reference). |
||
3.2 |
Bylaws of the Registrant, as amended and restated on December 3, 2009 (filed with the Company's Current Report on Form 8-K dated December 9, 2009 and incorporated herein by reference). |
||
3.3 |
Form of certificate for the Registrant's Common Shares of Beneficial Interest, $0.01 par value per share (filed with the Registrant's Registration Statement on Form S-4 (Commission File No. 333-45649) and incorporated herein by reference). |
||
4.1 |
Indenture, dated as of April 7, 2010, among Corporate Office Properties, L.P., as issuer, Corporate Office Properties Trust, as guarantor, and Wells Fargo Bank, National Association, as trustee (filed with the Company's Current Report on Form 8-K dated April 16, 2010 and incorporated herein by reference). |
||
4.2 |
4.25% Exchangeable Senior Note due 2030 of Corporate Office Properties, L.P. (filed with the Company's Current Report on Form 8-K dated April 16, 2010 and incorporated herein by reference). |
||
10.1.1 |
Second Amended and Restated Limited Partnership Agreement of the Operating Partnership, dated December 7, 1999 (filed on March 16, 2000 with the Company's Annual Report on Form 10-K for the year ended December 31, 1999 and incorporated herein by reference). |
||
10.1.2 |
First Amendment to Second Amended and Restated Limited Partnership Agreement of the Operating Partnership, dated December 21, 1999 (filed on March 16, 2000 with the Company's Annual Report on Form 10-K for the year ended December 31, 1999 and incorporated herein by reference). |
||
10.1.3 |
Second Amendment to Second Amended and Restated Limited Partnership Agreement of the Operating Partnership, dated December 21, 1999 (filed with the Company's Post Effective Amendment No. 2 to Form S-3 dated November 1, 2000 (Registration Statement No. 333-71807) and incorporated herein by reference). |
||
74
| EXHIBIT NO. |
DESCRIPTION | ||
|---|---|---|---|
| 10.1.4 | Third Amendment to Second Amended and Restated Limited Partnership Agreement of the Operating Partnership, dated September 29, 2000 (filed with the Company's Post Effective Amendment No. 2 to Form S-3 dated November 1, 2000 (Registration Statement No. 333-71807) and incorporated herein by reference). | ||
10.1.5 |
Fourth Amendment to Second Amended and Restated Limited Partnership Agreement of the Operating Partnership, dated November 27, 2000 (filed on March 27, 2003 with the Company's Annual Report on Form 10-K for the year ended December 31, 2002 and incorporated herein by reference). |
||
10.1.6 |
Fifth Amendment to Second Amended and Restated Limited Partnership Agreement of the Operating Partnership, dated January 25, 2001 (filed on March 27, 2003 with the Company's Annual Report on Form 10-K for the year ended December 31, 2002 and incorporated herein by reference). |
||
10.1.7 |
Sixth Amendment to Second Amended and Restated Limited Partnership Agreement of the Operating Partnership, dated April 3, 2001 (filed with the Company's Current Report on Form 8-K dated April 4, 2001 and incorporated herein by reference). |
||
10.1.8 |
Seventh Amendment to Second Amended and Restated Limited Partnership Agreement of the Operating Partnership, dated August 30, 2001 (filed on March 27, 2003 with the Company's Annual Report on Form 10-K for the year ended December 31, 2002 and incorporated herein by reference). |
||
10.1.9 |
Eighth Amendment to Second Amended and Restated Limited Partnership Agreement of the Operating Partnership, dated September 14, 2001 (filed with the Company's Amended Current Report on Form 8-K dated September 14, 2001 and incorporated herein by reference). |
||
10.1.10 |
Ninth Amendment to Second Amended and Restated Limited Partnership Agreement of the Operating Partnership, dated October 16, 2001 (filed on March 27, 2003 with the Company's Annual Report on Form 10-K for the year ended December 31, 2002 and incorporated herein by reference). |
||
10.1.11 |
Tenth Amendment to Second Amended and Restated Limited Partnership Agreement of the Operating Partnership, dated December 29, 2001 (filed on March 27, 2003 with the Company's Annual Report on Form 10-K for the year ended December 31, 2002 and incorporated herein by reference). |
||
10.1.12 |
Eleventh Amendment to Second Amended and Restated Limited Partnership Agreement of the Operating Partnership, dated December 15, 2002 (filed on March 27, 2003 with the Company's Annual Report on Form 10-K for the year ended December 31, 2002 and incorporated herein by reference). |
||
10.1.13 |
Twelfth Amendment to Second Amended and Restated Limited Partnership Agreement of Corporate Office Properties, L.P., dated June 2, 2003 (filed on August 12, 2003 with the Registrant's Quarterly Report on Form 10-Q for the quarter ended June 30, 2003 and incorporated herein by reference). |
||
10.1.14 |
Thirteenth Amendment to Second Amended and Restated Limited Partnership Agreement of Corporate Office Properties, L.P., dated August 11, 2003 (filed on March 27, 2003 with the Company's Annual Report on Form 10-K for the year ended December 31, 2002 and incorporated herein by reference). |
||
75
| EXHIBIT NO. |
DESCRIPTION | ||
|---|---|---|---|
| 10.1.15 | Fourteenth Amendment to Second Amended and Restated Limited Partnership Agreement of Corporate Office Properties, L.P., dated December 18, 2003 (filed on March 11, 2004 with the Company's Annual Report on Form 10-K for the year ended December 31, 2003 and incorporated herein by reference). | ||
10.1.16 |
Fifteenth Amendment to Second Amended and Restated Limited Partnership Agreement of Corporate Office Properties, L.P., dated January 31, 2004 (filed on March 11, 2004 with the Company's Annual Report on Form 10-K for the year ended December 31, 2003 and incorporated herein by reference). |
||
10.1.17 |
Sixteenth Amendment to Second Amended and Restated Limited Partnership Agreement of Corporate Office Properties, L.P., dated April 15, 2004 (filed on May 7, 2004 with the Company's Form 10-Q for the quarter ended March 31, 2004 and incorporated herein by reference). |
||
10.1.18 |
Seventeenth Amendment to Second Amended and Restated Limited Partnership Agreement of Corporate Office Properties, L.P., dated September 23, 2004 (filed with the Company's Current Report on Form 8-K dated September 23, 2004 and incorporated herein by reference). |
||
10.1.19 |
Eighteenth Amendment to Second Amended and Restated Limited Partnership Agreement of Corporate Office Properties, L.P., dated April 18, 2005 (filed with the Company's Form 8-K on April 22, 2005 and incorporated herein by reference). |
||
10.1.20 |
Nineteenth Amendment to Second Amended and Restated Limited Partnership Agreement of Corporate Office Properties, L.P., dated July 8, 2005 (filed with the Company's Current Report on Form 8-K on July 14, 2005 and incorporated herein by reference). |
||
10.1.21 |
Twentieth Amendment to Second Amended and Restated Limited Partnership Agreement of Corporate Office Properties, L.P., dated June 29, 2006 (filed with the Company's Current Report on Form 8-K dated July 6, 2006 and incorporated herein by reference). |
||
10.1.22 |
Twenty-First Amendment to Second Amended and Restated Limited Partnership Agreement of Corporate Office Properties, L.P., dated July 20, 2006 (filed with the Company's Current Report on Form 8-K dated July 26, 2006 and incorporated herein by reference). |
||
10.1.23 |
Twenty-Second Amendment to Second Amended and Restated Limited Partnership Agreement of Corporate Office Properties, L.P., dated January 9, 2007 (filed with the Company's Current Report on Form 8-K dated January 16, 2007 and incorporated herein by reference). |
||
10.1.24 |
Twenty-Third Amendment to Second Amended and Restated Limited Partnership Agreement of Corporate Office Properties, L.P., dated April 6, 2007 (filed with the Company's Current Report on Form 8-K dated April 12, 2007 and incorporated herein by reference). |
||
10.1.25 |
Twenty-Fourth Amendment to Second Amended and Restated Limited Partnership Agreement of Corporate Office Properties, L.P., dated November 2, 2007 (filed with the Company's Current Report on Form 8-K dated November 5, 2007 and incorporated herein by reference). |
||
10.1.26 |
Twenty-Fifth Amendment to Second Amended and Restated Limited Partnership Agreement of Corporate Office Properties, L.P., dated December 31, 2008 (filed with the Company's Current Report on Form 8-K dated January 5, 2009 and incorporated herein by reference). |
||
76
| EXHIBIT NO. |
DESCRIPTION | ||
|---|---|---|---|
| 10.1.27 | Twenty-Sixth Amendment to Second Amended and Restated Limited Partnership Agreement of Corporate Office Properties, L.P., dated March 4, 2010 (filed with the Company's Current Report on Form 8-K dated March 10, 2010 and incorporated herein by reference). | ||
10.1.28 |
Twenty-Seventh Amendment to Second Amended and Restated Limited Partnership Agreement of Corporate Office Properties, L.P., dated February 3, 2011 (filed with the Company's Current Report on Form 8-K dated February 3, 2011 and incorporated herein by reference). |
||
10.1.29 |
Twenty-Eighth Amendment to Second Amended and Restated Limited Partnership Agreement of Corporate Office Properties, L.P., dated September 15, 2011 (filed with the Company's Current Report on Form 8-K dated September 16, 2011 and incorporated herein by reference). |
||
10.2.1 |
* |
Corporate Office Properties Trust 1998 Long Term Incentive Plan (filed with the Registrant's Registration Statement on Form S-4 (Commission File No. 333-45649) and incorporated herein by reference). |
|
10.2.2 |
* |
Amendment No. 1 to Corporate Office Properties Trust 1998 Long Term Incentive Plan (filed on August 13, 1999 with the Company's Quarterly Report on Form 10-Q for the quarter ended June 30, 1999 and incorporated herein by reference). |
|
10.2.3 |
* |
Amendment No. 2 to Corporate Office Properties Trust 1998 Long Term Incentive Plan (filed on March 22, 2002 with the Company's Annual Report on Form 10-K for the year ended December 31, 2001 and incorporated herein by reference). |
|
10.3 |
* |
Corporate Office Properties Trust Supplemental Nonqualified Deferred Compensation Plan (filed with the Registrant's Registration Statement on Form S-8 (Commission File No. 333-87384) and incorporated herein by reference). |
|
10.4.1 |
* |
Employment Agreement, dated July 13, 2005, between Corporate Office Properties, L.P. Corporate Office Properties Trust and Randall M. Griffin (filed with the Company's Current Report on Form 8-K dated July 19, 2005 and incorporated herein by reference). |
|
10.4.2 |
* |
Amendment to Employment Agreement, dated May 30, 2006, between Corporate Office Properties, L.P., Corporate Office Properties Trust and Randall M. Griffin (filed with the Company's Current Report on Form 8-K dated June 1, 2006 and incorporated herein by reference). |
|
10.4.3 |
* |
Second Amendment to Employment Agreement, dated December 31, 2008, between Corporate Office Properties, L.P., Corporate Office Properties Trust and Randall M. Griffin (filed with the Company's Current Report on Form 8-K dated January 5, 2009 and incorporated herein by reference). |
|
10.4.4 |
* |
Third Amendment to Employment Agreement, dated September 16, 2010, between Corporate Office Properties, L.P., Corporate Office Properties Trust and Randall M. Griffin (filed on October 29, 2010 with the Company's Quarterly Report on Form 10-Q for the quarter ended September 30, 2010 and incorporated herein by reference). |
|
10.5.1 |
* |
Employment Agreement, dated September 12, 2002, between the Operating Partnership, COPT and Roger A. Waesche, Jr. (filed on March 27, 2003 with the Company's Annual Report on Form 10-K for the year ended December 31, 2002 and incorporated herein by reference). |
|
77
| EXHIBIT NO. |
DESCRIPTION | ||
|---|---|---|---|
| 10.5.2 | * | Amendment to Employment Agreement, dated March 4, 2005, between the Operating Partnership, COPT and Roger A. Waesche, Jr. (filed on March 16, 2005 with the Company's Annual Report on Form 10-K for the year ended December 31, 2004 and incorporated herein by reference). | |
10.5.3 |
* |
Second Amendment to Employment Agreement, dated May 30, 2006, between Corporate Office Properties, L.P., Corporate Office Properties Trust, and Roger A. Waesche, Jr. (filed with the Company's Current Report on Form 8-K dated June 1, 2006 and incorporated herein by reference). |
|
10.5.4 |
* |
Third Amendment to Employment Agreement, dated July 31, 2006, between Corporate Office Properties, L.P., Corporate Office Properties Trust, and Roger A. Waesche, Jr. (filed with the Company's Current Report on Form 8-K dated August 1, 2006 and incorporated herein by reference). |
|
10.5.5 |
* |
Fourth Amendment to Employment Agreement, dated March 2, 2007, between Corporate Office Properties, L.P., Corporate Office Properties Trust, and Roger A. Waesche, Jr. (filed with the Company's Annual Report on Form 10-K dated February 29, 2008 and incorporated herein by reference). |
|
10.5.6 |
* |
Fifth Amendment to Employment Agreement, dated September 16, 2010, between Corporate Office Properties, L.P., Corporate Office Properties Trust, and Roger A. Waesche, Jr. (filed on October 29, 2010 with the Company's Quarterly Report on Form 10-Q for the quarter ended September 30, 2010 and incorporated herein by reference). |
|
10.6.1 |
* |
Employment Agreement, dated July 31, 2006, between Corporate Office Properties, L.P., Corporate Office Properties Trust and Stephen E. Riffee (filed with the Company's Current Report on Form 8-K dated August 1, 2006 and incorporated herein by reference). |
|
10.6.2 |
* |
First Amendment to Employment Agreement, dated December 31, 2008, between Corporate Office Properties, L.P., Corporate Office Properties Trust and Stephen E. Riffee (filed with the Company's Current Report on Form 8-K dated January 5, 2009 and incorporated herein by reference). |
|
10.6.3 |
* |
Second Amendment to Employment Agreement, dated September 16, 2010, between Corporate Office Properties, L.P., Corporate Office Properties Trust and Stephen E. Riffee (filed on October 29, 2010 with the Company's Quarterly Report on Form 10-Q for the quarter ended September 30, 2010 and incorporated herein by reference). |
|
10.7.1 |
* |
Employment Agreement, dated December 31, 2008, between Corporate Development Services, LLC, Corporate Office Properties Trust and Wayne Lingafelter (filed with the Company's Annual Report on Form 8-K dated January 5, 2009 and incorporated herein by reference). |
|
10.7.2 |
* |
First Amendment to Employment Agreement, dated September 16, 2010, between Corporate Development Services, LLC, Corporate Office Properties Trust and Wayne Lingafelter (filed on October 29, 2010 with the Company's Quarterly Report on Form 10-Q for the quarter ended September 30, 2010 and incorporated herein by reference). |
|
10.8.1 |
* |
Employment Agreement, dated September 15, 2011, between Corporate Office Properties, L.P., Corporate Office Properties Trust and Stephen E. Budorick (filed with the Company's Current Report on Form 8-K dated September 16, 2011 and incorporated herein by reference). |
|
78
| EXHIBIT NO. |
DESCRIPTION | ||
|---|---|---|---|
| 10.9 | Amended and Restated Registration Rights Agreement, dated March 16, 1998, for the benefit of certain shareholders of the Company (filed on August 12, 1998 with the Company's Quarterly Report on Form 10-Q for the quarter ended June 30, 1998 and incorporated herein by reference). | ||
10.10 |
Registration Rights Agreement, dated January 25, 2001, for the benefit of Barony Trust Limited (filed on March 22, 2001 with the Company's Annual Report on Form 10-K for the year ended December 31, 2000 and incorporated herein by reference). |
||
10.11.1 |
* |
Corporate Office Properties Trust Supplemental Nonqualified Deferred Compensation Plan (filed with the Company's Current Report on Form 8-K dated December 10, 2008 and incorporated herein by reference). |
|
10.11.2 |
* |
First Amendment to the Corporate Office Properties Trust Supplemental Nonqualified Deferred Compensation Plan dated December 4, 2008 (filed with the Company's Current Report on Form 8-K dated December 10, 2008 and incorporated herein by reference). |
|
10.12.1 |
* |
Corporate Office Properties Trust 2008 Omnibus Equity and Incentive Plan (included in Appendix A to the Company's Definitive Proxy Statement on Schedule 14A filed with the Securities and Exchange Commission on April 9, 2008 and incorporated herein by reference). |
|
10.12.2 |
* |
Corporate Office Properties Trust Amended and Restated 2008 Omnibus Equity and Incentive Plan (included in Annex A to the Company's Definitive Proxy Statement on Schedule 14A filed with the Securities and Exchange Commission on March 30, 2010 and incorporated herein by reference). |
|
10.13 |
Registration Rights Agreement, dated April 7, 2010, among Corporate Office Properties, L.P., Corporate Office Properties Trust, J.P. Morgan Securities Inc. and RBC Capital Markets Corporation (filed with the Company's Current Report on Form 8-K dated April 16, 2010 and incorporated herein by reference). |
||
10.14 |
Common Stock Delivery Agreement, dated April 7, 2010, among Corporate Office Properties, L.P. and Corporate Office Properties Trust (filed with the Company's Current Report on Form 8-K dated April 16, 2010 and incorporated herein by reference). |
||
10.15 |
Credit Agreement, dated as of September 1, 2011, by and among Corporate Office Properties, L.P.; Corporate Office Properties Trust; J.P. Morgan Securities LLC; KeyBanc Capital Markets; KeyBank National Association; JPMorgan Chase Bank, N.A.; Bank of America, N.A.; Royal Bank of Canada; Wells Fargo Bank, National Association; Barclays Bank PLC; PNC Bank, National Association; Regions Bank; Manufacturers and Traders Trust Company; and SunTrust Bank (filed with the Company's Current Report on Form 8-K/A dated September 1, 2011 and incorporated herein by reference). |
||
10.16 |
Term Loan Agreement, dated as of September 1, 2011, by and among Corporate Office Properties, L.P.; Corporate Office Properties Trust; J.P. Morgan Securities LLC; KeyBanc Capital Markets; KeyBank National Association; JPMorgan Chase Bank, N.A.; Bank of America, N.A.; Royal Bank of Canada; Barclays Bank PLC; PNC Bank, National Association; Wells Fargo Bank, National Association; Regions Bank; Manufacturers and Traders Trust Company; and SunTrust Bank (filed with the Company's Current Report on Form 8-K/A dated September 1, 2011 and incorporated herein by reference). |
||
12.1 |
Statement regarding Computation of Earnings to Combined Fixed Charges and Preferred Share Dividends (filed herewith). |
||
21.1 |
Subsidiaries of Registrant (filed herewith). |
||
79
| EXHIBIT NO. |
DESCRIPTION | ||
|---|---|---|---|
| 23.1 | Consent of Independent Registered Public Accounting Firm (filed herewith). | ||
31.1 |
Certification of the Chief Executive Officer of Corporate Office Properties Trust required by Rule 13a-14(a) under the Securities Exchange Act of 1934, as amended (filed herewith). |
||
31.2 |
Certification of the Chief Financial Officer of Corporate Office Properties Trust required by Rule 13a-14(a) under the Securities Exchange Act of 1934, as amended (filed herewith). |
||
32.1 |
Certification of the Chief Executive Officer of Corporate Office Properties Trust required by Rule 13a-14(b) under the Securities Exchange Act of 1934, as amended. (This exhibit shall not be deemed "filed" for purposes of Section 18 of the Securities Exchange Act of 1934, as amended, or otherwise subject to the liability of that section. Further, this exhibit shall not be deemed to be incorporated by reference into any filing under the Securities Act of 1933, as amended, or the Securities Exchange Act of 1934, as amended.) (Furnished herewith.) |
||
32.2 |
Certification of the Chief Financial Officer of Corporate Office Properties Trust required by Rule 13a-14(b) under the Securities Exchange Act of 1934, as amended. (This exhibit shall not be deemed "filed" for purposes of Section 18 of the Securities Exchange Act of 1934, as amended, or otherwise subject to the liability of that section. Further, this exhibit shall not be deemed to be incorporated by reference into any filing under the Securities Act of 1933, as amended, or the Securities Exchange Act of 1934, as amended.) (Furnished herewith.) |
||
101.INS |
XBRL Instance Document (furnished herewith). |
||
101.SCH |
XBRL Taxonomy Extension Schema Document (furnished herewith). |
||
101.CAL |
XBRL Taxonomy Extension Calculation Linkbase Document (furnished herewith). |
||
101.LAB |
XBRL Extension Labels Linkbase (furnished herewith). |
||
101.PRE |
XBRL Taxonomy Extension Presentation Linkbase Document (furnished herewith). |
||
101.DEF |
XBRL Taxonomy Extension Definition Linkbase Document (furnished herewith). |
||
80
Pursuant to the requirements of Section 13 or 15(d) of the Securities Exchange Act of 1934, the Registrant has duly caused this report to be signed on its behalf by the undersigned, thereunto duly authorized.
| CORPORATE OFFICE PROPERTIES TRUST | ||||
Date: February 10, 2012 |
By: |
/s/ RANDALL M. GRIFFIN Randall M. Griffin Chief Executive Officer |
||
Date: February 10, 2012 |
By: |
/s/ STEPHEN E. RIFFEE Stephen E. Riffee Executive Vice President and Chief Financial Officer |
||
81
Pursuant to the requirements of the Securities Exchange Act of 1934, this report has been signed below by the following persons on behalf of the Registrant and in the capacities and on the dates indicated:
Signatures
|
Title
|
Date
|
||
|---|---|---|---|---|
| /s/ JAY H. SHIDLER (Jay H. Shidler) |
Chairman of the Board and Trustee | February 10, 2012 | ||
/s/ CLAY W. HAMLIN, III (Clay W. Hamlin, III) |
Vice Chairman of the Board and Trustee |
February 10, 2012 |
||
/s/ RANDALL M. GRIFFIN (Randall M. Griffin) |
Chief Executive Officer and Trustee |
February 10, 2012 |
||
/s/ STEPHEN E. RIFFEE (Stephen E. Riffee) |
Executive Vice President and Chief Financial Officer (Principal Financial Officer) |
February 10, 2012 |
||
/s/ GREGORY J. THOR (Gregory J. Thor) |
Senior Vice President and Controller (Principal Accounting Officer) |
February 10, 2012 |
||
/s/ THOMAS F. BRADY (Thomas F. Brady) |
Trustee |
February 10, 2012 |
||
/s/ ROBERT L. DENTON (Robert L. Denton) |
Trustee |
February 10, 2012 |
||
/s/ ELIZABETH A. HIGHT (Elizabeth A. Hight) |
Trustee |
February 10, 2012 |
||
/s/ DAVID M. JACOBSTEIN (David M. Jacobstein) |
Trustee |
February 10, 2012 |
||
/s/ STEVEN D. KESLER (Steven D. Kesler) |
Trustee |
February 10, 2012 |
||
/s/ RICHARD SZAFRANSKI (Richard Szafranski) |
Trustee |
February 10, 2012 |
||
/s/ KENNETH D. WETHE (Kenneth D. Wethe) |
Trustee |
February 10, 2012 |
82
CORPORATE OFFICE PROPERTIES TRUST AND SUBSIDIARIES
INDEX TO FINANCIAL STATEMENTS
F-1
Management's Report On Internal Control Over Financial Reporting
Management is responsible for establishing and maintaining adequate internal control over financial reporting, and for performing an assessment of the effectiveness of internal control over financial reporting as of December 31, 2011. Internal control over financial reporting is a process designed to provide reasonable assurance regarding the reliability of financial reporting and the preparation of financial statements for external purposes in accordance with generally accepted accounting principles. Our internal control over financial reporting includes those policies and procedures that (i) pertain to the maintenance of records that, in reasonable detail, accurately and fairly reflect the transactions and dispositions of our assets; (ii) provide reasonable assurance that transactions are recorded as necessary to permit preparation of financial statements in accordance with generally accepted accounting principles, and that our receipts and expenditures are being made only in accordance with authorizations of our management and trustees; and (iii) provide reasonable assurance regarding prevention or timely detection of unauthorized acquisition, use or disposition of our assets that could have a material effect on the financial statements. Because of its inherent limitations, internal control over financial reporting may not prevent or detect misstatements. Also, projections of any evaluation of effectiveness to future periods are subject to the risk that controls may become inadequate because of changes in conditions, or that the degree of compliance with the policies or procedures may deteriorate.
Management performed an assessment of the effectiveness of our internal control over financial reporting as of December 31, 2011 based upon criteria in Internal Control—Integrated Framework issued by the Committee of Sponsoring Organizations of the Treadway Commission ("COSO"). Based on our assessment, management determined that our internal control over financial reporting was effective as of December 31, 2011 based on the criteria in Internal Control—Integrated Framework issued by the COSO.
The effectiveness of the Company's internal control over financial reporting as of December 31, 2011 has been audited by PricewaterhouseCoopers LLP, an independent registered public accounting firm, as stated in their report which appears herein.
F-2
Report of Independent Registered Public Accounting Firm
To the Board of Trustees and Shareholders of Corporate Office Properties Trust:
In our opinion, the consolidated financial statements listed in the index appearing under Item 15(a)(1) present fairly, in all material respects, the financial position of Corporate Office Properties Trust and its subsidiaries at December 31, 2011 and December 31, 2010, and the results of their operations and their cash flows for each of the three years in the period ended December 31, 2011 in conformity with accounting principles generally accepted in the United States of America. In addition, in our opinion, the financial statement schedule listed in the index appearing under Item 15(a)(2) presents fairly, in all material respects, the information set forth therein when read in conjunction with the related consolidated financial statements. Also in our opinion, the Company maintained, in all material respects, effective internal control over financial reporting as of December 31, 2011, based on criteria established in Internal Control—Integrated Framework issued by the Committee of Sponsoring Organizations of the Treadway Commission (COSO). The Company's management is responsible for these financial statements and financial statement schedule, for maintaining effective internal control over financial reporting and for its assessment of the effectiveness of internal control over financial reporting, included in the accompanying "Management's Report on Internal Control over Financial Reporting". Our responsibility is to express opinions on these financial statements, on the financial statement schedule, and on the Company's internal control over financial reporting based on our integrated audits. We conducted our audits in accordance with the standards of the Public Company Accounting Oversight Board (United States). Those standards require that we plan and perform the audits to obtain reasonable assurance about whether the financial statements are free of material misstatement and whether effective internal control over financial reporting was maintained in all material respects. Our audits of the financial statements included examining, on a test basis, evidence supporting the amounts and disclosures in the financial statements, assessing the accounting principles used and significant estimates made by management, and evaluating the overall financial statement presentation. Our audit of internal control over financial reporting included obtaining an understanding of internal control over financial reporting, assessing the risk that a material weakness exists, and testing and evaluating the design and operating effectiveness of internal control based on the assessed risk. Our audits also included performing such other procedures as we considered necessary in the circumstances. We believe that our audits provide a reasonable basis for our opinions.
A company's internal control over financial reporting is a process designed to provide reasonable assurance regarding the reliability of financial reporting and the preparation of financial statements for external purposes in accordance with generally accepted accounting principles. A company's internal control over financial reporting includes those policies and procedures that (i) pertain to the maintenance of records that, in reasonable detail, accurately and fairly reflect the transactions and dispositions of the assets of the company; (ii) provide reasonable assurance that transactions are recorded as necessary to permit preparation of financial statements in accordance with generally accepted accounting principles, and that receipts and expenditures of the company are being made only in accordance with authorizations of management and directors of the company; and (iii) provide reasonable assurance regarding prevention or timely detection of unauthorized acquisition, use, or disposition of the company's assets that could have a material effect on the financial statements.
Because of its inherent limitations, internal control over financial reporting may not prevent or detect misstatements. Also, projections of any evaluation of effectiveness to future periods are subject to the risk that controls may become inadequate because of changes in conditions, or that the degree of compliance with the policies or procedures may deteriorate.
/s/ PricewaterhouseCoopers LLP
Baltimore,
MD
February 10, 2012
F-3
Corporate Office Properties Trust and Subsidiaries
Consolidated Balance Sheets
(Dollars in thousands)
| |
December 31, | ||||||
|---|---|---|---|---|---|---|---|
| |
2011 | 2010 | |||||
Assets |
|||||||
Properties, net: |
|||||||
Operating properties, net |
$ | 2,714,056 | $ | 2,802,773 | |||
Projects in development or held for future development |
638,919 | 642,682 | |||||
Total properties, net |
3,352,975 | 3,445,455 | |||||
Assets held for sale, net |
116,616 | — | |||||
Cash and cash equivalents |
5,559 | 10,102 | |||||
Restricted cash and marketable securities |
36,232 | 22,582 | |||||
Accounts receivable (net of allowance for doubtful accounts of $3,546 and $2,796, respectively) |
26,032 | 18,938 | |||||
Deferred rent receivable |
86,856 | 79,160 | |||||
Intangible assets on real estate acquisitions, net |
89,120 | 113,735 | |||||
Deferred leasing and financing costs, net |
66,515 | 60,649 | |||||
Prepaid expenses and other assets |
87,619 | 93,896 | |||||
Total assets |
$ | 3,867,524 | $ | 3,844,517 | |||
Liabilities and equity |
|||||||
Liabilities: |
|||||||
Debt, net |
$ | 2,426,303 | $ | 2,323,681 | |||
Accounts payable and accrued expenses |
96,425 | 99,699 | |||||
Rents received in advance and security deposits |
29,548 | 31,603 | |||||
Dividends and distributions payable |
35,038 | 32,986 | |||||
Deferred revenue associated with operating leases |
15,554 | 14,802 | |||||
Distributions received in excess of investment in unconsolidated real estate joint venture |
6,071 | 5,545 | |||||
Interest rate derivatives |
30,863 | 4,226 | |||||
Other liabilities |
9,657 | 8,837 | |||||
Total liabilities |
2,649,459 | 2,521,379 | |||||
Commitments and contingencies (Note 21) |
— | — | |||||
Equity: |
|||||||
Corporate Office Properties Trust's shareholders' equity: |
|||||||
Preferred Shares of beneficial interest with an aggregate liquidation preference of $216,333 at December 31, 2011 and 2010 (Note 12) |
81 | 81 | |||||
Common Shares of beneficial interest ($0.01 par value; 125,000,000 shares authorized, shares issued and outstanding of 72,011,324 at December 31, 2011 and 66,931,582 at December 31, 2010) |
720 | 669 | |||||
Additional paid-in capital |
1,668,645 | 1,511,844 | |||||
Cumulative distributions in excess of net income |
(532,288 | ) | (281,794 | ) | |||
Accumulated other comprehensive loss |
(1,733 | ) | (4,163 | ) | |||
Total Corporate Office Properties Trust's shareholders' equity |
1,135,425 | 1,226,637 | |||||
Noncontrolling interests in subsidiaries: |
|||||||
Common units in the Operating Partnership |
55,281 | 69,337 | |||||
Preferred units in the Operating Partnership |
8,800 | 8,800 | |||||
Other consolidated entities |
18,559 | 18,364 | |||||
Noncontrolling interests in subsidiaries |
82,640 | 96,501 | |||||
Total equity |
1,218,065 | 1,323,138 | |||||
Total liabilities and equity |
$ | 3,867,524 | $ | 3,844,517 | |||
See accompanying notes to consolidated financial statements.
F-4
Corporate Office Properties Trust and Subsidiaries
Consolidated Statements of Operations
(Dollars in thousands, except per share data)
| |
For the Years Ended December 31, |
|||||||||
|---|---|---|---|---|---|---|---|---|---|---|
| |
2011 | 2010 | 2009 | |||||||
Revenues |
||||||||||
Rental revenue |
$ | 384,774 | $ | 353,229 | $ | 328,409 | ||||
Tenant recoveries and other real estate operations revenue |
87,722 | 79,694 | 66,132 | |||||||
Construction contract and other service revenues |
84,345 | 104,675 | 343,087 | |||||||
Total revenues |
556,841 | 537,598 | 737,628 | |||||||
Expenses |
||||||||||
Property operating expenses |
186,833 | 169,325 | 145,973 | |||||||
Depreciation and amortization associated with real estate operations |
127,444 | 113,234 | 97,869 | |||||||
Construction contract and other service expenses |
81,639 | 102,302 | 336,519 | |||||||
Impairment losses |
127,765 | — | — | |||||||
General and administrative expenses |
25,843 | 24,008 | 23,240 | |||||||
Business development expenses |
3,195 | 4,197 | 3,699 | |||||||
Total operating expenses |
552,719 | 413,066 | 607,300 | |||||||
Operating income |
4,122 | 124,532 | 130,328 | |||||||
Interest expense |
(101,281 | ) | (98,748 | ) | (79,789 | ) | ||||
Interest and other income |
5,603 | 9,568 | 5,164 | |||||||
Loss on interest rate derivatives |
(29,805 | ) | — | — | ||||||
Loss on early extinguishment of debt |
(1,683 | ) | — | — | ||||||
(Loss) income from continuing operations before equity in (loss) income of unconsolidated entities and income taxes |
(123,044 | ) | 35,352 | 55,703 | ||||||
Equity in (loss) income of unconsolidated entities |
(331 | ) | 1,376 | (941 | ) | |||||
Income tax benefit (expense) |
10,679 | (108 | ) | (196 | ) | |||||
(Loss) income from continuing operations |
(112,696 | ) | 36,620 | 54,566 | ||||||
Discontinued operations |
(14,343 | ) | 6,055 | 6,733 | ||||||
(Loss) income before gain on sales of real estate |
(127,039 | ) | 42,675 | 61,299 | ||||||
Gain on sales of real estate, net of income taxes |
2,721 | 2,829 | — | |||||||
Net (loss) income |
(124,318 | ) | 45,504 | 61,299 | ||||||
Less net loss (income) attributable to noncontrolling interests: |
||||||||||
Common units in the Operating Partnership |
8,341 | (2,116 | ) | (4,495 | ) | |||||
Preferred units in the Operating Partnership |
(660 | ) | (660 | ) | (660 | ) | ||||
Other consolidated entities |
(1,038 | ) | 32 | 185 | ||||||
Net (loss) income attributable to Corporate Office Properties Trust |
(117,675 | ) | 42,760 | 56,329 | ||||||
Preferred share dividends |
(16,102 | ) | (16,102 | ) | (16,102 | ) | ||||
Net (loss) income attributable to Corporate Office Properties Trust common shareholders |
$ | (133,777 | ) | $ | 26,658 | $ | 40,227 | |||
Net (loss) income attributable to Corporate Office Properties Trust: |
||||||||||
(Loss) income from continuing operations |
$ | (104,272 | ) | $ | 37,149 | $ | 50,244 | |||
Discontinued operations, net |
(13,403 | ) | 5,611 | 6,085 | ||||||
Net (loss) income attributable to Corporate Office Properties Trust |
$ | (117,675 | ) | $ | 42,760 | $ | 56,329 | |||
Basic earnings per common share(1) |
||||||||||
(Loss) income from continuing operations |
$ | (1.75 | ) | $ | 0.34 | $ | 0.59 | |||
Discontinued operations |
(0.19 | ) | 0.09 | 0.11 | ||||||
Net (loss) income attributable to COPT common shareholders |
$ | (1.94 | ) | $ | 0.43 | $ | 0.70 | |||
Diluted earnings per common share(1) |
||||||||||
(Loss) income from continuing operations |
$ | (1.75 | ) | $ | 0.34 | $ | 0.59 | |||
Discontinued operations |
(0.19 | ) | 0.09 | 0.11 | ||||||
Net (loss) income attributable to COPT common shareholders |
$ | (1.94 | ) | $ | 0.43 | $ | 0.70 | |||
See accompanying notes to consolidated financial statements.
F-5
Corporate Office Properties Trust and Subsidiaries
Consolidated Statements of Equity
(Dollars in thousands)
| |
Preferred Shares |
Common Shares |
Additional Paid-in Capital |
Cumulative Distributions in Excess of Net Income |
Accumulated Other Comprehensive Loss |
Non- controlling Interests |
Total | |||||||||||||||
|---|---|---|---|---|---|---|---|---|---|---|---|---|---|---|---|---|---|---|---|---|---|---|
Balance at December 31, 2008 (51,790,442 common shares outstanding) |
$ | 81 | $ | 518 | $ | 1,112,734 | $ | (162,572 | ) | $ | (4,749 | ) | $ | 136,411 | $ | 1,082,423 | ||||||
Conversion of common units to common shares (2,841,394 shares) |
— | 28 | 61,627 | — | — | (61,655 | ) | — | ||||||||||||||
Common shares issued to the public (2,990,000 shares) |
— | 30 | 71,795 | — | — | — | 71,825 | |||||||||||||||
Exercise of share options (464,601 shares) |
— | 4 | 5,222 | — | — | — | 5,226 | |||||||||||||||
Share-based compensation |
— | 3 | 10,599 | — | — | — | 10,602 | |||||||||||||||
Restricted common share redemptions (79,343 shares) |
— | — | (2,049 | ) | — | — | — | (2,049 | ) | |||||||||||||
Adjustments to noncontrolling interests resulting from changes in ownership of Operating Partnership by COPT |
— | — | (21,072 | ) | — | — | 21,072 | — | ||||||||||||||
Adjustments related to derivatives designated as cash flow hedges |
— | — | — | 2,842 | 585 | 3,427 | ||||||||||||||||
Decrease in tax benefit from share-based compensation |
— | — | (152 | ) | — | — | — | (152 | ) | |||||||||||||
Net income |
— | — | — | 56,329 | — | 4,970 | 61,299 | |||||||||||||||
Dividends |
— | — | — | (103,698 | ) | — | — | (103,698 | ) | |||||||||||||
Distributions to owners of common and preferred units in the Operating Partnership |
— | — | — | — | — | (8,622 | ) | (8,622 | ) | |||||||||||||
Contributions from noncontrolling interests in other consolidated entities |
— | — | — | — | — | 786 | 786 | |||||||||||||||
Distributions to noncontrolling interests in other consolidated entities |
— | — | — | — | — | (435 | ) | (435 | ) | |||||||||||||
Balance at December 31, 2009 (58,342,673 common shares outstanding) |
81 | 583 | 1,238,704 | (209,941 | ) | (1,907 | ) | 93,112 | 1,120,632 | |||||||||||||
Issuance of 4.25% Exchangeable Senior Notes |
— | — | 18,149 | — | — | — | 18,149 | |||||||||||||||
Conversion of common units to common shares (663,498 shares) |
— | 6 | 9,561 | — | — | (9,567 | ) | — | ||||||||||||||
Common shares issued to the public (7,475,000 shares) |
— | 75 | 245,546 | — | — | — | 245,621 | |||||||||||||||
Exercise of share options (278,656 shares) |
— | 3 | 4,572 | — | — | — | 4,575 | |||||||||||||||
Share-based compensation |
— | 2 | 11,843 | — | — | — | 11,845 | |||||||||||||||
Restricted common share redemptions (105,215 shares) |
— | — | (3,913 | ) | — | — | — | (3,913 | ) | |||||||||||||
Adjustments to noncontrolling interests resulting from changes in ownership of Operating Partnership by COPT |
— | — | (10,274 | ) | — | — | 10,274 | — | ||||||||||||||
Adjustments related to derivatives designated as cash flow hedges |
— | — | — | — | (2,256 | ) | 472 | (1,784 | ) | |||||||||||||
Net income |
— | — | — | 42,760 | — | 2,744 | 45,504 | |||||||||||||||
Dividends |
— | — | — | (114,613 | ) | — | — | (114,613 | ) | |||||||||||||
Distributions to owners of common and preferred units in the Operating Partnership |
— | — | — | — | — | (7,926 | ) | (7,926 | ) | |||||||||||||
Contributions from noncontrolling interests in other consolidated entities |
— | — | — | — | — | 9,510 | 9,510 | |||||||||||||||
Acquisition of noncontrolling interests in other consolidated entities |
— | — | (2,344 | ) | — | — | (2,118 | ) | (4,462 | ) | ||||||||||||
Balance at December 31, 2010 (66,931,582 common shares outstanding) |
81 | 669 | 1,511,844 | (281,794 | ) | (4,163 | ) | 96,501 | 1,323,138 | |||||||||||||
Conversion of common units to common shares (100,939 shares) |
— | 1 | 1,520 | — | — | (1,521 | ) | — | ||||||||||||||
Common shares issued to the public (4,600,000 shares) |
— | 46 | 145,321 | — | — | — | 145,367 | |||||||||||||||
Exercise of share options (191,264 shares) |
— | 2 | 2,459 | — | — | — | 2,461 | |||||||||||||||
Share-based compensation |
— | 2 | 14,265 | — | — | — | 14,267 | |||||||||||||||
Restricted common share redemptions (114,687 shares) |
— | — | (3,990 | ) | — | — | — | (3,990 | ) | |||||||||||||
Adjustments to noncontrolling interests resulting from changes in ownership of Operating Partnership by COPT |
— | — | (2,798 | ) | — | — | 2,798 | — | ||||||||||||||
Adjustments related to derivatives designated as cash flow hedges |
— | — | — | — | 2,430 | (930 | ) | 1,500 | ||||||||||||||
Increase in tax benefit from share-based compensation |
— | — | 47 | — | — | — | 47 | |||||||||||||||
Net loss |
— | — | — | (117,675 | ) | — | (6,643 | ) | (124,318 | ) | ||||||||||||
Dividends |
— | — | — | (132,819 | ) | — | — | (132,819 | ) | |||||||||||||
Distributions to owners of common and preferred units in the Operating Partnership |
— | — | — | — | — | (7,833 | ) | (7,833 | ) | |||||||||||||
Contributions from noncontrolling interests in other consolidated entities |
— | — | (23 | ) | — | — | 284 | 261 | ||||||||||||||
Distributions to noncontrolling interests in other consolidated entities |
— | — | — | — | — | (16 | ) | (16 | ) | |||||||||||||
Balance at December 31, 2011 (72,011,324 common shares outstanding) |
$ | 81 | $ | 720 | $ | 1,668,645 | $ | (532,288 | ) | $ | (1,733 | ) | $ | 82,640 | $ | 1,218,065 | ||||||
See accompanying notes to consolidated financial statements.
F-6
Corporate Office Properties Trust and Subsidiaries
Consolidated Statements of Cash Flows
(Dollars in thousands)
| |
For the Years Ended December 31, | |||||||||
|---|---|---|---|---|---|---|---|---|---|---|
| |
2011 | 2010 | 2009 | |||||||
Cash flows from operating activities |
||||||||||
Revenues from real estate operations received |
$ | 476,762 | $ | 453,847 | $ | 417,494 | ||||
Construction contract and other service revenues received |
88,433 | 112,644 | 346,281 | |||||||
Property operating expenses paid |
(188,237 | ) | (180,619 | ) | (150,693 | ) | ||||
Construction contract and other service expenses paid |
(94,140 | ) | (124,867 | ) | (325,223 | ) | ||||
General and administrative and business development expenses paid |
(19,831 | ) | (16,975 | ) | (19,559 | ) | ||||
Interest expense paid |
(93,715 | ) | (87,917 | ) | (73,327 | ) | ||||
Previously accreted interest expense paid |
(17,314 | ) | — | — | ||||||
Interest and other income received |
698 | 323 | 161 | |||||||
Payments in connection with early extinguishment of debt |
(353 | ) | — | — | ||||||
Income taxes paid |
(160 | ) | — | (317 | ) | |||||
Net cash provided by operating activities |
152,143 | 156,436 | 194,817 | |||||||
Cash flows from investing activities |
||||||||||
Purchases of and additions to properties |
||||||||||
Construction, development and redevelopment |
(232,667 | ) | (303,064 | ) | (176,364 | ) | ||||
Acquisitions of operating properties |
(32,856 | ) | (146,275 | ) | (45,010 | ) | ||||
Tenant improvements on operating properties |
(37,195 | ) | (20,826 | ) | (14,622 | ) | ||||
Other capital improvements on operating properties |
(16,906 | ) | (10,422 | ) | (15,569 | ) | ||||
Proceeds from sales of properties |
79,638 | 27,576 | 65 | |||||||
Proceeds from sale of equity method investment |
5,773 | — | — | |||||||
Mortgage and other loan receivables funded or acquired |
(23,377 | ) | (5,588 | ) | (82,413 | ) | ||||
Mortgage and other loan receivables payments received |
16,759 | 1,568 | 680 | |||||||
Leasing costs paid |
(15,997 | ) | (14,403 | ) | (8,786 | ) | ||||
Investment in unconsolidated entities |
(250 | ) | (6,600 | ) | (3,000 | ) | ||||
Other |
(3,309 | ) | (1,133 | ) | (4,057 | ) | ||||
Net cash used in investing activities |
(260,387 | ) | (479,167 | ) | (349,076 | ) | ||||
Cash flows from financing activities |
||||||||||
Proceeds from debt, including issuance of exchangeable senior notes |
1,636,206 | 1,022,912 | 1,066,413 | |||||||
Repayments of debt |
||||||||||
Scheduled principal amortization |
(13,755 | ) | (13,996 | ) | (11,489 | ) | ||||
Other repayments |
(1,511,100 | ) | (799,663 | ) | (863,243 | ) | ||||
Deferred financing costs paid |
(13,113 | ) | (8,570 | ) | (3,388 | ) | ||||
Net proceeds from issuance of common shares |
147,828 | 250,196 | 77,052 | |||||||
Acquisition of noncontrolling interests in consolidated entities |
— | (4,462 | ) | — | ||||||
Dividends paid |
(130,745 | ) | (109,894 | ) | (100,095 | ) | ||||
Distributions paid |
(7,891 | ) | (8,099 | ) | (9,579 | ) | ||||
Restricted share redemptions |
(3,990 | ) | (3,913 | ) | (2,049 | ) | ||||
Other |
261 | 60 | 2,124 | |||||||
Net cash provided by financing activities |
103,701 | 324,571 | 155,746 | |||||||
Net (decrease) increase in cash and cash equivalents |
(4,543 | ) | 1,840 | 1,487 | ||||||
Cash and cash equivalents |
||||||||||
Beginning of period |
10,102 | 8,262 | 6,775 | |||||||
End of period |
$ | 5,559 | $ | 10,102 | $ | 8,262 | ||||
See accompanying notes to consolidated financial statements.
F-7
Corporate Office Properties Trust and Subsidiaries
Consolidated Statements of Cash Flows (Continued)
(Dollars in thousands)
| |
For the Years Ended December 31, | |||||||||
|---|---|---|---|---|---|---|---|---|---|---|
| |
2011 | 2010 | 2009 | |||||||
Reconciliation of net (loss) income to net cash provided by operating activities: |
||||||||||
Net (loss) income |
$ | (124,318 | ) | $ | 45,504 | $ | 61,299 | |||
Adjustments to reconcile net (loss) income to net cash provided by operating activities: |
||||||||||
Depreciation and other amortization |
136,594 | 125,819 | 111,811 | |||||||
Impairment losses |
151,021 | — | — | |||||||
Loss on interest rate derivatives |
29,805 | |||||||||
Settlement of previously accreted interest expense |
(17,314 | ) | — | — | ||||||
Amortization of deferred financing costs |
6,596 | 5,871 | 4,214 | |||||||
Increase in deferred rent receivable |
(10,102 | ) | (5,706 | ) | (1,296 | ) | ||||
Amortization of net debt discounts |
5,540 | 5,841 | 3,412 | |||||||
Gain on sales of real estate |
(7,528 | ) | (3,917 | ) | — | |||||
Gain on equity method investment |
(2,452 | ) | (6,406 | ) | (442 | ) | ||||
Share-based compensation |
11,920 | 11,845 | 10,602 | |||||||
Other |
1,356 | (3,872 | ) | (5,693 | ) | |||||
Changes in operating assets and liabilities: |
||||||||||
Increase in accounts receivable |
(7,094 | ) | (1,680 | ) | (3,634 | ) | ||||
(Increase) decrease in restricted cash and marketable securities and prepaid expenses and other assets |
(2,496 | ) | 3,799 | (2,745 | ) | |||||
(Decrease) increase in accounts payable, accrued expenses and other liabilities |
(17,330 | ) | (19,644 | ) | 15,787 | |||||
(Decrease) increase in rents received in advance and security deposits |
(2,055 | ) | (1,018 | ) | 1,502 | |||||
Net cash provided by operating activities |
$ | 152,143 | $ | 156,436 | $ | 194,817 | ||||
Supplemental schedule of non-cash investing and financing activities: |
||||||||||
Increase in accrued capital improvements, leasing and other investing activity costs |
$ | 11,719 | $ | 4,576 | $ | 6,256 | ||||
Increase in property, debt and other liabilities in connection with acquisitions |
$ | 3,040 | $ | 74,244 | $ | 3,085 | ||||
Cancellation of mortgage loans receivable in connection with acquisitions |
$ | — | $ | — | $ | 102,575 | ||||
Increase in property and noncontrolling interests in connection with property contribution by a noncontrolling interest in a joint venture |
$ | — | $ | 9,000 | $ | — | ||||
Increase (decrease) in fair value of derivatives applied to AOCL and noncontrolling interests |
$ | 1,438 | $ | (1,846 | ) | $ | 3,365 | |||
Dividends/distributions payable |
$ | 35,038 | $ | 32,986 | $ | 28,440 | ||||
Decrease in noncontrolling interests and increase in shareholders' equity in connection with the conversion of common units into common shares |
$ | 1,521 | $ | 9,567 | $ | 61,654 | ||||
Adjustments to noncontrolling interests resulting from changes in ownership of Operating Partnership by COPT |
$ | 2,798 | $ | 10,274 | $ | 21,072 | ||||
See accompanying notes to consolidated financial statements.
F-8
Corporate Office Properties Trust and Subsidiaries
Notes to Consolidated Financial Statements
1. Organization
Corporate Office Properties Trust ("COPT") and subsidiaries (collectively, the "Company," "we" or "us") is a fully-integrated and self-managed real estate investment trust ("REIT") that focuses primarily on serving the specialized requirements of strategic customers in the United States Government and defense information technology sectors. We acquire, develop, manage and lease office and data center properties that are typically concentrated in large office parks primarily located adjacent to government demand drivers and/or in office markets that we believe possess growth opportunities. As of December 31, 2011, our investments in real estate included the following:
We conduct almost all of our operations through our operating partnership, Corporate Office Properties, L.P. (the "Operating Partnership"), of which we are the managing general partner. The Operating Partnership owns real estate both directly and through subsidiary partnerships and limited liability companies ("LLCs"). A summary of our Operating Partnership's forms of ownership and the percentage of those ownership forms owned by COPT as of December 31, 2011 and 2010 follows:
| |
December 31, | ||||||
|---|---|---|---|---|---|---|---|
| |
2011 | 2010 | |||||
Common Units |
94 | % | 94 | % | |||
Series G Preferred Units |
100 | % | 100 | % | |||
Series H Preferred Units |
100 | % | 100 | % | |||
Series I Preferred Units |
0 | % | 0 | % | |||
Series J Preferred Units |
100 | % | 100 | % | |||
Series K Preferred Units |
100 | % | 100 | % | |||
Three of our trustees also controlled, either directly or through ownership by other entities or family members, an additional 5% of the Operating Partnership's common units of the Operating Partnership ("common units") as of December 31, 2011.
In addition to owning real estate, the Operating Partnership also owns entities that provide property management and construction and development services primarily for our properties but also for third parties.
F-9
Corporate Office Properties Trust and Subsidiaries
Notes to Consolidated Financial Statements (Continued)
2. Summary of Significant Accounting Policies
Basis of Presentation
The consolidated financial statements include the accounts of COPT, the Operating Partnership, their subsidiaries and other entities in which we have a majority voting interest and control. We also consolidate certain entities when control of such entities can be achieved through means other than voting rights ("variable interest entities" or "VIEs") if we are deemed to be the primary beneficiary of such entities. We eliminate all significant intercompany balances and transactions in consolidation.
We use the equity method of accounting when we own an interest in an entity and can exert significant influence over the entity's operations but cannot control the entity's operations.
We use the cost method of accounting when we own an interest in an entity and cannot exert significant influence over its operations.
Reclassification
We reclassified certain amounts from prior periods to conform to the current period presentation of our consolidated financial statements with no effect on previously reported net income or equity.
Use of Estimates in the Preparation of Financial Statements
We make estimates and assumptions when preparing financial statements under generally accepted accounting principles ("GAAP"). These estimates and assumptions affect various matters, including:
Significant estimates are inherent in the presentation of our financial statements in a number of areas, including the evaluation of the collectability of accounts and notes receivable, the allocation of property acquisition costs, the determination of estimated useful lives of assets, the determination of lease terms, the evaluation of impairment of long-lived assets, the amount of revenue recognized relating to tenant improvements and the level of expense recognized in connection with share-based compensation. Actual results could differ from these and other estimates.
Acquisitions of Properties
Upon completion of property acquisitions, we allocate the purchase price to tangible and intangible assets and liabilities associated with such acquisitions based on our estimates of their fair values. We determine these fair values by using market data and independent appraisals available to us and making numerous estimates and assumptions. We allocate property acquisitions to the following components:
F-10
Corporate Office Properties Trust and Subsidiaries
Notes to Consolidated Financial Statements (Continued)
2. Summary of Significant Accounting Policies (Continued)
estimate of improvements per square foot provided under market leases that would be attributable to the remaining non-cancellable terms of the respective leases;
Properties
We report properties to be developed or held and used in operations at our depreciated cost, reduced for impairment losses. The preconstruction stage of the development or redevelopment of an operating property includes efforts and related costs to secure land control and zoning, evaluate feasibility and complete other initial tasks which are essential to development. We capitalize interest expense, real estate taxes and direct and indirect project costs, including labor and related administrative costs, associated with properties, or portions thereof, undergoing construction, development and redevelopment activities. We continue to capitalize these costs while construction, development or redevelopment activities are underway until a property becomes "operational," which occurs upon the earlier of when leases commence or one year after the cessation of major construction activities. When leases commence on portions of a newly-constructed or redeveloped property in the period prior to one year from the cessation of major construction activities, we consider that property to be "partially operational." When a property is partially operational, we allocate the costs associated with the property between the portion that is operational and the portion under construction. We start depreciating newly-constructed and redeveloped properties as they become operational.
Most of our leases involve some form of improvements to leased space. When we are required to provide improvements under the terms of a lease, we determine whether the improvements constitute landlord assets or tenant assets. We capitalize the cost of the improvements when we deem the
F-11
Corporate Office Properties Trust and Subsidiaries
Notes to Consolidated Financial Statements (Continued)
2. Summary of Significant Accounting Policies (Continued)
improvements to be landlord assets. In determining whether improvements constitute landlord or tenant assets, we consider numerous factors, including: whether the improvements are unique to the tenant or reusable by other tenants; whether the tenant is permitted to alter or remove the improvements without our consent or without compensating us for any lost fair value; whether the ownership of the improvements remains with us or remains with the tenant at the end of the lease term; and whether the economic substance of the lease terms is properly reflected.
We depreciate our fixed assets using the straight-line method over their estimated useful lives as follows:
• Buildings and building improvements |
10 - 40 years | |
• Land improvements |
10 - 20 years | |
• Tenant improvements on operating properties |
Related lease terms | |
• Equipment and personal property |
3 - 10 years |
If events or changes in circumstances indicate that the carrying values of operating properties, properties in development or land held for future development may be impaired, we perform a recovery analysis based on the estimated undiscounted future cash flows to be generated from the operations and eventual disposition of such properties. If the analysis indicates that the carrying value of a tested property is not recoverable from estimated future cash flows, it is written down to its estimated fair value and an impairment loss is recognized. Fair values are determined based on estimated future cash flows using appropriate discount and capitalization rates or third-party valuations or appraisals. The estimated cash flows used for the impairment analysis and determining the fair values are based on our plans for the tested property and our views of market and economic conditions. The estimates consider matters such as current and future rental rates, occupancies for the tested property and comparable properties, estimated operating and capital expenditures and recent sales data for comparable properties.
When we determine that a property is held for sale, we discontinue the recording of depreciation expense on the property and estimate the fair value, net of selling costs; if we then determine that the estimated fair value, net of selling costs, is less than the net book value of the property, we recognize an impairment loss equal to the difference and reduce the net book value of the property.
When we sell an operating property, or determine that an operating property is held for sale, and determine that we have no significant continuing involvement in such property, we classify the results of operations for such property as discontinued operations. Interest expense that is specifically identifiable to properties included in discontinued operations is used in the computation of interest expense attributable to discontinued operations. When properties classified as discontinued operations are included in computations that determine the amount of our borrowing capacity under certain debt instruments (including our Revolving Credit Facility), we allocate a portion of such debt instruments' interest expense to discontinued operations; we compute this allocation based on the percentage that the related properties represent of all properties included in determining the amount of our borrowing capacity under such debt instruments.
We expense property maintenance and repair costs when incurred.
F-12
Corporate Office Properties Trust and Subsidiaries
Notes to Consolidated Financial Statements (Continued)
2. Summary of Significant Accounting Policies (Continued)
Sales of Interests in Real Estate
We recognize gains from sales of interests in real estate using the full accrual method, provided that various criteria relating to the terms of sale and any subsequent involvement by us with the real estate sold are met. We recognize gains relating to transactions that do not meet the requirements of the full accrual method of accounting when the full accrual method of accounting criteria are met.
Cash and Cash Equivalents
Cash and cash equivalents include all cash and liquid investments that mature three months or less from when they are purchased. Cash equivalents are reported at cost, which approximates fair value. We maintain our cash in bank accounts in amounts that may exceed Federally insured limits at times. We have not experienced any losses in these accounts in the past and believe that we are not exposed to significant credit risk because our accounts are deposited with major financial institutions.
Investments in Marketable Securities
We classify marketable securities as trading securities when we have the intent to sell such securities in the near term, and classify other marketable securities as available-for-sale securities. We determine the appropriate classification of investments in marketable securities at the acquisition date and re-evaluate the classification at each balance sheet date. We report investments in marketable securities classified as trading securities at fair value, with unrealized gains and losses recognized through earnings. We report investments in marketable securities classified as available-for-sale securities at fair value, with net unrealized gains or losses deferred to AOCL and realized gains and losses resulting from sales of such investments recognized through earnings.
Accounts and Deferred Rents Receivable and Mortgage and Other Investing Receivables
We maintain allowances for estimated losses resulting from the failure of our customers or borrowers to satisfy their payment obligations. We use judgment in estimating these allowances based primarily upon the payment history and credit status of the entities associated with the individual receivables. We write off these receivables when we believe the facts and circumstances indicate that continued pursuit of collection is no longer warranted. When we earn interest income in connection with receivables for which we have established allowances, we establish allowances in connection with such interest income that is unpaid. When cash is received in connection with receivables for which we have established allowances, we reduce the amount of losses recognized in connection with the receivables' allowance.
F-13
Corporate Office Properties Trust and Subsidiaries
Notes to Consolidated Financial Statements (Continued)
2. Summary of Significant Accounting Policies (Continued)
Intangible Assets and Deferred Revenue on Real Estate Acquisitions
We capitalize intangible assets and deferred revenue on real estate acquisitions as described in the section above entitled "Acquisitions of Properties." We amortize the intangible assets and deferred revenue as follows:
• Above- and below-market leases |
Related lease terms | |
• In-place lease value |
Related lease terms | |
• Tenant relationship value |
Estimated period of time that tenant will lease space in property | |
• Above- and below- market cost arrangements |
Term of arrangements | |
• Market concentration premium |
40 years |
We recognize the amortization of acquired above-market and below-market leases as adjustments to rental revenue. We recognize the amortization of above- and below- market cost arrangements as adjustments to property operating expenses. We recognize the amortization of other intangible assets on property acquisitions as amortization expense.
Deferred Leasing and Financing Costs, Net
We defer costs that we incur to obtain new tenant leases or extend existing tenant leases. We amortize these costs evenly over the lease terms. When tenant leases are terminated early, we expense any unamortized deferred leasing costs associated with those leases over the remaining life of the lease.
We defer costs for financing arrangements and recognize these costs as interest expense over the related loan terms on a straight-line basis, which approximates the amortization that would occur under the effective interest method of amortization. We expense any unamortized loan costs when loans are retired early.
Revenue Recognition
We recognize minimum rents, net of abatements, on a straight-line basis over the non-cancelable term of tenant leases (including periods under bargain renewal options). The non-cancelable term of a lease includes periods when a tenant: (1) may not terminate its lease obligation early; or (2) may terminate its lease obligation early in exchange for a fee or penalty that we consider material enough such that termination would not be probable. We report the amount by which our minimum rental revenue recognized on a straight-line basis under leases exceeds the contractual rent billings associated with such leases as deferred rent receivable on our consolidated balance sheets. Amounts by which our minimum rental revenue recognized on a straight-line basis under leases are less than the contractual rent billings associated with such leases are included in deferred revenue associated with operating leases on our consolidated balance sheets.
In connection with a tenant's entry into, or modification of, a lease, if we make cash payments to, or on behalf of, the tenant for purposes other than funding the construction of landlord assets, we defer the amount of such payments as lease incentives. We amortize lease incentives as a reduction of rental revenue over the term of the lease.
F-14
Corporate Office Properties Trust and Subsidiaries
Notes to Consolidated Financial Statements (Continued)
2. Summary of Significant Accounting Policies (Continued)
We recognize tenant recovery revenue in the same periods in which we incur the related expenses. Tenant recovery revenue includes payments from tenants as reimbursement for property taxes, utilities and other property operating expenses.
We recognize fees received for lease terminations as revenue and write off against such revenue any (1) deferred rents receivable, and (2) deferred revenue, lease incentives and intangible assets that are amortizable into rental revenue associated with the leases; the resulting net amount is the net revenue from the early termination of the leases. When a tenant's lease for space in a property is terminated early but the tenant continues to lease such space under a new or modified lease in the property, the net revenue from the early termination of the lease is recognized evenly over the remaining life of the new or modified lease in place on that property.
We recognize fees for services provided by us once services are rendered, fees are determinable and collectability is assured. We recognize revenue under construction contracts using the percentage of completion method when the revenue and costs for such contracts can be estimated with reasonable accuracy; when these criteria do not apply to a contract, we recognize revenue on that contract using the completed contract method. Under the percentage of completion method, we recognize a percentage of the total estimated revenue on a contract based on the cost of services provided on the contract as of a point in time relative to the total estimated costs on the contract.
Interest Rate Derivatives
Our primary objectives in using interest rate derivatives are to add stability to interest expense and to manage exposure to interest rate movements. To accomplish this objective, we primarily use interest rate swaps as part of our interest rate risk management strategy. Interest rate swaps designated as cash flow hedges involve the receipt of variable-rate amounts from a counterparty in exchange for our making fixed-rate payments over the life of the agreements without exchange of the underlying notional amount. Derivatives are used to hedge the cash flows associated with interest rates on existing debt as well as future debt. We recognize all derivatives as assets or liabilities in the balance sheet at fair value. We defer the effective portion of changes in fair value of the designated cash flow hedges to accumulated other comprehensive loss ("AOCL") and reclassify such deferrals to interest expense as interest expense is recognized on the hedged forecasted transactions. We recognize the ineffective portion of the change in fair value of interest rate derivatives directly in interest expense. When an interest rate swap designated as a cash flow hedge no longer qualifies for hedge accounting, we recognize changes in fair value of the hedge previously deferred to AOCL, along with any changes in fair value occurring thereafter, through earnings. We do not use interest rate derivatives for trading or speculative purposes. We manage counter-party risk by only entering into contracts with major financial institutions based upon their credit ratings and other risk factors.
We use standard market conventions and techniques such as discounted cash flow analysis, option pricing models, replacement cost and termination cost in computing the fair value of derivatives at each balance sheet date.
Please refer to Note 11 for additional information pertaining to interest rate derivatives.
F-15
Corporate Office Properties Trust and Subsidiaries
Notes to Consolidated Financial Statements (Continued)
2. Summary of Significant Accounting Policies (Continued)
Share-Based Compensation
In 2010 and 2011, we issued two forms of share-based compensation: restricted common shares ("restricted shares") and performance share units ("PSUs"). In years prior to 2009, we also issued options to purchase common shares of beneficial interest ("options"). We account for share-based compensation in accordance with authoritative guidance provided by the FASB that establishes standards for the accounting for transactions in which an entity exchanges its equity instruments for goods or services, focusing primarily on accounting for transactions in which an entity obtains employee services in share-based payment transactions. The guidance requires us to measure the cost of employee services received in exchange for an award of equity instruments based generally on the fair value of the award on the grant date; such cost is then recognized over the period during which the employee is required to provide service in exchange for the award. No compensation cost is recognized for equity instruments for which employees do not render the requisite service. The guidance also requires that share-based compensation be computed based on awards that are ultimately expected to vest; as a result, future forfeitures of awards are estimated at the time of grant and revised, if necessary, in subsequent periods if actual forfeitures differ from those estimates. If an award is voluntarily cancelled by an employee, we recognize the previously unrecognized cost associated with the original award on the date of such cancellation. We capitalize costs associated with share-based compensation attributable to employees engaged in construction and development activities.
When we adopted the authoritative guidance on accounting for share-based compensation, we elected to adopt the alternative transition method for calculating the tax effects of share-based compensation. The alternative transition method enabled us to use a simplified method to establishing the beginning balance of the additional paid-in capital pool related to the tax effects of employee share-based compensation, which was available to absorb tax deficiencies recognized subsequent to the adoption of this guidance.
We compute the fair value of options using the Black-Scholes option-pricing model. Under that model, the risk-free interest rate is based on the U.S. Treasury yield curve in effect at the time of grant. The expected option life is based on our historical experience of employee exercise behavior. Expected volatility is based on historical volatility of our common shares of beneficial interest ("common shares"). Expected dividend yield is based on the average historical dividend yield on our common shares over a period of time ending on the grant date of the options.
We compute the fair value of PSUs using a Monte Carlo model. Under that model, the baseline common share value is based on the market value on the grant date. The risk-free interest rate is based on the U.S. Treasury yield curve in effect at the time of grant. Expected volatility is based on historical volatility of our common shares.
Recent Accounting Pronouncements
In May 2011, the Financial Accounting Standards Board ("FASB") issued guidance to amend measurement and disclosure requirements related to fair value measurements to improve consistency with International Financial Reporting Standards. This guidance will be effective prospectively for interim and annual periods beginning after December 15, 2011. We are in the process of evaluating this guidance and currently do not believe that it will have a material effect on our consolidated financial statements.
F-16
Corporate Office Properties Trust and Subsidiaries
Notes to Consolidated Financial Statements (Continued)
2. Summary of Significant Accounting Policies (Continued)
In June 2011, the FASB issued guidance on the presentation of comprehensive income that will require us to present the total of comprehensive income, the components of net income and the components of other comprehensive income either in a single continuous statement of comprehensive income or in two separate but consecutive statements. This guidance eliminates the option to present the components of other comprehensive income as part of the statement of equity. This guidance requires retrospective application and is effective for fiscal years, and interim periods within those years, beginning after December 15, 2011.
In September 2011, the FASB issued guidance on the testing of goodwill for impairment that will permit us to first assess qualitative factors to determine whether it is more likely than not that the fair value of a reporting unit is less than its carrying amount as a basis for determining whether it is necessary to perform the two-step goodwill impairment test. This guidance eliminates the requirement to calculate the fair value of a reporting unit unless the entity determines that it is more likely than not that its fair value is less than its carrying amount. The guidance will be effective for annual and interim goodwill impairment tests performed for fiscal years beginning after December 15, 2011. We are in the process of evaluating this guidance and currently do not believe that it will have a material effect on our consolidated financial statements.
3. Fair Value Measurements
Accounting standards define fair value as the exit price, or the amount that would be received upon sale of an asset or paid to transfer a liability in an orderly transaction between market participants as of the measurement date. The standards also establish a hierarchy for inputs used in measuring fair value that maximizes the use of observable inputs and minimizes the use of unobservable inputs by requiring that the most observable inputs be used when available. Observable inputs are inputs market participants would use in valuing the asset or liability developed based on market data obtained from sources independent of us. Unobservable inputs are inputs that reflect our assumptions about the factors market participants would use in valuing the asset or liability developed based upon the best information available in the circumstances. The hierarchy of these inputs is broken down into three levels: Level 1 inputs are quoted prices (unadjusted) in active markets for identical assets or liabilities; Level 2 inputs include (1) quoted prices for similar assets or liabilities in active markets, (2) quoted prices for identical or similar assets or liabilities in markets that are not active and (3) inputs (other than quoted prices) that are observable for the asset or liability, either directly or indirectly; and Level 3 inputs are unobservable inputs for the asset or liability. Categorization within the valuation hierarchy is based upon the lowest level of input that is most significant to the fair value measurement.
The assets held in connection with our non-qualified elective deferred compensation plan (comprised primarily of mutual funds and equity securities) and the corresponding liability to the participants are measured at fair value on a recurring basis on our consolidated balance sheet using quoted market prices, as are other marketable securities that we hold. The deferred compensation plan assets and other marketable securities are included in the line entitled restricted cash and marketable securities on our consolidated balance sheets. The offsetting liability associated with the deferred compensation plan is adjusted to fair value at the end of each accounting period based on the fair value of the plan assets and reported in other liabilities on our consolidated balance sheets. The assets and corresponding liability of our non-qualified elective deferred compensation plan and other marketable securities that we hold are classified in Level 1 of the fair value hierarchy.
F-17
Corporate Office Properties Trust and Subsidiaries
Notes to Consolidated Financial Statements (Continued)
3. Fair Value Measurements (Continued)
The fair values of our interest rate derivatives are determined using widely accepted valuation techniques, including discounted cash flow analysis on the expected cash flows of each derivative. This analysis reflects the contractual terms of the derivatives, including the period to maturity, and uses observable market-based inputs, including interest rate market data and implied volatilities in such interest rates. While we determined that the majority of the inputs used to value our derivatives fall within Level 2 of the fair value hierarchy, the credit valuation adjustments associated with our interest rate derivatives also utilize Level 3 inputs, such as estimates of current credit spreads to evaluate the likelihood of default. However, as of December 31, 2011, we assessed the significance of the impact of the credit valuation adjustments on the overall valuation of our derivatives and determined that these adjustments are not significant. As a result, we determined that our interest rate derivative valuations in their entirety are classified in Level 2 of the fair value hierarchy.
As discussed in Note 9, we own warrants to purchase common shares in The KEYW Holding Corporation ("KEYW"). We acquired these warrants in March 2010 and began accounting for such warrants as derivatives in November 2010 when KEYW became a publicly-traded company. We compute the fair value of these warrants using the Black-Scholes option-pricing model. Under that model, the risk-free interest rate is based on the U.S. Treasury yield curve in effect as of the valuation date. The expected life is based on the period of time until the expiration of the warrants. Expected volatility is based on an average of the historical volatility of companies in KEYW's industry that we deem to be comparable. Expected dividend yield is based on the dividend yield on KEYW's common shares as of the date of valuation. The warrants are classified in Level 2 of the fair value hierarchy.
F-18
Corporate Office Properties Trust and Subsidiaries
Notes to Consolidated Financial Statements (Continued)
3. Fair Value Measurements (Continued)
The tables below set forth our financial assets and liabilities that are accounted for at fair value on a recurring basis as of December 31, 2011 and 2010 and the hierarchy level of inputs used in measuring their respective fair values under applicable accounting standards (in thousands):
Description
|
Quoted Prices in Active Markets for Identical Assets (Level 1) |
Significant Other Observable Inputs (Level 2) |
Significant Unobservable Inputs (Level 3) |
Total | |||||||||
|---|---|---|---|---|---|---|---|---|---|---|---|---|---|
December 31, 2011: |
|||||||||||||
Assets: |
|||||||||||||
Marketable securities in deferred compensation plan(1) |
|||||||||||||
Mutual funds |
$ | 5,878 | $ | — | $ | — | $ | 5,878 | |||||
Common stocks |
909 | — | — | 909 | |||||||||
Preferred stocks |
320 | — | — | 320 | |||||||||
Cash and cash equivalents |
281 | — | — | 281 | |||||||||
Other |
200 | — | — | 200 | |||||||||
Common stocks(1) |
13,928 | — | — | 13,928 | |||||||||
Interest rate derivative(2) |
— | 716 | — | 716 | |||||||||
Warrants to purchase common shares in KEYW(2) |
— | 125 | — | 125 | |||||||||
Assets |
$ | 21,516 | $ | 841 | $ | — | $ | 22,357 | |||||
Liabilities: |
|||||||||||||
Deferred compensation plan liability(3) |
$ | 7,588 | $ | — | $ | — | $ | 7,588 | |||||
Interest rate derivatives |
— | 30,863 | — | 30,863 | |||||||||
Liabilities |
$ | 7,588 | $ | 30,863 | $ | — | $ | 38,451 | |||||
December 31, 2010: |
|||||||||||||
Assets: |
|||||||||||||
Marketable securities in deferred compensation plan(1) |
|||||||||||||
Mutual funds |
$ | 6,114 | $ | — | $ | — | $ | 6,114 | |||||
Common stocks |
1,132 | — | — | 1,132 | |||||||||
Preferred stocks |
320 | — | — | 320 | |||||||||
Cash and cash equivalents |
422 | — | — | 422 | |||||||||
Other |
200 | — | — | 200 | |||||||||
Common stock(1) |
363 | — | — | 363 | |||||||||
Interest rate derivative(2) |
— | 644 | — | 644 | |||||||||
Warrants to purchase common shares in KEYW(2) |
— | 466 | — | 466 | |||||||||
Assets |
$ | 8,551 | $ | 1,110 | $ | — | $ | 9,661 | |||||
Liabilities: |
|||||||||||||
Deferred compensation plan liability(3) |
$ | 8,188 | $ | — | $ | — | $ | 8,188 | |||||
Interest rate derivatives |
— | 4,226 | — | 4,226 | |||||||||
Liabilities |
$ | 8,188 | $ | 4,226 | $ | — | $ | 12,414 | |||||
F-19
Corporate Office Properties Trust and Subsidiaries
Notes to Consolidated Financial Statements (Continued)
3. Fair Value Measurements (Continued)
We recognized impairment losses in 2011 on certain properties and other assets associated with such properties. Accordingly, certain properties and related assets were adjusted to fair value in 2011. The fair values of these assets were determined using widely accepted valuation techniques, including discounted cash flows using appropriate discount and capitalization rates, analysis of recent comparable transactions and actual sale negotiations. The table below sets forth the fair value hierarchy of the valuation techniques used by us in determining such fair values (dollars in thousands).
Description
|
Quoted Prices in Active Markets for Identical Assets (Level 1) |
Significant Other Observable Inputs (Level 2) |
Significant Unobservable Inputs (Level 3) |
Total | Impairment Losses Recognized |
|||||||||||
|---|---|---|---|---|---|---|---|---|---|---|---|---|---|---|---|---|
Year Ended December 31, 2011: |
||||||||||||||||
Assets(1): |
||||||||||||||||
Properties, net |
$ | — | $ | 15,994 | $ | 304,900 | $ | 320,894 | $ | 150,093 | ||||||
Deferred rent receivable |
— | 36 | 6,321 | 6,357 | — | |||||||||||
Intangible assets on real estate acquisitions |
— | 235 | 8,341 | 8,576 | — | |||||||||||
Deferred leasing and financing costs |
— | 51 | 7,041 | 7,092 | — | |||||||||||
Prepaid and other assets |
— | — | 163 | 163 | 928 | |||||||||||
The carrying values of cash and cash equivalents, restricted cash, accounts receivables, other assets (excluding mortgage loans receivable) and accounts payable and accrued expenses are reasonable estimates of their fair values because of the short maturities of these instruments. We estimated the fair values of our mortgage loans receivable disclosed in Note 9 by using discounted cash flow analyses based on an appropriate market rate for a similar type of instrument. We estimated the fair values of our debt disclosed in Note 10 based on quoted market prices for publicly-traded debt and on the discounted estimated future cash payments to be made for other debt; the discount rates used approximate current market rates for loans, or groups of loans, with similar maturities and credit quality, and the estimated future payments include scheduled principal and interest payments. Fair value estimates are made at a specific point in time, are subjective in nature and involve uncertainties and matters of significant judgment. Settlement of such fair value amounts may not be possible and may not be a prudent management decision.
For additional fair value information, please refer to Note 9 for mortgage loans receivable, Note 10 for debt and Note 11 for interest rate derivatives.
F-20
Corporate Office Properties Trust and Subsidiaries
Notes to Consolidated Financial Statements (Continued)
4. Concentration of Rental Revenue
We derived large concentrations of our revenue from real estate operations from certain tenants during the periods set forth in our consolidated statements of operations. The following table summarizes the percentage of our rental revenue (which excludes tenant recoveries and other real estate operations revenue) earned from (1) individual tenants that accounted for at least 5% of our rental revenue from continuing and discontinued operations and (2) the aggregate of the five tenants from which we recognized the most rental revenue in the respective years:
| |
For the Years Ended December 31, |
|||||||||
|---|---|---|---|---|---|---|---|---|---|---|
| |
2011 | 2010 | 2009 | |||||||
United States Government |
17 | % | 16 | % | 15 | % | ||||
Northrop Grumman Corporation(1) |
8 | % | 9 | % | 8 | % | ||||
Booz Allen Hamilton, Inc. |
6 | % | 5 | % | 6 | % | ||||
Five largest tenants |
38 | % | 35 | % | 34 | % | ||||
We also derived in excess of 90% of our construction contract revenue from the United States Government in each of the years set forth on the consolidated statements of operations.
In addition, we derived large concentrations of our total revenue from real estate operations (defined as the sum of rental revenue and tenant recoveries and other real estate operations revenue) from certain geographic regions. These concentrations are set forth in the segment information provided in Note 16. Several of these regions, including the Baltimore/Washington Corridor, Northern Virginia, Washington, DC—Capitol Riverfront, St. Mary's & King George Counties, Greater Baltimore, Maryland ("Greater Baltimore") and Suburban Maryland, are within close proximity to each other, and all but two of our regions with real estate operations (San Antonio, Texas ("San Antonio") and Colorado Springs, Colorado ("Colorado Springs")) are located in the Mid-Atlantic region of the United States.
5. Properties, net
Operating properties, net consisted of the following (in thousands):
| |
December 31, | ||||||
|---|---|---|---|---|---|---|---|
| |
2011 | 2010 | |||||
Land |
$ | 472,483 | $ | 501,210 | |||
Buildings and improvements |
2,801,252 | 2,804,595 | |||||
Less: accumulated depreciation |
(559,679 | ) | (503,032 | ) | |||
Operating properties, net |
$ | 2,714,056 | $ | 2,802,773 | |||
F-21
Corporate Office Properties Trust and Subsidiaries
Notes to Consolidated Financial Statements (Continued)
5. Properties, net (Continued)
Projects we had in development or held for future development consisted of the following (in thousands):
| |
December 31, | ||||||
|---|---|---|---|---|---|---|---|
| |
2011 | 2010 | |||||
Land |
$ | 229,833 | $ | 256,487 | |||
Construction in progress, excluding land |
409,086 | 386,195 | |||||
Projects in development or held for future development |
$ | 638,919 | $ | 642,682 | |||
Strategic Reallocation Plan and Impairment Losses
In April 2011, we completed a review of our portfolio and identified a number of properties that are no longer closely aligned with our strategy, and our Board of Trustees approved a plan by Management to dispose of some of these properties (the "Strategic Reallocation Plan"). In December 2011, we identified additional properties for disposal, and our Board of Trustees approved a plan by management to increase the scope of the Strategic Reallocation Plan to include the disposition of additional properties. We determined that the carrying amounts of certain of the properties included in the Strategic Reallocation Plan (the "Impaired Properties") will not likely be recovered from the cash flows from the operations and sales of such properties over the shorter holding periods. Accordingly, we recognized aggregate non-cash impairment losses in 2011 of $122.5 million (including $23.3 million classified as discontinued operations and excluding $8.7 million in related income tax benefit) for the amounts by which the carrying values of the Impaired Properties exceeded their respective estimated fair values.
We estimate that the aggregate fair value of the land and 83 operating properties included in the Strategic Reallocation Plan totaled $562 million at December 31, 2011 and that net proceeds from the plan's execution after the repayment of debt secured by the properties will approximate $441 million. We expect to complete the operating property dispositions by the end of 2013 and use the proceeds to invest in properties that will serve customers in the United States Government, defense information technology and related data sectors, to repay borrowings on our Revolving Credit Facility and for general corporate purposes. We completed the sale of the following properties under the Strategic Reallocation Plan in 2011 (dollars in thousands):
Project Name
|
Location | Date of Sale |
Number of Buildings |
Total Rentable Square Feet |
Sale Price | Gain on Sale |
|||||||||||
|---|---|---|---|---|---|---|---|---|---|---|---|---|---|---|---|---|---|
1344 & 1348 Ashton Road and 1350 Dorsey Road |
Hanover, Maryland | 5/24/2011 | 3 | 39,000 | $ | 3,800 | $ | 150 | |||||||||
216 Schilling Circle |
Hunt Valley, Maryland | 8/23/2011 | 1 | 36,000 | 4,700 | 175 | |||||||||||
Towson Portfolio |
Towson, Maryland | 9/29/2011 | 4 | 179,000 | 16,000 | 1,134 | |||||||||||
11011 McCormick Road |
Hunt Valley, Maryland | 11/1/2011 | 1 | 57,000 | 3,450 | 822 | |||||||||||
10001 Franklin Square Drive |
White Marsh, Maryland | 12/13/2011 | 1 | 218,000 | 16,250 | 305 | |||||||||||
Rutherford Business Center Portfolio |
Woodlawn, Maryland | 12/15/2011 | 13 | 365,000 | 32,460 | 2,221 | |||||||||||
|
23 | 894,000 | $ | 76,660 | $ | 4,807 | |||||||||||
F-22
Corporate Office Properties Trust and Subsidiaries
Notes to Consolidated Financial Statements (Continued)
5. Properties, net (Continued)
On February 15 and 17, 2011, the United States Army (the "Army") provided us disclosures regarding the past testing and use of tactical defoliants/herbicides at our property in Cascade, Maryland that was formerly an Army base known as Fort Ritchie ("Fort Ritchie"). Upon receipt of these disclosures, we commenced a review of our development plans and prospects for the property. We believe that these disclosures by the Army are likely to cause further delays in the resolution of certain existing litigation related to the property, and that they also increase the level of uncertainty as to our ultimate development rights at the property and future residential and commercial demand for the property. We analyzed various possible outcomes and resulting cash flows expected from the operations and ultimate disposition of the property. After determining that the carrying amount of the property will not likely be recovered from those cash flows, we recognized a non-cash impairment loss of $27.7 million in March 2011 for the amount by which the carrying value of the property exceeded its estimated fair value.
In 2011, we also recognized additional impairment losses of $803,000 on goodwill associated with operating properties.
The table below sets forth the impairment losses recognized in 2011 by period of recognition and by property classification (in thousands):
| |
Three Months Ended | ||||||||||||
|---|---|---|---|---|---|---|---|---|---|---|---|---|---|
| |
3/31/2011 | 6/30/2011 | 12/31/2011 | Total | |||||||||
Non-operating properties |
$ | 27,742 | $ | 13,574 | $ | 39,193 | $ | 80,509 | |||||
Operating properties |
— | 31,031 | 39,481 | 70,512 | |||||||||
Total |
$ | 27,742 | $ | 44,605 | $ | 78,674 | $ | 151,021 | |||||
2011 Acquisition
On August 9, 2011, we acquired 310 The Bridge Street, a 138,000 square foot office property in Huntsville, Alabama that was 100% leased, for $33.4 million. The table below sets forth the allocation of the acquisition costs of this property (in thousands):
Land, operating properties |
$ | 261 | ||
Building and improvements |
26,577 | |||
Intangible assets on real estate acquisitions |
6,575 | |||
Total assets |
$ | 33,413 | ||
F-23
Corporate Office Properties Trust and Subsidiaries
Notes to Consolidated Financial Statements (Continued)
5. Properties, net (Continued)
Intangible assets recorded in connection with the above acquisitions included the following (dollars in thousands):
| |
|
Weighted Average Amortization Period (in Years) |
|||||
|---|---|---|---|---|---|---|---|
Tenant relationship value |
$ | 3,187 | 8 | ||||
In-place lease value |
2,904 | 3 | |||||
Above-market leases |
484 | 3 | |||||
|
$ | 6,575 | 6 | ||||
We expensed $156,000 in 2011 in connection with acquisitions of operating properties that are included in business development expenses on our consolidated statements of operations.
2011 Construction Activities
During 2011, we placed into service an aggregate of 566,000 square feet in seven newly constructed office properties, including three in the Baltimore/Washington Corridor, two in Greater Baltimore, one in San Antonio and one in St. Mary's County. As of December 31, 2011, we had construction underway on six office properties that we estimate will total 789,000 square feet upon completion, including three in the Baltimore/Washington Corridor, one in Greater Baltimore, one in Northern Virginia and one in Huntsville, Alabama, and redevelopment underway on one office property in Greater Philadelphia that we estimate will total 113,000 square feet upon completion.
2010 Acquisitions
Our acquisitions in 2010 included:
F-24
Corporate Office Properties Trust and Subsidiaries
Notes to Consolidated Financial Statements (Continued)
5. Properties, net (Continued)
a fair value at assumption of $73.3 million with a stated fixed interest rate of 5.35% (effective interest rate of 3.95%) that matures in March 2014; and
The table below sets forth the allocation of the aggregate acquisition costs of these properties (in thousands):
Land, operating properties |
$ | 13,265 | ||
Land, development |
5,545 | |||
Building and improvements |
173,589 | |||
Construction in progress |
85,525 | |||
Intangible assets on real estate acquisitions |
42,896 | |||
Total assets |
320,820 | |||
Below-market leases |
(231 | ) | ||
Total acquisition cost |
$ | 320,589 | ||
Intangible assets recorded in connection with the above acquisitions included the following (dollars in thousands):
| |
|
Weighted Average Amortization Period (in Years) |
|||||
|---|---|---|---|---|---|---|---|
In-place lease value |
$ | 21,616 | 4 | ||||
Tenant relationship value |
14,450 | 10 | |||||
Above-market cost arrangements |
6,193 | 40 | |||||
Above-market leases |
637 | 2 | |||||
|
$ | 42,896 | 11 | ||||
We expensed $3.4 million in 2010 in connection with acquisitions of operating properties that are included in business development expenses on our consolidated statements of operations.
2010 Construction Activities
During 2010, we placed into service an aggregate of 816,000 square feet in nine newly constructed office properties, including three in the Baltimore/Washington Corridor, two in greater Baltimore, two in San Antonio and two in Colorado Springs.
F-25
Corporate Office Properties Trust and Subsidiaries
Notes to Consolidated Financial Statements (Continued)
6. Real Estate Joint Ventures
During the periods included herein, we had an investment in one unconsolidated real estate joint venture accounted for using the equity method of accounting. Information pertaining to this joint venture investment is set forth below (dollars in thousands):
| Investment Balance at(1) | |
|
|
|
|||||||||||
|---|---|---|---|---|---|---|---|---|---|---|---|---|---|---|---|
| December 31, 2011 | December 31, 2010 | Date Acquired |
Ownership | Nature of Activity | Maximum Exposure to Loss(2) |
||||||||||
| $ | (6,071 | ) | $ | (5,545 | ) | 9/29/2005 | 20 | % | Operates 16 buildings | $ | — | ||||
Net cash flows of the joint venture are distributed to the partners in proportion to their respective ownership interests. We recognized fees from the joint venture totaling $119,000 in 2009 for property management, construction and leasing services but recognized no such fees in 2011 and 2010.
The following table sets forth condensed balance sheets for this unconsolidated real estate joint venture (in thousands):
| |
December 31, | ||||||
|---|---|---|---|---|---|---|---|
| |
2011 | 2010 | |||||
Properties, net |
$ | 59,792 | $ | 61,521 | |||
Other assets |
3,529 | 4,174 | |||||
Total assets |
$ | 63,321 | $ | 65,695 | |||
Liabilities (primarily debt) |
$ | 67,710 | $ | 67,454 | |||
Owners' equity |
(4,389 | ) | (1,759 | ) | |||
Total liabilities and owners' equity |
$ | 63,321 | $ | 65,695 | |||
F-26
Corporate Office Properties Trust and Subsidiaries
Notes to Consolidated Financial Statements (Continued)
6. Real Estate Joint Ventures (Continued)
The following table sets forth condensed statements of operations for this unconsolidated real estate joint venture (in thousands):
| |
For the Years Ended December 31, |
|||||||||
|---|---|---|---|---|---|---|---|---|---|---|
| |
2011 | 2010 | 2009 | |||||||
Revenues |
$ | 7,577 | $ | 8,405 | $ | 9,031 | ||||
Property operating expenses |
(3,673 | ) | (3,600 | ) | (3,438 | ) | ||||
Interest expense |
(3,913 | ) | (3,937 | ) | (3,981 | ) | ||||
Depreciation and amortization expense |
(2,463 | ) | (3,154 | ) | (3,198 | ) | ||||
Net loss |
$ | (2,472 | ) | $ | (2,286 | ) | $ | (1,586 | ) | |
The table below sets forth information pertaining to our investments in consolidated real estate joint ventures at December 31, 2011 (dollars in thousands):
| |
|
|
|
December 31, 2011(1) | |||||||||||||
|---|---|---|---|---|---|---|---|---|---|---|---|---|---|---|---|---|---|
| |
Date Acquired |
Ownership % at 12/31/2011 |
Nature of Activity | Total Assets |
Pledged Assets |
Total Liabilities |
|||||||||||
M Square Associates, LLC |
6/26/2007 | 50.0 | % | Operating two buildings and developing others(2) | $ | 59,941 | $ | 47,901 | $ | 44,265 | |||||||
LW Redstone Company, LLC |
3/23/2010 | 85.0 | % | Developing business park(3) | 48,985 | — | 9,014 | ||||||||||
Arundel Preserve #5, LLC |
7/2/2007 | 50.0 | % | Operating one building(4) | 30,254 | 29,353 | 17,343 | ||||||||||
COPT-FD Indian Head, LLC |
10/23/2006 | 75.0 | % | Developing land parcel(5) | 6,538 | — | 2 | ||||||||||
MOR Forbes 2 LLC |
12/24/2002 | 50.0 | % | Operating one building(6) | 3,884 | — | 29 | ||||||||||
|
$ | 149,602 | $ | 77,254 | $ | 70,653 | |||||||||||
With regard to our consolidated joint ventures:
F-27
Corporate Office Properties Trust and Subsidiaries
Notes to Consolidated Financial Statements (Continued)
6. Real Estate Joint Ventures (Continued)
entitled to repayment of infrastructure and vertical construction costs funded by us and preferred returns on such fundings before our partner is entitled to receive repayment of its equity contribution. In addition, we will be entitled to 85% of distributable cash in excess of preferred returns.
With regard to our accounting for real estate joint ventures:
In connection with LW Redstone, LLC, we anticipate funding certain infrastructure costs (up to a maximum of $76.0 million) that we expect will be reimbursed by the City of Huntsville; as of December 31, 2011, we advanced $17.7 million to the City to fund such costs (included in prepaid expenses and other assets on our consolidated balance sheet). We also expect to fund additional development and construction costs through equity contributions to the extent that third party financing is not obtained. Our partner is not required to make any future contributions to the joint venture.
Our commitments and contingencies pertaining to our real estate joint ventures are disclosed in Note 21.
F-28
Corporate Office Properties Trust and Subsidiaries
Notes to Consolidated Financial Statements (Continued)
7. Intangible Assets on Real Estate Acquisitions
Intangible assets on real estate acquisitions consisted of the following (in thousands):
| |
December 31, 2011 | December 31, 2010 | |||||||||||||||||
|---|---|---|---|---|---|---|---|---|---|---|---|---|---|---|---|---|---|---|---|
| |
Gross Carrying Amount |
Accumulated Amortization |
Net Carrying Amount |
Gross Carrying Amount |
Accumulated Amortization |
Net Carrying Amount |
|||||||||||||
In-place lease value |
$ | 151,361 | $ | 97,594 | $ | 53,767 | $ | 162,708 | $ | 92,380 | $ | 70,328 | |||||||
Tenant relationship value |
45,940 | 23,246 | 22,694 | 50,320 | 21,603 | 28,717 | |||||||||||||
Above-market cost arrangements |
12,416 | 2,857 | 9,559 | 12,415 | 1,387 | 11,028 | |||||||||||||
Above-market leases |
10,118 | 8,037 | 2,081 | 10,802 | 8,193 | 2,609 | |||||||||||||
Market concentration premium |
1,333 | 314 | 1,019 | 1,333 | 280 | 1,053 | |||||||||||||
|
$ | 221,168 | $ | 132,048 | $ | 89,120 | $ | 237,578 | $ | 123,843 | $ | 113,735 | |||||||
Amortization of the intangible asset categories set forth above totaled $28.3 million in 2011, $28.3 million in 2010 and $24.1 million in 2009. The approximate weighted average amortization periods of the categories set forth above follow: in-place lease value: seven years; tenant relationship value: eight years; above-market cost arrangements: 26 years; above-market leases: five years; and market concentration premium: 31 years. The approximate weighted average amortization period for all of the categories combined is 12 years. Estimated amortization expense associated with the intangible asset categories set forth above for the next five years is: $18.0 million for 2012; $13.8 million for 2013; $11.5 million for 2014; $9.5 million for 2015 and $8.2 million for 2016.
8. Deferred Leasing and Financing Costs
Deferred leasing and financing costs, net consisted of the following (in thousands):
| |
December 31, | ||||||
|---|---|---|---|---|---|---|---|
| |
2011 | 2010 | |||||
Deferred leasing costs |
$ | 96,140 | $ | 88,265 | |||
Deferred financing costs |
44,159 | 31,784 | |||||
Accumulated amortization |
(73,784 | ) | (59,400 | ) | |||
Deferred leasing and financing costs, net |
$ | 66,515 | $ | 60,649 | |||
F-29
Corporate Office Properties Trust and Subsidiaries
Notes to Consolidated Financial Statements (Continued)
9. Prepaid Expenses and Other Assets
Prepaid expenses and other assets consisted of the following (in thousands):
| |
December 31, | ||||||
|---|---|---|---|---|---|---|---|
| |
2011 | 2010 | |||||
Mortgage and other investing receivables |
$ | 27,998 | $ | 18,870 | |||
Prepaid expenses |
20,035 | 19,995 | |||||
Deferred tax asset |
10,892 | 276 | |||||
Furniture, fixtures and equipment, net |
10,177 | 11,504 | |||||
Lease incentives |
5,233 | 3,899 | |||||
Construction contract costs incurred in excess of billings |
2,094 | 9,372 | |||||
Investment in KEYW |
125 | 22,779 | |||||
Other assets |
11,065 | 7,201 | |||||
Prepaid expenses and other assets |
$ | 87,619 | $ | 93,896 | |||
Mortgage and Other Investing Receivables
Mortgage and other investing receivables consisted of the following (in thousands):
| |
December 31, | ||||||
|---|---|---|---|---|---|---|---|
| |
2011 | 2010 | |||||
Notes receivable from City of Huntsville |
$ | 17,741 | $ | 4,643 | |||
Mortgage loans receivable |
10,257 | 14,227 | |||||
|
$ | 27,998 | $ | 18,870 | |||
Our mortgage loans receivable reflected above at December 31, 2011 consisted of two loans secured by properties in Greater Baltimore and the Baltimore/Washington Corridor. Our note receivable from the City of Huntsville funded infrastructure costs in connection with our LW Redstone Company, LLC joint venture (see Note 6). We did not have an allowance for credit losses in connection with these receivables at December 31, 2011 or December 31, 2010. The fair value of our mortgage and other investing receivables totaled $28.0 million at December 31, 2011 and $18.8 million at December 31, 2010.
Investment in The KEYW Holding Corporation
Our investment in KEYW consists of common stock and warrants to purchase additional shares of common stock of KEYW, an entity supporting the intelligence community's operations and transformation to Cyber Age mission by providing engineering services and integrated platforms that support the intelligence process. We owned 1.9 million shares, or approximately 7%, of KEYW's common stock at December 31, 2011 and 3.1 million shares, or approximately 12%, at December 31, 2010. The carrying value of our equity method investment in these common shares was $22.3 million at December 31, 2010, which was included in prepaid expenses and other assets on our consolidated balance sheet as of such date. In March 2011, we entered into a sales plan that complies with the requirements of Rule 10b5-1(c) under the Securities Exchange Act of 1934, as amended, to sell up to 1.6 million shares of our KEYW common stock in 2011; we completed the sale of 1.2 million shares under this plan in 2011, resulting in $2.1 million in gain recognized. We used the equity method of
F-30
Corporate Office Properties Trust and Subsidiaries
Notes to Consolidated Financial Statements (Continued)
9. Prepaid Expenses and Other Assets (Continued)
accounting for our investment in the common stock until the resignation of our Chief Executive Officer from the Board of Directors of KEYW effective July 1, 2011, at which time we began accounting for our investment in KEYW's common stock as a trading marketable equity security to be reported at fair value, with unrealized gains and losses recognized through earnings. Our investment in these common shares had a fair value of $13.8 million at December 31, 2011 based on the closing price of KEYW's common stock on the NASDAQ Stock Market on that date and is included in the line entitled "restricted cash and marketable securities" on our consolidated balance sheet.
We acquired warrants to purchase 50,000 additional shares of KEYW common stock at an exercise price of $9.25 per share in March 2010 for $210,000 and began accounting for such warrants as derivatives in November 2010 when KEYW became a publicly-traded company. We report these warrants at fair value. The estimated fair value of these warrants was $125,000, or $2.51 per warrant, at December 31, 2011 and $466,000, or $9.32 per warrant, at December 31, 2010.
We recognized revenue from a lease with KEYW in one of our properties of $780,000 in 2011, $668,000 in 2010 and $315,000 in 2009.
Operating Notes Receivable
We had operating notes receivable due from tenants with terms exceeding one year totaling $530,000 at December 31, 2011 and $655,000 at December 31, 2010. We carried allowances for estimated losses for most of these balances.
F-31
Corporate Office Properties Trust and Subsidiaries
Notes to Consolidated Financial Statements (Continued)
10. Debt
Our debt consisted of the following (dollars in thousands):
| |
|
Carrying Value at | |
|
|||||||||
|---|---|---|---|---|---|---|---|---|---|---|---|---|---|
| |
Maximum Availability at December 31, 2011 |
December 31, 2011 |
December 31, 2010 |
Stated Interest Rates at December 31, 2011 |
Scheduled Maturity Dates at December 31, 2011 |
||||||||
Mortgage and Other Secured Loans: |
|||||||||||||
Fixed rate mortgage loans(1) |
N/A | $ | 1,052,421 | $ | 1,173,358 | 5.20% - 7.87%(2) | 2012 - 2034 | ||||||
Revolving Construction Facility |
N/A | — | 142,339 | N/A | N/A | ||||||||
Variable rate secured loans |
N/A | 39,213 | 310,555 | LIBOR + 2.25%(3) | 2015 | ||||||||
Other construction loan facilities |
123,802 | 40,336 | 16,753 | LIBOR + 1.95% to 2.75%(4) | 2012 - 2015 | ||||||||
Total mortgage and other secured loans |
1,131,970 | 1,643,005 | |||||||||||
Revolving Credit Facility(5) |
$ | 1,000,000 | 662,000 | 295,000 | LIBOR + 1.75% to 2.50%(6) | September 1, 2014 | |||||||
Term Loan Facility |
400,000 | 400,000 | — | LIBOR + 1.65% to 2.40%(7) | September 1, 2015 | ||||||||
Unsecured notes payable |
N/A | 5,050 | 1,947 | 0% (8) | 2015 - 2026 | ||||||||
Exchangeable Senior Notes: |
|||||||||||||
4.25% Exchangeable Senior Notes |
N/A | 227,283 | 223,846 | 4.25% | April 2030 | ||||||||
3.5% Exchangeable Senior Notes |
N/A | — | 159,883 | N/A | N/A | ||||||||
Total debt |
$ | 2,426,303 | $ | 2,323,681 | |||||||||
Effective September 1, 2011, we entered into a credit agreement providing for an unsecured revolving credit facility (the "Revolving Credit Facility") with a group of lenders for which J.P. Morgan Securities LLC and KeyBanc Capital Markets acted as joint lead arrangers and joint book runners, KeyBank National Association acted as administrative agent and JPMorgan Chase Bank, N.A. and Bank of America, N.A. acted as co-syndication agents. The lenders' aggregate commitment under the facility is $1.0 billion, with a right for us to increase the lenders' aggregate commitment to $1.5 billion, provided that there is no default under the facility. Amounts available under the facility are computed based on 60% of our unencumbered asset value, as defined in the agreement. The facility matures on September 1, 2014, and may be extended by one year at our option, provided that there is no default under the facility and we pay an extension fee of 0.20% of the total availability of the facility. The
F-32
Corporate Office Properties Trust and Subsidiaries
Notes to Consolidated Financial Statements (Continued)
10. Debt (Continued)
interest rate on the facility is based on LIBOR (customarily the 30-day rate) plus 1.75% to 2.50%, as determined by our leverage levels. The facility also carries a quarterly fee that is based on the unused amount of the facility multiplied by a per annum rate of 0.25% to 0.35%. As of December 31, 2011, the maximum amount of borrowing capacity under this facility totaled $1.0 billion, of which $329.6 million was available.
Effective September 1, 2011, we entered into an unsecured term loan agreement ("Term Loan Agreement") with the same group of lenders as the Revolving Credit Facility under which we borrowed $400.0 million, with a right for us to borrow an additional $100.0 million, provided that there is no default under the agreement. The Term Loan Agreement matures on September 1, 2015, and may be extended by one year at our option, provided that there is no default and we pay an extension fee of 0.20% of the total availability of the agreement. The variable interest rate on the Term Loan Agreement is based on LIBOR rate (customarily the 30-day rate) plus 1.65% to 2.40%, as determined by our leverage levels.
Upon entry into the Revolving Credit Facility and Term Loan Agreement on September 1, 2011, we repaid and extinguished our previously existing Revolving Credit Facility and Revolving Construction Facility and used most of the remaining proceeds to repay two variable rate secured loans totaling $270.3 million. Upon the early extinguishment of this debt, we recognized a loss of $1.7 million, representing unamortized issuance costs.
On April 7, 2010, the Operating Partnership issued a $240.0 million aggregate principal amount of 4.25% Exchangeable Senior Notes due 2030. Interest on the notes is payable on April 15 and October 15 of each year. The notes have an exchange settlement feature that provides that the notes may, under certain circumstances, be exchangeable for cash and, at the Operating Partnership's discretion, our common shares at an exchange rate (subject to adjustment) of 20.8513 shares per one thousand dollar principal amount of the notes (exchange rate is as of December 31, 2011 and is equivalent to an exchange price of $47.96 per common share) (the initial exchange rate of the notes was based on a 20% premium over the closing price on the NYSE on the transaction pricing date). On or after April 20, 2015, the Operating Partnership may redeem the notes in cash in whole or in part. The holders of the notes have the right to require us to repurchase the notes in cash in whole or in part on each of April 15, 2015, April 15, 2020 and April 15, 2025, or in the event of a "fundamental change," as defined under the terms of the notes, for a repurchase price equal to 100% of the principal amount of the notes plus accrued and unpaid interest. The notes are general unsecured senior obligations of the Operating Partnership and rank equally in right of payment with all other senior unsecured indebtedness of the Operating Partnership and are guaranteed by us. The initial liability component of this debt issuance was $221.4 million and the equity component was $18.6 million. The carrying value of these notes included an unamortized discount totaling $12.7 million at December 31, 2011 and $16.2 million at December 31, 2010. The effective interest rate on the liability component, including amortization of the issuance costs, is 6.05%. Because the closing price of our common shares at December 31, 2011 and 2010 was less than the exchange price per common share applicable to these notes, the if-converted value of the notes did not exceed the principal amount. The table below sets
F-33
Corporate Office Properties Trust and Subsidiaries
Notes to Consolidated Financial Statements (Continued)
10. Debt (Continued)
forth interest expense recognized on these notes before deductions for amounts capitalized (in thousands):
| |
For the Years Ended December 31, |
||||||
|---|---|---|---|---|---|---|---|
| |
2011 | 2010 | |||||
Interest expense at stated interest rate |
$ | 10,200 | $ | 7,480 | |||
Interest expense associated with amortization of discount |
3,437 | 2,445 | |||||
Total |
$ | 13,637 | $ | 9,925 | |||
Until September 15, 2011, the Operating Partnership had $162.5 million aggregate principal amount of 3.50% Exchangeable Senior Notes due 2026. These notes had an exchange settlement feature that provided that the notes were, under certain circumstances, exchangeable for cash (up to the principal amount of the notes) and, with respect to any excess exchange value, were exchangeable into (at our option) cash, our common shares or a combination of cash and our common shares. On September 15, 2011, we repurchased these notes at 100% of the principal amount of $162.5 million after the holders of such notes surrendered them for repurchase pursuant to the terms of the notes and the related Indenture. The effective interest rate under the notes, including amortization of the issuance costs, was 5.97%. The carrying value of these notes at December 31, 2010 included a principal amount of $162.5 million and an unamortized discount totaling $2.6 million. Because the closing price of our common shares at December 31, 2010 was less than the exchange price per common share applicable to these notes, the if-converted value of the notes did not exceed the principal amount. The table below sets forth interest expense recognized on these notes before deductions for amounts capitalized (in thousands):
| |
For the Years Ended December 31, |
|||||||||
|---|---|---|---|---|---|---|---|---|---|---|
| |
2011 | 2010 | 2009 | |||||||
Interest expense at stated interest rate |
$ | 4,013 | $ | 5,687 | $ | 5,687 | ||||
Interest expense associated with amortization of discount |
2,617 | 3,736 | 3,520 | |||||||
Total |
$ | 6,630 | $ | 9,423 | $ | 9,207 | ||||
At December 31, 2011, we were in default on a $15.2 million nonrecourse mortgage loan secured by a property with an estimated fair value of approximately $9 million that is included in our Strategic Reallocation Plan.
Certain of our debt instruments require that we comply with a number of restrictive financial covenants, including maximum leverage ratio, unencumbered leverage ratio, minimum net worth, minimum fixed charge coverage, minimum unencumbered interest coverage ratio, minimum debt service and maximum secured indebtedness ratio. As of December 31, 2011, we were well within the compliance requirements of these financial covenants.
F-34
Corporate Office Properties Trust and Subsidiaries
Notes to Consolidated Financial Statements (Continued)
10. Debt (Continued)
Our debt matures on the following schedule (in thousands):
2012 |
$ | 66,063 | (1) | |
2013 |
163,003 | (2) | ||
2014 |
820,780 | (3) | ||
2015 |
806,104 | (4) | ||
2016 |
278,642 | |||
Thereafter |
303,879 | |||
Total |
$ | 2,438,471 | (5) | |
Weighted average borrowings under our Revolving Credit Facilities totaled $482.3 million in 2011 and $337.2 million in 2010. The weighted average interest rate on our Revolving Credit Facilities was 1.65% in 2011 and 1.11% in 2010.
We capitalized interest costs of $17.4 million in 2011, $16.5 million in 2010 and $15.5 million in 2009.
The following table sets forth information pertaining to the fair value of our debt (in thousands):
| |
December 31, 2011 | December 31, 2010 | |||||||||||
|---|---|---|---|---|---|---|---|---|---|---|---|---|---|
| |
Carrying Amount |
Estimated Fair Value |
Carrying Amount |
Estimated Fair Value |
|||||||||
Fixed-rate debt |
$ | 1,284,754 | $ | 1,292,501 | $ | 1,559,034 | $ | 1,579,022 | |||||
Variable-rate debt |
1,141,549 | 1,139,856 | 764,647 | 769,247 | |||||||||
|
$ | 2,426,303 | $ | 2,432,357 | $ | 2,323,681 | $ | 2,348,269 | |||||
F-35
Corporate Office Properties Trust and Subsidiaries
Notes to Consolidated Financial Statements (Continued)
11. Interest Rate Derivatives
The following table sets forth the key terms and fair values of our interest rate swap derivatives at December 31, 2011 and 2010 (dollars in thousands):
| |
|
|
|
|
Fair Value at December 31, | ||||||||||||
|---|---|---|---|---|---|---|---|---|---|---|---|---|---|---|---|---|---|
| Notional Amount |
Fixed Rate |
|
Effective Date |
Expiration Date |
|||||||||||||
| Floating Rate Index | 2011 | 2010 | |||||||||||||||
| $ | 50,000 | 0.5025 | % | One-Month LIBOR | 1/3/2011 | 1/3/2012 | $ | (1 | ) | $ | (64 | ) | |||||
| 50,000 | 0.5025 | % | One-Month LIBOR | 1/3/2011 | 1/3/2012 | (1 | ) | (64 | ) | ||||||||
| 50,000 | 0.4400 | % | One-Month LIBOR | 1/4/2011 | 1/3/2012 | — | (34 | ) | |||||||||
| 120,000 | 1.7600 | % | One-Month LIBOR | 1/2/2009 | 5/1/2012 | (552 | ) | (2,062 | ) | ||||||||
| 100,000 | 1.9750 | % | One-Month LIBOR | 1/1/2010 | 5/1/2012 | (532 | ) | (2,002 | ) | ||||||||
| 100,000 | 0.6123 | % | One-Month LIBOR | 1/3/2012 | 9/1/2014 | 55 | N/A | ||||||||||
| 100,000 | 0.6100 | % | One-Month LIBOR | 1/3/2012 | 9/1/2014 | 56 | N/A | ||||||||||
| 100,000 | 0.8320 | % | One-Month LIBOR | 1/3/2012 | 9/1/2015 | (66 | ) | N/A | |||||||||
| 100,000 | 0.8320 | % | One-Month LIBOR | 1/3/2012 | 9/1/2015 | (49 | ) | N/A | |||||||||
| 39,213 | (1) | 3.8300 | % | One-Month LIBOR | 11/2/2010 | 11/2/2015 | (1,054 | ) | 644 | ||||||||
| 100,000 | (2) | 3.8415 | % | Three-Month LIBOR | 9/30/2011 | 9/30/2021 | (16,333 | ) | N/A | ||||||||
| 75,000 | (2) | 3.8450 | % | Three-Month LIBOR | 9/30/2011 | 9/30/2021 | (12,275 | ) | N/A | ||||||||
| 100,000 | (2) | 2.0525 | % | Three-Month LIBOR-Reverse | 12/30/2011 | 9/30/2021 | 345 | N/A | |||||||||
| 75,000 | (2) | 2.0525 | % | Three-Month LIBOR-Reverse | 12/30/2011 | 9/30/2021 | 260 | N/A | |||||||||
| $ | (30,147 | ) | $ | (3,582 | ) | ||||||||||||
Each of the one-month LIBOR interest rate swaps set forth in the table above was designated as a cash flow hedge of interest rate risk.
On April 5, 2011, we entered into the two forward starting three-month LIBOR swaps set forth above with an effective date of September 30, 2011 for an aggregate notional amount of $175 million. We designated these swaps as cash flow hedges of interest payments on ten-year, fixed-rate borrowings forecasted to occur between August 2011 and April 2012. After meeting with our Board of Trustees on December 21, 2011, we determined that we would pursue other financing options and concluded that the originally forecasted borrowings were expected not to occur. Accordingly, the swaps no longer qualified for hedge accounting. On December 22, 2011, we entered into the two reverse three-month LIBOR swaps set forth above with an effective date of December 30, 2011 for an aggregate notional amount of $175 million in order to remove the majority of the variability in the termination value of the forward starting swaps entered into on April 5, 2011. We recognized aggregate net losses of $29.8 million on these interest rate swaps in December 2011. On January 5, 2012, we cash settled all of the forward starting swaps entered into on April 5, 2011 and December 22, 2011 and interest accrued thereon for an aggregate of $29.7 million.
F-36
Corporate Office Properties Trust and Subsidiaries
Notes to Consolidated Financial Statements (Continued)
11. Interest Rate Derivatives (Continued)
The table below sets forth the fair value of our interest rate derivatives as well as their classification on our consolidated balance sheet as of December 31, 2011 and 2010 (in thousands):
| |
December 31, 2011 | December 31, 2010 | |||||||||
|---|---|---|---|---|---|---|---|---|---|---|---|
Derivatives
|
Balance Sheet Location | Fair Value | Balance Sheet Location | Fair Value | |||||||
Interest rate swaps designated as cash flow hedges |
Prepaid expenses and other assets | $ | 111 | Prepaid expenses and other assets | $ | 644 | |||||
Interest rate swaps not designated as hedges |
Prepaid expenses and other assets | 605 | N/A | N/A | |||||||
Interest rate swaps designated as cash flow hedges |
Interest rate derivatives | (2,255 | ) | Interest rate derivatives | (4,226 | ) | |||||
Interest rate swaps not designated as hedges |
Interest rate derivatives | (28,608 | ) | N/A | N/A | ||||||
The table below presents the effect of our interest rate derivatives on our consolidated statements of operations and comprehensive income for 2011and 2010 (in thousands):
| |
For the Years Ended December 31, |
|||||||||
|---|---|---|---|---|---|---|---|---|---|---|
| |
2011 | 2010 | 2009 | |||||||
Amount of loss recognized in AOCL (effective portion) |
$ | (31,531 | ) | $ | (5,473 | ) | $ | (3,253 | ) | |
Amount of loss reclassified from AOCL into interest expense (effective portion) |
(4,601 | ) | (3,689 | ) | (6,680 | ) | ||||
Amount of loss reclassified from AOCL to loss on interest rate derivatives upon discontinuing hedge accounting |
28,430 | — | — | |||||||
Amount of loss on interest rate derivatives recognized subsequent to such derivatives no longer being designated as hedges |
1,375 | — | — | |||||||
Amount of loss recognized in interest expense (ineffective portion and amount excluded from effectiveness testing |
— | — | (261 | ) | ||||||
Over the next 12 months, we estimate that approximately $2.4 million will be reclassified from AOCL as an increase to interest expense.
We have agreements with each of our interest rate derivative counterparties that contain provisions under which if we default or are capable of being declared in default on any of our indebtedness, we could also be declared in default on our derivative obligations. These agreements also incorporate the loan covenant provisions of our indebtedness with a lender affiliate of the derivative counterparties. Failure to comply with the loan covenant provisions could result in our being declared in default on any derivative instrument obligations covered by the agreements. As of December 31, 2011, the fair value of interest rate derivatives in a liability position related to these agreements was $30.9 million, excluding the effects of accrued interest. As of December 31, 2011, we had not posted any collateral related to these agreements. We are not in default with any of these provisions. If we breached any of these provisions, we could be required to settle our obligations under the agreements at their termination value of $33.3 million.
F-37
Corporate Office Properties Trust and Subsidiaries
Notes to Consolidated Financial Statements (Continued)
12. Shareholders' Equity
Preferred Shares
At December 31, 2011, we had 15.0 million preferred shares of beneficial interest ("preferred shares") authorized at $0.01 par value. The table below sets forth additional information pertaining to our preferred shares (dollars in thousands, except per share data):
Series
|
# of Shares Issued |
Aggregate Liquidation Preference |
Month of Issuance |
Annual Dividend Yield |
Annual Dividend Per Share |
Earliest Redemption Date |
||||||||||||
|---|---|---|---|---|---|---|---|---|---|---|---|---|---|---|---|---|---|---|
Series G |
2,200,000 | $ | 55,000 | August 2003 | 8.000 | % | $ | 2.00000 | 8/11/2008 | |||||||||
Series H |
2,000,000 | 50,000 | December 2003 | 7.500 | % | $ | 1.87500 | 12/18/2008 | ||||||||||
Series J |
3,390,000 | 84,750 | July 2006 | 7.625 | % | $ | 1.90625 | 7/20/2011 | ||||||||||
Series K |
531,667 | 26,583 | January 2007 | 5.600 | % | $ | 2.80000 | 1/9/2017 | ||||||||||
|
8,121,667 | $ | 216,333 | |||||||||||||||
Each series of preferred shares is nonvoting and redeemable for cash in the amount of its liquidation preference at our option on or after the earliest redemption date. The Series K Cumulative Redeemable Preferred Shares are also convertible, subject to certain conditions, into common shares on the basis of 0.8163 common shares for each preferred share. Holders of all preferred shares are entitled to cumulative dividends, payable quarterly (as and if declared by our Board of Trustees). In the case of each series of preferred shares, there is a series of preferred units in the Operating Partnership owned by us that carries substantially the same terms.
Common Shares
During 2010 and 2011, we completed the following public offerings of common shares:
Holders of common units in our Operating Partnership converted their units into common shares on the basis of one common share for each common unit in the amount of 100,939 in 2011, 663,498 in 2010 and 2,841,394 in 2009.
We declared dividends per common share of $1.65 in 2011, $1.61 in 2010 and $1.53 in 2009.
See Note 14 for disclosure of common share activity pertaining to our share-based compensation plans.
F-38
Corporate Office Properties Trust and Subsidiaries
Notes to Consolidated Financial Statements (Continued)
12. Shareholders' Equity (Continued)
Accumulated Other Comprehensive Loss
The table below sets forth activity in the accumulated other comprehensive loss component of shareholders' equity (in thousands):
| |
For the Years Ended December 31, | |||||||||
|---|---|---|---|---|---|---|---|---|---|---|
| |
2011 | 2010 | 2009 | |||||||
Beginning balance |
$ | (4,163 | ) | $ | (1,907 | ) | $ | (4,749 | ) | |
Amount of loss recognized in AOCL (effective portion) |
(31,531 | ) | (5,473 | ) | (3,253 | ) | ||||
Amount of loss reclassified from AOCL to income (effective portion) |
4,601 | 3,689 | 6,680 | |||||||
Amount of loss reclassified from AOCL to loss on interest rate derivatives upon discontinuing hedge accounting |
28,430 | — | — | |||||||
Adjustment to AOCL attributable to noncontrolling interests |
930 | (472 | ) | (585 | ) | |||||
Ending balance |
$ | (1,733 | ) | $ | (4,163 | ) | $ | (1,907 | ) | |
The table below sets forth total comprehensive (loss) income and total comprehensive (loss) income attributable to COPT (in thousands):
| |
For the Years Ended December 31, | |||||||||
|---|---|---|---|---|---|---|---|---|---|---|
| |
2011 | 2010 | 2009 | |||||||
Net (loss) income |
$ | (124,318 | ) | $ | 45,504 | $ | 61,299 | |||
Amount of loss recognized in AOCL |
(31,531 | ) | (5,473 | ) | (3,253 | ) | ||||
Amount of loss reclassified from AOCL to income |
4,601 | 3,689 | 6,680 | |||||||
Amount of loss reclassified from AOCL to loss on interest rate derivatives upon discontinuing hedge accounting |
28,430 | — | — | |||||||
Total comprehensive (loss) income |
(122,818 | ) | 43,720 | 64,726 | ||||||
Net loss (income) attributable to noncontrolling interests |
6,643 | (2,744 | ) | (4,970 | ) | |||||
Other comprehensive (income) loss attributable to noncontrolling interests |
(16 | ) | 153 | (349 | ) | |||||
Total comprehensive (loss) income attributable to COPT |
$ | (116,191 | ) | $ | 41,129 | $ | 59,407 | |||
13. Noncontrolling Interests
As discussed previously, we consolidate the accounts of our Operating Partnership and its subsidiaries into our financial statements. However, we do not own 100% of the Operating Partnership. We also do not own 100% of certain consolidated entities. The amounts reported for noncontrolling interests on our consolidated balance sheets represent the portion of these consolidated entities' equity that we do not own. The amounts reported for noncontrolling interests on our consolidated statements of operations represent the portion of these entities' net income not allocated to us.
Common units of the Operating Partnership are substantially similar economically to our common shares. Common units not owned by us are also exchangeable into our common shares, subject to certain conditions.
F-39
Corporate Office Properties Trust and Subsidiaries
Notes to Consolidated Financial Statements (Continued)
13. Noncontrolling Interests (Continued)
The Operating Partnership has 352,000 Series I Preferred Units issued to an unrelated party that have an aggregate liquidation preference of $8.8 million ($25.00 per unit), plus any accrued and unpaid distributions of return thereon (as described below), and may be redeemed for cash by the Operating Partnership at our option any time after September 22, 2019. The owner of these units is entitled to a priority annual cumulative return equal to 7.5% of their liquidation preference through September 22, 2019; the annual cumulative preferred return increases for each subsequent five-year period, subject to certain maximum limits. These units are convertible into common units on the basis of 0.5 common units for each Series I Preferred Unit; the resulting common units would then be exchangeable for common shares in accordance with the terms of the Operating Partnership's agreement of limited partnership.
14. Share-Based Compensation and Employee Benefit Plans
Share-Based Compensation Plans
On May 13, 2010, we adopted the Amended and Restated 2008 Omnibus Equity and Incentive Plan. We may issue equity-based awards under this plan to officers, employees, non-employee trustees and any other key persons of us and our subsidiaries, as defined in the plan. The plan provides for a maximum of 5,900,000 common shares of beneficial interest to be issued in the form of options, share appreciation rights, deferred share awards, restricted share awards, unrestricted share awards, performance shares, dividend equivalent rights and other equity-based awards and for the granting of cash-based awards. The plan expires on May 13, 2020.
In March 1998, we adopted a long-term incentive plan for our Trustees and employees. This plan, which expired in March 2008, provided for the award of options, restricted shares and dividend equivalents.
Grants of restricted shares and options under these plans to nonemployee Trustees generally vest on the first anniversary of the grant date provided that the Trustee remains in his or her position. Restricted shares and options granted to employees vest based on increments and over periods of time set forth under the terms of the respective awards provided that the employees remain employed by us. Options expire ten years after the date of grant. Shares for each of our share-based compensation plans are issued under registration statements on Form S-8 that became effective upon filing with the Securities and Exchange Commission.
F-40
Corporate Office Properties Trust and Subsidiaries
Notes to Consolidated Financial Statements (Continued)
14. Share-Based Compensation and Employee Benefit Plans (Continued)
The following table summarizes restricted share transactions under our share-based compensation plans for 2009, 2010 and 2011:
| |
Shares | Weighted Average Grant Date Fair Value |
|||||
|---|---|---|---|---|---|---|---|
Unvested at December 31, 2008 |
562,428 | $ | 35.69 | ||||
Granted |
340,660 | 25.30 | |||||
Forfeited |
(5,081 | ) | 29.83 | ||||
Vested |
(229,017 | ) | 35.74 | ||||
Unvested at December 31, 2009 |
668,990 | 30.43 | |||||
Granted |
290,956 | 37.74 | |||||
Forfeited |
(13,986 | ) | 34.38 | ||||
Vested |
(276,102 | ) | 32.24 | ||||
Unvested at December 31, 2010 |
669,858 | 32.77 | |||||
Granted |
320,284 | 33.68 | |||||
Forfeited |
(18,058 | ) | 34.23 | ||||
Vested |
(323,706 | ) | 32.86 | ||||
Unvested at December 31, 2011 |
648,378 | $ | 33.13 | ||||
Restricted shares expected to vest |
631,169 | $ | 33.13 | ||||
The aggregate intrinsic value of restricted shares that vested was $11.2 million in 2011, $10.3 million in 2010 and $5.9 million in 2009.
Our Board of Trustees made the following grants of Performance Share Units ("PSUs") to executives:
The PSUs have a performance period beginning on the respective grant dates and concluding the earlier of three years from the respective grant dates or the date of: (1) termination by the Company without cause, death or disability of the executive or constructive discharge of the executive (collectively, "qualified termination"); or (2) a sale event. The number of PSUs earned ("earned PSUs") at the end of the respective performance periods will be determined based on the percentile
F-41
Corporate Office Properties Trust and Subsidiaries
Notes to Consolidated Financial Statements (Continued)
14. Share-Based Compensation and Employee Benefit Plans (Continued)
rank of the Company's total shareholder return relative to a peer group of companies, as set forth in the following schedule:
Percentile Rank
|
Earned PSUs Payout % | |
|---|---|---|
75th or greater |
200% of PSUs granted | |
50th or greater |
100% of PSUs granted | |
25th |
50% of PSUs granted | |
Below 25th |
0% of PSUs granted |
If the percentile rank exceeds the 25th percentile and is between two of the percentile ranks set forth in the table above, then the percentage of the earned PSUs will be interpolated between the ranges set forth in the table above to reflect any performance between the listed percentiles. At the end of the respective performance periods, we, in settlement of the award, will issue a number of fully-vested common shares equal to the sum of:
If a performance period ends due to a sale event or qualified termination, the number of earned PSUs is prorated based on the portion of the three-year performance period that has elapsed. If employment is terminated by the employee or by the Company for cause, all PSUs are forfeited. PSUs do not carry voting rights.
We computed grant date fair values for PSUs using Monte Carlo models and are recognizing these values over three-year periods that commenced on the respective grant dates. The grant date fair value and certain of the assumptions used in the Monte Carlo models for PSUs granted in 2010 and 2011 are set forth below:
| |
For the Years Ended December 31, |
||||||
|---|---|---|---|---|---|---|---|
| |
2011 | 2010 | |||||
Grant date fair value |
$ | 49.15 | $ | 53.31 | |||
Baseline common share value |
$ | 35.17 | $ | 37.84 | |||
Expected volatility of common shares |
61.1 | % | 62.2 | % | |||
Risk-free interest rate |
1.32 | % | 1.38 | % | |||
F-42
Corporate Office Properties Trust and Subsidiaries
Notes to Consolidated Financial Statements (Continued)
14. Share-Based Compensation and Employee Benefit Plans (Continued)
The following table summarizes option transactions under our share-based compensation plans for 2009, 2010 and 2011 (dollars in thousands, except per share data):
| |
Shares | Range of Exercise Price per Share |
Weighted Average Exercise Price per Share |
Weighted Average Remaining Contractual Term (in Years) |
Aggregate Intrinsic Value |
||||||||||
|---|---|---|---|---|---|---|---|---|---|---|---|---|---|---|---|
Outstanding at December 31, 2008 |
1,949,319 | $7.38 - $57.00 | $ | 25.96 | 5 | $ | 18,744 | ||||||||
Granted—2009 |
50,000 | $29.98 - $37.61 | $ | 31.51 | |||||||||||
Forfeited/Expired—2009 |
(32,812 | ) | $25.52 - $53.16 | $ | 44.33 | ||||||||||
Exercised—2009 |
(464,601 | ) | $7.38 - $35.87 | $ | 11.25 | ||||||||||
Outstanding at December 31, 2009 |
1,501,906 | $8.63 - $57.00 | $ | 30.29 | 5 | $ | 14,579 | ||||||||
Forfeited/Expired—2010 |
(34,966 | ) | $41.33 - $49.60 | $ | 46.59 | ||||||||||
Exercised—2010 |
(278,656 | ) | $8.63 - $42.07 | $ | 16.42 | ||||||||||
Outstanding at December 31, 2010 |
1,188,284 | $9.54 - $57.00 | $ | 33.07 | 5 | $ | 7,987 | ||||||||
Forfeited/Expired—2011 |
(51,598 | ) | $22.49 - $50.59 | $ | 42.82 | ||||||||||
Exercised—2011 |
(191,264 | ) | $9.54 - $30.25 | $ | 12.82 | ||||||||||
Outstanding at December 31, 2011 |
945,422 | $13.40 - $57.00 | $ | 36.63 | 4 | $ | 510 | ||||||||
Exercisable at December 31, 2009 |
1,389,141 | (1) | $ | 29.42 | |||||||||||
Exercisable at December 31, 2010 |
1,188,284 | (2) | $ | 33.07 | |||||||||||
Exercisable at December 31, 2011 |
945,422 | (3) | $ | 36.63 | |||||||||||
The aggregate intrinsic value of options exercised was $4.0 million in 2011, $5.9 million in 2010 and $10.4 million in 2009.
F-43
Corporate Office Properties Trust and Subsidiaries
Notes to Consolidated Financial Statements (Continued)
14. Share-Based Compensation and Employee Benefit Plans (Continued)
We computed share-based compensation expense for options under the fair value method using the Black-Scholes option-pricing model; the weighted average assumptions we used in that model for options granted in 2009 are set forth below:
Weighted average fair value of grants on grant date |
$ | 10.15 | ||
Risk-free interest rate(1) |
2.20 | % | ||
Expected life-years |
5.32 | |||
Expected volatility(2) |
47.71 | % | ||
Expected dividend yield(3) |
3.77 | % |
We own a taxable REIT subsidiary that is subject to Federal and state income taxes. We realized a windfall tax benefit of $47,000 in 2011 and windfall tax shortfall of $152,000 in 2009 on options exercised and vesting restricted shares in connection with employees of our subsidiaries that are subject to income tax.
The table below sets forth our reporting for share based compensation expense (in thousands):
| |
For the Years Ended December 31, | |||||||||
|---|---|---|---|---|---|---|---|---|---|---|
| |
2011 | 2010 | 2009 | |||||||
General and administrative expenses |
$ | 9,077 | $ | 7,511 | $ | 5,964 | ||||
Property operating expenses |
2,843 | 2,543 | 3,172 | |||||||
Capitalized to development activities |
2,347 | 1,791 | 1,466 | |||||||
Share-based compensation expense |
$ | 14,267 | $ | 11,845 | $ | 10,602 | ||||
The amounts included in our consolidated statements of operations for share-based compensation reflected an estimate of pre-vesting forfeitures of: 0% for PSUs and 0% to 4% for restricted shares for 2011 and 2010; and 0% for options and 2% to 5% for restricted shares for 2009.
As of December 31, 2011, all of our options are vested and fully expensed. As of December 31, 2011, there was $12.5 million of unrecognized compensation cost related to unvested restricted shares that is expected to be recognized over a weighted average period of approximately two years. As of December 31, 2011, there was $2.9 million of unrecognized compensation cost related to PSUs that is expected to be recognized over a weighted average performance period of approximately two years.
401(k) Plan
We have a 401(k) defined contribution plan covering substantially all of our employees that permits participants to contribute up to 90% of their compensation, as defined in the Plan, per pay period on a before-tax basis or after-tax basis, or a combination of both, subject to limitations under the Internal Revenue Code of 1986 (the "IRC"), as amended. Participants who are 50 years of age or older by the end of a particular plan year and have contributed the maximum 401(k) deferral amount allowed under the plan for that year are eligible to contribute an additional portion of their annual
F-44
Corporate Office Properties Trust and Subsidiaries
Notes to Consolidated Financial Statements (Continued)
14. Share-Based Compensation and Employee Benefit Plans (Continued)
compensation on a before-tax basis as catch-up contributions, up to the annual limit under the IRC. We match 100% of the first 1% of pre-tax and/or after-tax contributions that participants contribute to the plan and 50% of the next 5% in participant contributions to the plan (representing an aggregate match by us of 3.5% on the first 6% of participant pre-tax and/or after-tax contributions to the plan). Participants' contributions are fully vested. Participants are 50% vested in Company matching contributions after one year of credited service and 100% vested after two years of credited service. We fund all contributions with cash. Our matching contributions under the plan totaled approximately $1.1 million in 2011, $1.0 million in 2010 and $969,000 in 2009. The 401(k) plan is fully funded at December 31, 2011.
Deferred Compensation Plan
We have a non-qualified elective deferred compensation plan for certain members of our management team that permits participants to defer up to 100% of their compensation on a pre-tax basis and receive a tax-deferred return on such deferrals. Deferred compensation related to an employee contribution is charged to expense and is fully vested. The balance of the plan, which was fully funded, totaled $7.6 million at December 31, 2011 and $8.2 million at December 31, 2010, and is included in the accompanying consolidated balance sheets.
15. Operating Leases
We lease our properties to tenants under operating leases with various expiration dates extending to the year 2025. Gross minimum future rentals on noncancelable leases in our properties at December 31, 2011 were as follows (in thousands):
Year Ending December 31,
|
|
|||
|---|---|---|---|---|
2012 |
$ | 377,917 | ||
2013 |
335,816 | |||
2014 |
291,088 | |||
2015 |
237,279 | |||
2016 |
180,345 | |||
Thereafter |
502,663 | |||
|
$ | 1,925,108 | ||
F-45
Corporate Office Properties Trust and Subsidiaries
Notes to Consolidated Financial Statements (Continued)
16. Information by Business Segment
As of December 31, 2011, we had nine primary office property segments (comprised of: the Baltimore/Washington Corridor; Northern Virginia; San Antonio, Washington, DC—Capitol Riverfront; St. Mary's & King George Counties; Greater Baltimore; Suburban Maryland; Colorado Springs; and Greater Philadelphia;). We also had a wholesale data center segment.
The table below reports segment financial information for our real estate operations (in thousands). Our segment entitled "Other" includes assets and operations not specifically associated with the other defined segments, including certain properties as well as corporate assets and investments in unconsolidated entities. We measure the performance of our segments through a measure we define as net operating income from real estate operations ("NOI from real estate operations"), which is derived by subtracting property operating expenses from revenues from real estate operations. We believe that NOI from real estate operations is an important supplemental measure of operating performance for a REIT's operating real estate because it provides a measure of the core operations that is unaffected by depreciation, amortization, impairment losses, financing and general and administrative expenses; this measure is particularly useful in our opinion in evaluating the performance of geographic segments, same-office property groupings and individual properties.
| |
Baltimore/ Washington Corridor |
Northern Virginia |
San Antonio |
Washington, DC—Capitol Riverfront |
St. Mary's & King George Counties |
Greater Baltimore |
Suburban Maryland |
Colorado Springs |
Greater Philadelphia |
Wholesale Data Center |
Other | Total | |||||||||||||||||||||||||
|---|---|---|---|---|---|---|---|---|---|---|---|---|---|---|---|---|---|---|---|---|---|---|---|---|---|---|---|---|---|---|---|---|---|---|---|---|---|
Year Ended December 31, 2011 |
|||||||||||||||||||||||||||||||||||||
Revenues from real estate operations |
$ | 218,051 | $ | 74,214 | $ | 30,066 | $ | 17,878 | $ | 14,366 | $ | 70,668 | $ | 21,982 | $ | 23,860 | $ | 7,458 | $ | 5,054 | $ | 12,235 | $ | 495,832 | |||||||||||||
Property operating expenses |
81,859 | 29,644 | 14,864 | 6,888 | 4,320 | 30,597 | 9,517 | 9,822 | 1,814 | 3,489 | 3,202 | 196,016 | |||||||||||||||||||||||||
NOI from real estate operations |
$ | 136,192 | $ | 44,570 | $ | 15,202 | $ | 10,990 | $ | 10,046 | $ | 40,071 | $ | 12,465 | $ | 14,038 | $ | 5,644 | $ | 1,565 | $ | 9,033 | $ | 299,816 | |||||||||||||
Additions to properties, net |
$ | 79,580 | $ | 54,565 | $ | 6,040 | $ | 2,156 | $ | 12,293 | $ | 28,703 | $ | 12,365 | $ | 4,108 | $ | 17,250 | $ | 67,909 | $ | 45,997 | $ | 330,966 | |||||||||||||
Segment assets at December 31, 2011 |
$ | 1,401,082 | $ | 583,695 | $ | 161,419 | $ | 108,366 | $ | 105,599 | $ | 506,415 | $ | 173,749 | $ | 208,316 | $ | 138,623 | $ | 196,881 | $ | 283,379 | $ | 3,867,524 | |||||||||||||
Year Ended December 31, 2010 |
|||||||||||||||||||||||||||||||||||||
Revenues from real estate operations |
$ | 207,456 | $ | 75,063 | $ | 21,673 | $ | 4,678 | $ | 13,967 | $ | 71,850 | $ | 21,759 | $ | 24,897 | $ | 6,299 | $ | 1,062 | $ | 13,024 | $ | 461,728 | |||||||||||||
Property operating expenses |
77,340 | 28,115 | 10,447 | 1,758 | 4,340 | 31,491 | 9,657 | 9,137 | 2,274 | 1,202 | 4,002 | 179,763 | |||||||||||||||||||||||||
NOI from real estate operations |
$ | 130,116 | $ | 46,948 | $ | 11,226 | $ | 2,920 | $ | 9,627 | $ | 40,359 | $ | 12,102 | $ | 15,760 | $ | 4,025 | $ | (140 | ) | $ | 9,022 | $ | 281,965 | ||||||||||||
Additions to properties, net |
$ | 90,054 | $ | 108,438 | $ | 19,064 | $ | 92,811 | $ | 7,090 | $ | 38,586 | $ | 4,434 | $ | 3,499 | $ | 20,714 | $ | 125,636 | $ | 15,084 | $ | 525,410 | |||||||||||||
Segment assets at December 31, 2010 |
$ | 1,392,524 | $ | 545,560 | $ | 154,787 | $ | 120,492 | $ | 99,412 | $ | 585,001 | $ | 176,776 | $ | 265,119 | $ | 122,734 | $ | 129,815 | $ | 252,297 | $ | 3,844,517 | |||||||||||||
Year Ended December 31, 2009 |
|||||||||||||||||||||||||||||||||||||
Revenues from real estate operations |
$ | 197,610 | $ | 79,132 | $ | 13,566 | $ | — | $ | 13,960 | $ | 58,275 | $ | 19,620 | $ | 23,125 | $ | 7,983 | $ | — | $ | 13,584 | $ | 426,855 | |||||||||||||
Property operating expenses |
72,902 | 30,111 | 4,479 | — | 3,491 | 25,560 | 8,393 | 7,391 | 1,271 | — | 3,808 | 157,406 | |||||||||||||||||||||||||
NOI from real estate operations |
$ | 124,708 | $ | 49,021 | $ | 9,087 | $ | — | $ | 10,469 | $ | 32,715 | $ | 11,227 | $ | 15,734 | $ | 6,712 | $ | — | $ | 9,776 | $ | 269,449 | |||||||||||||
Additions to properties, net |
$ | 98,437 | $ | 7,673 | $ | 38,353 | $ | — | $ | 2,200 | $ | 124,637 | $ | 24,022 | $ | 22,593 | $ | 9,126 | $ | — | $ | 3,960 | $ | 331,001 | |||||||||||||
Segment assets at December 31, 2009 |
$ | 1,332,579 | $ | 451,965 | $ | 134,986 | $ | — | $ | 94,732 | $ | 569,590 | $ | 179,453 | $ | 270,358 | $ | 105,372 | $ | — | $ | 240,987 | $ | 3,380,022 | |||||||||||||
F-46
Corporate Office Properties Trust and Subsidiaries
Notes to Consolidated Financial Statements (Continued)
16. Information by Business Segment (Continued)
The following table reconciles our segment revenues from real estate operations to total revenues as reported on our consolidated statements of operations (in thousands):
| |
For the Years Ended December 31, | |||||||||
|---|---|---|---|---|---|---|---|---|---|---|
| |
2011 | 2010 | 2009 | |||||||
Segment revenues from real estate operations |
$ | 495,832 | $ | 461,728 | $ | 426,855 | ||||
Construction contract and other service revenues |
84,345 | 104,675 | 343,087 | |||||||
Less: Revenues from discontinued operations (Note 18) |
(23,336 | ) | (28,805 | ) | (32,314 | ) | ||||
Total revenues |
$ | 556,841 | $ | 537,598 | $ | 737,628 | ||||
The following table reconciles our segment property operating expenses to property operating expenses as reported on our consolidated statements of operations (in thousands):
| |
For the Years Ended December 31, | |||||||||
|---|---|---|---|---|---|---|---|---|---|---|
| |
2011 | 2010 | 2009 | |||||||
Segment property operating expenses |
$ | 196,016 | $ | 179,763 | $ | 157,406 | ||||
Less: Property operating expenses from discontinued operations (Note 18) |
(9,183 | ) | (10,438 | ) | (11,433 | ) | ||||
Total property operating expenses |
$ | 186,833 | $ | 169,325 | $ | 145,973 | ||||
As previously discussed, we provide real estate services such as property management and construction and development services primarily for our properties but also for third parties. The primary manner in which we evaluate the operating performance of our service activities is through a measure we define as net operating income from service operations ("NOI from service operations"), which is based on the net of the revenues and expenses from these activities. Construction contract and other service revenues and expenses consist primarily of subcontracted costs that are reimbursed to us by the customer along with a management fee. The operating margins from these activities are small relative to the revenue. We believe NOI from service operations is a useful measure in assessing both our level of activity and our profitability in conducting such operations. The table below sets forth the computation of our NOI from service operations (in thousands):
| |
For the Years Ended December 31, | |||||||||
|---|---|---|---|---|---|---|---|---|---|---|
| |
2011 | 2010 | 2009 | |||||||
Construction contract and other service revenues |
$ | 84,345 | $ | 104,675 | $ | 343,087 | ||||
Construction contract and other service expenses |
(81,639 | ) | (102,302 | ) | (336,519 | ) | ||||
NOI from service operations |
$ | 2,706 | $ | 2,373 | $ | 6,568 | ||||
F-47
Corporate Office Properties Trust and Subsidiaries
Notes to Consolidated Financial Statements (Continued)
16. Information by Business Segment (Continued)
The following table reconciles our NOI from real estate operations for reportable segments and NOI from service operations to (loss) income from continuing operations as reported on our consolidated statements of operations (in thousands):
| |
For the Years Ended December 31, | |||||||||
|---|---|---|---|---|---|---|---|---|---|---|
| |
2011 | 2010 | 2009 | |||||||
NOI from real estate operations |
$ | 299,816 | $ | 281,965 | $ | 269,449 | ||||
NOI from service operations |
2,706 | 2,373 | 6,568 | |||||||
Interest and other income |
5,603 | 9,568 | 5,164 | |||||||
Equity in (loss) income of unconsolidated entities |
(331 | ) | 1,376 | (941 | ) | |||||
Income tax benefit (expense) |
10,679 | (108 | ) | (196 | ) | |||||
Other adjustments: |
||||||||||
Depreciation and amortization associated with real estate operations |
(127,444 | ) | (113,234 | ) | (97,869 | ) | ||||
Impairment losses |
(127,765 | ) | — | — | ||||||
General and administrative expenses |
(25,843 | ) | (24,008 | ) | (23,240 | ) | ||||
Business development expenses |
(3,195 | ) | (4,197 | ) | (3,699 | ) | ||||
Interest expense on continuing operations |
(101,281 | ) | (98,748 | ) | (79,789 | ) | ||||
NOI from discontinued operations |
(14,153 | ) | (18,367 | ) | (20,881 | ) | ||||
Loss on interest rate derivatives |
(29,805 | ) | — | — | ||||||
Loss on early extinguishment of debt |
(1,683 | ) | — | — | ||||||
(Loss) income from continuing operations |
$ | (112,696 | ) | $ | 36,620 | $ | 54,566 | |||
The accounting policies of the segments are the same as those used to prepare our consolidated financial statements, except that discontinued operations are not presented separately for segment purposes. We did not allocate interest expense, depreciation and amortization and impairment losses to our real estate segments since they are not included in the measure of segment profit reviewed by management. We also did not allocate general and administrative expenses, business development expenses, interest and other income, equity in (loss) income of unconsolidated entities, income taxes, loss on early extinguishment of debt, loss on interest rate derivatives and noncontrolling interests because these items represent general corporate items not attributable to segments.
17. Income Taxes
We elected to be treated as a REIT under Sections 856 through 860 of the Internal Revenue Code. To qualify as a REIT, we must meet a number of organizational and operational requirements, including a requirement that we distribute at least 90% of our adjusted taxable income to our shareholders. As a REIT, we generally will not be subject to Federal income tax on taxable income that we distribute to our shareholders. If we fail to qualify as a REIT in any tax year, we will be subject to Federal income tax on our taxable income at regular corporate rates and may not be able to qualify as a REIT for four subsequent tax years.
F-48
Corporate Office Properties Trust and Subsidiaries
Notes to Consolidated Financial Statements (Continued)
17. Income Taxes (Continued)
The differences between taxable income reported on our income tax return (estimated 2011 and actual 2010 and 2009) and net income as reported on our consolidated statements of operations are set forth below (in thousands):
| |
For the Years Ended December 31, | |||||||||
|---|---|---|---|---|---|---|---|---|---|---|
| |
2011 | 2010 | 2009 | |||||||
| |
(Estimated) |
|
|
|||||||
Net (loss) income |
$ | (124,318 | ) | $ | 45,504 | $ | 61,299 | |||
Adjustments: |
||||||||||
Rental revenue recognition |
(10,708 | ) | (9,192 | ) | (1,646 | ) | ||||
Compensation expense recognition |
(1,298 | ) | (4,820 | ) | (5,240 | ) | ||||
Operating expense recognition |
751 | 280 | 1,061 | |||||||
Gain on sales of properties |
1,154 | 6,548 | — | |||||||
Impairment losses |
151,021 | — | — | |||||||
Loss on interest rate derivatives |
29,805 | — | — | |||||||
Gains from non-real estate investments |
4,447 | (6,994 | ) | (1,029 | ) | |||||
Income from service operations |
(16,047 | ) | (1,628 | ) | 303 | |||||
Income tax expense |
10,679 | 119 | 196 | |||||||
Depreciation and amortization |
44,070 | 42,365 | 36,031 | |||||||
Discounts/premiums included in interest expense |
5,540 | 5,841 | 3,412 | |||||||
Income from unconsolidated entities |
(374 | ) | (244 | ) | (12 | ) | ||||
Noncontrolling interests, gross |
(4,891 | ) | (3,288 | ) | (5,813 | ) | ||||
Other |
88 | 2,173 | (1,947 | ) | ||||||
Taxable income |
$ | 89,919 | $ | 76,664 | $ | 86,615 | ||||
For Federal income tax purposes, dividends to shareholders may be characterized as ordinary income, capital gains or return of capital. The characterization of dividends declared on our common and preferred shares during each of the last three years was as follows:
| |
Common Shares | Preferred Shares | |||||||||||||||||
|---|---|---|---|---|---|---|---|---|---|---|---|---|---|---|---|---|---|---|---|
| |
For the Years Ended December 31, |
For the Years Ended December 31, |
|||||||||||||||||
| |
2011 | 2010 | 2009 | 2011 | 2010 | 2009 | |||||||||||||
Ordinary income |
56.9 | % | 59.7 | % | 87.5 | % | 85.9 | % | 88.3 | % | 100.0 | % | |||||||
Long term capital gain |
9.4 | % | 8.0 | % | 0.0 | % | 14.1 | % | 11.7 | % | 0.0 | % | |||||||
Return of capital |
33.7 | % | 32.3 | % | 12.5 | % | 0.0 | % | 0.0 | % | 0.0 | % | |||||||
We distributed all of our REIT taxable income in 2011, 2010 and 2009 and, as a result, did not incur Federal income tax in those years on such income.
The net basis of our assets and liabilities for tax reporting purposes is approximately $369 million lower than the amount reported on our consolidated balance sheet at December 31, 2011, which is primarily related to differences in basis for net properties, intangible assets on property acquisitions and deferred rent receivable.
F-49
Corporate Office Properties Trust and Subsidiaries
Notes to Consolidated Financial Statements (Continued)
17. Income Taxes (Continued)
We own a taxable REIT subsidiary ("TRS") that is subject to Federal and state income taxes. Our TRS had (loss) income before income taxes under GAAP of $(27.7) million in 2011, $345,000 in 2010 and $506,000 in 2009. Our TRS' provision for income tax consisted of the following (in thousands):
| |
For the Years Ended December 31, |
|||||||||
|---|---|---|---|---|---|---|---|---|---|---|
| |
2011 | 2010 | 2009 | |||||||
Deferred |
||||||||||
Federal |
$ | (8,760 | ) | $ | (64 | ) | $ | 115 | ||
State |
(1,938 | ) | (14 | ) | 25 | |||||
|
(10,698 | ) | (78 | ) | 140 | |||||
Current |
||||||||||
Federal |
16 | 161 | 46 | |||||||
State |
3 | 36 | 10 | |||||||
|
19 | 197 | 56 | |||||||
Total income tax (benefit) expense |
$ | (10,679 | ) | $ | 119 | $ | 196 | |||
Reported on line entitled income tax (benefit) expense |
$ | (10,679 | ) | $ | 108 | $ | 196 | |||
Reported on line entitled gain on sales of real estate, net |
— | 11 | — | |||||||
Total income tax (benefit) expense |
$ | (10,679 | ) | $ | 119 | $ | 196 | |||
A reconciliation of our TRS' Federal statutory rate to the effective tax rate for income tax reported on our statements of operations is set forth below:
| |
For the Years Ended December 31, |
|||||||||
|---|---|---|---|---|---|---|---|---|---|---|
| |
2011 | 2010 | 2009 | |||||||
Income taxes at U.S. statutory rate |
34.0 | % | 34.0 | % | 34.0 | % | ||||
State and local, net of U.S. Federal tax benefit |
4.6 | % | 4.2 | % | 4.6 | % | ||||
Other |
0.0 | % | (3.5 | )% | 0.1 | % | ||||
Effective tax rate |
38.6 | % | 34.7 | % | 38.7 | % | ||||
Items in our TRS contributing to temporary differences that lead to deferred taxes include depreciation and amortization, share-based compensation, certain accrued compensation, compensation paid in the form of contributions to a deferred nonqualified compensation plan, impairment losses and net operating losses that are not deductible until future periods.
We are subject to certain state and local income and franchise taxes. The expense associated with these state and local taxes is included in general and administrative expense and property operating expenses on our consolidated statements of operations. We did not separately state these amounts on our consolidated statements of operations because they are insignificant.
F-50
Corporate Office Properties Trust and Subsidiaries
Notes to Consolidated Financial Statements (Continued)
18. Discontinued Operations and Assets Held for Sale
Income from discontinued operations primarily includes revenues and expenses associated with the following properties:
Certain reclassifications have been made in prior periods to reflect discontinued operations consistent with the current period presentation. The table below sets forth the components of discontinued operations reported on our consolidated statements of operations (in thousands):
| |
For the Years Ended December 31, | |||||||||
|---|---|---|---|---|---|---|---|---|---|---|
| |
2011 | 2010 | 2009 | |||||||
Revenue from real estate operations |
$ | 23,336 | $ | 28,805 | $ | 32,314 | ||||
Property operating expenses |
(9,183 | ) | (10,438 | ) | (11,433 | ) | ||||
Depreciation and amortization |
(6,687 | ) | (10,009 | ) | (11,517 | ) | ||||
Impairment losses |
(23,256 | ) | — | — | ||||||
Interest expense |
(3,020 | ) | (3,380 | ) | (2,631 | ) | ||||
Loss on early extinguishment of debt |
(340 | ) | — | — | ||||||
Gain on sales of real estate |
4,807 | 1,077 | — | |||||||
Discontinued operations |
$ | (14,343 | ) | $ | 6,055 | $ | 6,733 | |||
F-51
Corporate Office Properties Trust and Subsidiaries
Notes to Consolidated Financial Statements (Continued)
18. Discontinued Operations and Assets Held for Sale (Continued)
The table below sets forth the components of assets held for sale on our consolidated balance sheets as of December 31, 2011 (in thousands):
Properties, net |
$ | 108,356 | ||
Deferred rent receivable |
2,800 | |||
Intangible assets on real estate acquisitions, net |
1,737 | |||
Deferred leasing costs, net |
3,723 | |||
Assets held for sale, net |
$ | 116,616 | ||
19. Earnings Per Share ("EPS")
We present both basic and diluted EPS. We compute basic EPS by dividing net income available to common shareholders allocable to unrestricted common shares under the two-class method by the weighted average number of unrestricted common shares outstanding during the year. Our computation of diluted EPS is similar except that:
F-52
Corporate Office Properties Trust and Subsidiaries
Notes to Consolidated Financial Statements (Continued)
19. Earnings Per Share ("EPS") (Continued)
Summaries of the numerator and denominator for purposes of basic and diluted EPS calculations are set forth below (in thousands, except per share data):
| |
For the Years Ended December 31, | |||||||||
|---|---|---|---|---|---|---|---|---|---|---|
| |
2011 | 2010 | 2009 | |||||||
Numerator: |
||||||||||
(Loss) income from continuing operations |
$ | (112,696 | ) | $ | 36,620 | $ | 54,566 | |||
Gain on sales of real estate, net |
2,721 | 2,829 | — | |||||||
Preferred share dividends |
(16,102 | ) | (16,102 | ) | (16,102 | ) | ||||
Loss (income) from continuing operations attributable to noncontrolling interests |
5,703 | (2,300 | ) | (4,322 | ) | |||||
Income from continuing operations attributable to restricted shares |
(1,037 | ) | (1,071 | ) | (1,010 | ) | ||||
Numerator for basic and diluted EPS from continuing operations attributable to COPT common shareholders |
$ | (121,411 | ) | $ | 19,976 | $ | 33,132 | |||
Discontinued operations |
(14,343 | ) | 6,055 | 6,733 | ||||||
Discontinued operations attributable to noncontrolling interests |
940 | (444 | ) | (648 | ) | |||||
Numerator for basic and diluted EPS on net (loss) income attributable to COPT common shareholders |
$ | (134,814 | ) | $ | 25,587 | $ | 39,217 | |||
Denominator (all weighted averages): |
||||||||||
Denominator for basic EPS (common shares) |
69,382 | 59,611 | 55,930 | |||||||
Dilutive effect of share-based compensation awards |
— | 333 | 477 | |||||||
Denominator for diluted EPS |
69,382 | 59,944 | 56,407 | |||||||
Basic EPS: |
||||||||||
(Loss) income from continuing operations attributable to COPT common shareholders |
$ | (1.75 | ) | $ | 0.34 | $ | 0.59 | |||
Discontinued operations attributable to COPT common shareholders |
(0.19 | ) | 0.09 | 0.11 | ||||||
Net (loss) income attributable to COPT common shareholders |
$ | (1.94 | ) | $ | 0.43 | $ | 0.70 | |||
Diluted EPS: |
||||||||||
(Loss) income from continuing operations attributable to COPT common shareholders |
$ | (1.75 | ) | $ | 0.34 | $ | 0.59 | |||
Discontinued operations attributable to COPT common shareholders |
(0.19 | ) | 0.09 | 0.11 | ||||||
Net (loss) income attributable to COPT common shareholders |
$ | (1.94 | ) | $ | 0.43 | $ | 0.70 | |||
F-53
Corporate Office Properties Trust and Subsidiaries
Notes to Consolidated Financial Statements (Continued)
19. Earnings Per Share ("EPS") (Continued)
Our diluted EPS computations do not include the effects of the following securities since the conversions of such securities would increase diluted EPS for the respective years (in thousands):
| |
Weighted Average Shares Excluded from Denominator for the Years Ended December 31, |
|||||||||
|---|---|---|---|---|---|---|---|---|---|---|
| |
2011 | 2010 | 2009 | |||||||
Conversion of common units |
4,355 | 4,608 | 5,717 | |||||||
Conversion of convertible preferred units |
176 | 176 | 176 | |||||||
Conversion of convertible preferred shares |
434 | 434 | 434 | |||||||
The following share-based compensation securities were excluded from the computation of diluted EPS because their effect was antidilutive:
As discussed in Note 10, we have outstanding senior notes that have an exchange settlement feature but did not affect our diluted EPS reported above since the weighted average closing price of our common shares during each of the years was less than the exchange prices per common share applicable for such years.
F-54
Corporate Office Properties Trust and Subsidiaries
Notes to Consolidated Financial Statements (Continued)
20. Quarterly Data (Unaudited)
The tables below set forth selected quarterly information for the years ended December 31, 2011 and 2010 (in thousands, except per share data). Certain of the amounts below have been reclassified to conform to the current period presentation of our consolidated financial statements.
| |
For the Year Ended December 31, 2011 | ||||||||||||
|---|---|---|---|---|---|---|---|---|---|---|---|---|---|
| |
First Quarter |
Second Quarter |
Third Quarter |
Fourth Quarter |
|||||||||
Revenues |
$ | 137,489 | $ | 142,833 | $ | 137,517 | $ | 139,002 | |||||
Operating income (loss) |
$ | 4,007 | $ | 12,836 | $ | 30,761 | $ | (43,482 | ) | ||||
(Loss) income from continuing operations |
$ | (20,366 | ) | $ | (5,524 | ) | $ | 4,283 | $ | (91,089 | ) | ||
Discontinued operations |
$ | (901 | ) | $ | (20,499 | ) | $ | 3,187 | $ | 3,870 | |||
Net (loss) income |
$ | (18,566 | ) | $ | (26,007 | ) | $ | 7,470 | $ | (87,215 | ) | ||
Net loss (income) attributable to noncontrolling interests |
776 | 1,783 | (904 | ) | 4,988 | ||||||||
Net (loss) income attributable to COPT |
(17,790 | ) | (24,224 | ) | 6,566 | (82,227 | ) | ||||||
Preferred share dividends |
(4,025 | ) | (4,026 | ) | (4,025 | ) | (4,026 | ) | |||||
Net (loss) income attributable to COPT common shareholders |
$ | (21,815 | ) | $ | (28,250 | ) | $ | 2,541 | $ | (86,253 | ) | ||
Basic earnings per share: |
|||||||||||||
Loss from continuing operations |
$ | (0.32 | ) | $ | (0.14 | ) | $ | (0.01 | ) | $ | (1.26 | ) | |
Net (loss) income attributable to COPT common shareholders |
$ | (0.33 | ) | $ | (0.42 | ) | $ | 0.03 | $ | (1.21 | ) | ||
Diluted earnings per share: |
|||||||||||||
Loss from continuing operations |
$ | (0.32 | ) | $ | (0.14 | ) | $ | (0.01 | ) | $ | (1.26 | ) | |
Net (loss) income attributable to COPT common shareholders |
$ | (0.33 | ) | $ | (0.42 | ) | $ | 0.03 | $ | (1.21 | ) | ||
F-55
Corporate Office Properties Trust and Subsidiaries
Notes to Consolidated Financial Statements (Continued)
20. Quarterly Data (Unaudited) (Continued)
| |
For the Year Ended December 31, 2010 | ||||||||||||
|---|---|---|---|---|---|---|---|---|---|---|---|---|---|
| |
First Quarter |
Second Quarter |
Third Quarter |
Fourth Quarter |
|||||||||
Revenues |
$ | 142,325 | $ | 129,163 | $ | 121,915 | $ | 144,195 | |||||
Operating income |
$ | 29,747 | $ | 32,718 | $ | 29,233 | $ | 32,834 | |||||
Income from continuing operations |
$ | 8,890 | $ | 7,891 | $ | 4,528 | $ | 15,311 | |||||
Discontinued operations |
$ | 1,768 | $ | 925 | $ | 1,921 | $ | 1,441 | |||||
Net income |
$ | 10,675 | $ | 9,151 | $ | 8,926 | $ | 16,752 | |||||
Net income attributable to noncontrolling interests |
(737 | ) | (685 | ) | (94 | ) | (1,228 | ) | |||||
Net income attributable to COPT |
9,938 | 8,466 | 8,832 | 15,524 | |||||||||
Preferred share dividends |
(4,025 | ) | (4,026 | ) | (4,025 | ) | (4,026 | ) | |||||
Net income attributable to COPT common shareholders |
$ | 5,913 | $ | 4,440 | $ | 4,807 | $ | 11,498 | |||||
Basic earnings per share: |
|||||||||||||
Income from continuing operations |
$ | 0.07 | $ | 0.06 | $ | 0.05 | $ | 0.16 | |||||
Net income attributable to COPT common shareholders |
$ | 0.10 | $ | 0.07 | $ | 0.08 | $ | 0.18 | |||||
Diluted earnings per share: |
|||||||||||||
Income from continuing operations |
$ | 0.07 | $ | 0.06 | $ | 0.05 | $ | 0.16 | |||||
Net income attributable to COPT common shareholders |
$ | 0.10 | $ | 0.07 | $ | 0.08 | $ | 0.18 | |||||
21. Commitments and Contingencies
Litigation
In the normal course of business, we are involved in legal actions arising from our ownership and administration of properties. We establish reserves for specific legal proceedings when we determine that the likelihood of an unfavorable outcome is probable and the amount of loss can be reasonably estimated. Management does not anticipate that any liabilities that may result from such proceedings will have a materially adverse effect on our financial position, operations or liquidity. Our assessment of the potential outcomes of these matters involves significant judgment and is subject to change based on future developments.
Environmental
We are subject to various Federal, state and local environmental regulations related to our property ownership and operation. We have performed environmental assessments of our properties, the results of which have not revealed any environmental liability that we believe would have a materially adverse effect on our financial position, operations or liquidity.
Joint Ventures
In connection with our 2005 contribution of properties to an unconsolidated partnership in which we hold a partnership interest, we entered into standard nonrecourse loan guarantees (environmental
F-56
Corporate Office Properties Trust and Subsidiaries
Notes to Consolidated Financial Statements (Continued)
21. Commitments and Contingencies (Continued)
indemnifications and guarantees against fraud and misrepresentation and springing guarantees of partnership debt in the event of a voluntary bankruptcy of the partnership). The maximum amount we could be required to pay under the guarantees is approximately $65 million. We are entitled to recover 20% of any amounts paid under the guarantees from an affiliate of our partner pursuant to an indemnity agreement so long as we continue to manage the properties. In the event that we no longer manage the properties, the percentage that we are entitled to recover is increased to 80%. Management estimates that the aggregate fair value of the guarantees is not material and would not exceed the amounts included in distributions received in excess of investment in unconsolidated real estate joint venture reported on the consolidated balance sheets.
We are party to a contribution agreement that formed a joint venture relationship with a limited partnership to develop up to 1.8 million square feet of office space on 63 acres of land located in Hanover, Maryland. As we and the joint venture partner agree to proceed with the construction of buildings in the future, our joint venture partner would contribute land into newly-formed entities and we would make cash capital contributions into such entities to fund development and construction activities for which financing is not obtained. We owned a 50% interest in one such joint venture as of December 31, 2011.
We may be required to make our pro rata share of additional investments in our real estate joint ventures (generally based on our percentage ownership) in the event that additional funds are needed. In the event that the other members of these joint ventures do not pay their share of investments when additional funds are needed, we may then deem it appropriate to make even larger investments in these joint ventures.
Tax Incremental Financing Obligation
In August 2010, Anne Arundel County, Maryland issued $30 million in tax incremental financing bonds to third-party investors in order to finance public improvements needed in connection with our project known as National Business Park North. The real estate taxes on increases in assessed value of a development district encompassing National Business Park North are to be transferred to a special fund pledged to the repayment of the bonds. We recognized a $4.4 million liability through December 31, 2011 representing the estimated fair value of our obligation to fund through a special tax any future shortfalls between debt service on the bonds and real estate taxes available to repay the bonds.
Ground Leases
We are obligated as lessee under two ground leases that expire in 2099 and 2100. Future minimum rental payments due under the terms of these leases, including future minimum rent increases effective
F-57
Corporate Office Properties Trust and Subsidiaries
Notes to Consolidated Financial Statements (Continued)
21. Commitments and Contingencies (Continued)
beginning in 2020 and 2021, respectively, and every ten years thereafter, as of December 31, 2011 follow (in thousands):
Year Ending December 31,
|
|
|||
|---|---|---|---|---|
2012 |
$ | 483 | ||
2013 |
483 | |||
2014 |
483 | |||
2015 |
483 | |||
2016 |
483 | |||
Thereafter |
61,789 | |||
|
$ | 64,204 | ||
Environmental Indemnity Agreement
We agreed to provide certain environmental indemnifications in connection with a lease and subsequent sale of three New Jersey properties. The prior owner of the properties, a Fortune 100 company that is responsible for groundwater contamination at such properties, previously agreed to indemnify us for (1) direct losses incurred in connection with the contamination and (2) its failure to perform remediation activities required by the State of New Jersey, up to the point that the state declares the remediation to be complete. Under the environmental indemnification agreement, we agreed to the following:
F-58
Corporate Office Properties Trust
Schedule III—Real Estate and Accumulated Depreciation
December 31, 2011
(Dollars in Thousands)
| |
|
|
Initial Cost | |
Gross Amounts Carried At Close of Period | |
|
|
||||||||||||||||||||||
|---|---|---|---|---|---|---|---|---|---|---|---|---|---|---|---|---|---|---|---|---|---|---|---|---|---|---|---|---|---|---|
| |
|
|
Costs Capitalized Subsequent to Acquisition |
|
|
|
||||||||||||||||||||||||
Property (Type)(1)
|
Location | Encumbrances(2) | Land | Building and Land Improvements |
Land | Building and Land Improvements |
Total(3)(4) | Accumulated Depreciation(5) |
Year Built or Renovated |
Date Acquired(6) |
||||||||||||||||||||
1000 Redstone Gateway (O) |
Huntsville, AL | $ | 5,632 | $ | — | $ | 14,142 | $ | — | $ | — | $ | 14,142 | $ | 14,142 | $ | — | (7) | 3/23/10 | |||||||||||
10150 York Road (O) |
Hunt Valley, MD | — | 2,700 | 11,623 | 5,564 | 2,700 | 17,187 | 19,887 | (6,440 | ) | 1985 | 4/15/04 | ||||||||||||||||||
10270 Old Columbia Road (O) |
Columbia, MD | 1,090 | 751 | 957 | 231 | 751 | 1,188 | 1,939 | (208 | ) | 1988/2001 | 1/9/07 | ||||||||||||||||||
10280 Old Columbia Road (O) |
Columbia, MD | 1,107 | 756 | 1,205 | 151 | 756 | 1,356 | 2,112 | (162 | ) | 1988/2001 | 1/9/07 | ||||||||||||||||||
10290 Old Columbia Road (O) |
Columbia, MD | 701 | 490 | 102 | 322 | 490 | 424 | 914 | (174 | ) | 1988/2001 | 1/9/07 | ||||||||||||||||||
1055 North Newport Road (O) |
Colorado Springs, CO | — | 972 | 9,523 | — | 972 | 9,523 | 10,495 | (956 | ) | 2007 - 2008 | 5/19/06 | ||||||||||||||||||
10807 New Allegiance Drive (O) |
Colorado Springs, CO | — | 1,840 | 14,924 | 71 | 1,840 | 14,995 | 16,835 | (1,280 | ) | 2009 | 9/28/05 | ||||||||||||||||||
1099 Winterson Road (O) |
Linthicum, MD | 12,012 | 1,323 | 5,293 | 2,281 | 1,323 | 7,574 | 8,897 | (3,012 | ) | 1988 | 4/30/98 | ||||||||||||||||||
110 Thomas Johnson Drive (O) |
Frederick, MD | — | 2,810 | 12,075 | 843 | 2,810 | 12,918 | 15,728 | (2,142 | ) | 1987/1999 | 10/21/05 | ||||||||||||||||||
1101 Sentry Gateway (O) |
San Antonio, TX | — | 1,178 | 10,269 | — | 1,178 | 10,269 | 11,447 | (43 | ) | 2011 | 7/16/08 | ||||||||||||||||||
11311 McCormick Road (O) |
Hunt Valley, MD | — | 2,308 | 21,310 | 7,132 | 2,308 | 28,442 | 30,750 | (6,023 | ) | 1984/1994 | 12/22/05 | ||||||||||||||||||
114 National Business Parkway (O) |
Annapolis Junction, MD | — | 364 | 3,109 | 9 | 364 | 3,118 | 3,482 | (800 | ) | 2002 | 6/30/00 | ||||||||||||||||||
11751 Meadowville Lane (O) |
Richmond, VA | — | 1,305 | 52,098 | 112 | 1,305 | 52,210 | 53,515 | (5,973 | ) | 2007 | 9/15/06 | ||||||||||||||||||
11800 Tech Road (O) |
Silver Spring, MD | 15,440 | 4,574 | 19,703 | 2,505 | 4,574 | 22,208 | 26,782 | (6,886 | ) | 1989 | 8/1/02 | ||||||||||||||||||
1190 Winterson Road (O) |
Linthicum, MD | 11,291 | 1,335 | 5,340 | 3,930 | 1,335 | 9,270 | 10,605 | (4,801 | ) | 1987 | 4/30/98 | ||||||||||||||||||
1199 Winterson Road (O) |
Linthicum, MD | 18,578 | 1,599 | 6,395 | 3,063 | 1,599 | 9,458 | 11,057 | (4,255 | ) | 1988 | 4/30/98 | ||||||||||||||||||
1201 M Street (O) |
Washington, DC | 37,479 | — | 49,785 | 1,262 | — | 51,047 | 51,047 | (2,336 | ) | 2001 | 9/28/10 | ||||||||||||||||||
1201 Winterson Road (O) |
Linthicum, MD | — | 1,288 | 5,154 | 460 | 1,288 | 5,614 | 6,902 | (1,907 | ) | 1985 | 4/30/98 | ||||||||||||||||||
1220 12th Street, SE (O) |
Washington, DC | 30,827 | — | 42,682 | 1,238 | — | 43,920 | 43,920 | (2,168 | ) | 2003 | 9/28/10 | ||||||||||||||||||
1243 Winterson Road (L) |
Linthicum, MD | — | 630 | — | — | 630 | — | 630 | — | (8) | 12/19/01 | |||||||||||||||||||
12515 Academy Ridge View (O) |
Colorado Springs, CO | — | 2,612 | 7,006 | — | 2,612 | 7,006 | 9,618 | (633 | ) | 2006 | 6/26/09 | ||||||||||||||||||
1302 Concourse Drive (O) |
Linthicum, MD | — | 2,078 | 8,313 | 2,633 | 2,078 | 10,946 | 13,024 | (4,239 | ) | 1996 | 11/18/99 | ||||||||||||||||||
1304 Concourse Drive (O) |
Linthicum, MD | 9,276 | 1,999 | 12,934 | 362 | 1,999 | 13,296 | 15,295 | (4,190 | ) | 2002 | 11/18/99 | ||||||||||||||||||
1306 Concourse Drive (O) |
Linthicum, MD | — | 2,796 | 11,186 | 1,932 | 2,796 | 13,118 | 15,914 | (4,540 | ) | 1990 | 11/18/99 | ||||||||||||||||||
131 National Business Parkway (O) |
Annapolis Junction, MD | 7,049 | 1,906 | 7,623 | 2,241 | 1,906 | 9,864 | 11,770 | (3,540 | ) | 1990 | 9/28/98 | ||||||||||||||||||
132 National Business Parkway (O) |
Annapolis Junction, MD | — | 2,917 | 12,259 | 2,359 | 2,917 | 14,618 | 17,535 | (5,970 | ) | 2000 | 5/28/99 | ||||||||||||||||||
13200 Woodland Park Road (O) |
Herndon, VA | — | 10,428 | 41,711 | 13,757 | 10,428 | 55,468 | 65,896 | (17,100 | ) | 2002 | 6/2/03 | ||||||||||||||||||
133 National Business Parkway (O) |
Annapolis Junction, MD | 9,432 | 2,517 | 10,068 | 4,202 | 2,517 | 14,270 | 16,787 | (5,503 | ) | 1997 | 9/28/98 | ||||||||||||||||||
1331 Ashton Road (O) |
Hanover, MD | — | 587 | 2,346 | 311 | 587 | 2,657 | 3,244 | (848 | ) | 1989 | 4/28/99 | ||||||||||||||||||
1334 Ashton Road (O) |
Hanover, MD | — | 736 | 2,446 | 2,319 | 736 | 4,765 | 5,501 | (1,820 | ) | 1989 | 4/28/99 | ||||||||||||||||||
134 National Business Parkway (O) |
Annapolis Junction, MD | 19,200 | 3,684 | 7,517 | 1,700 | 3,684 | 9,217 | 12,901 | (3,678 | ) | 1999 | 11/13/98 | ||||||||||||||||||
1340 Ashton Road (O) |
Hanover, MD | — | 905 | 3,619 | 1,040 | 905 | 4,659 | 5,564 | (1,755 | ) | 1989 | 4/28/99 | ||||||||||||||||||
1341 Ashton Road (O) |
Hanover, MD | — | 306 | 1,223 | 566 | 306 | 1,789 | 2,095 | (662 | ) | 1989 | 4/28/99 | ||||||||||||||||||
1343 Ashton Road (O) |
Hanover, MD | — | 193 | 774 | 405 | 193 | 1,179 | 1,372 | (355 | ) | 1989 | 4/28/99 | ||||||||||||||||||
13450 Sunrise Valley Road (O) |
Herndon, VA | — | 1,386 | 5,576 | 1,818 | 1,386 | 7,394 | 8,780 | (2,539 | ) | 1998 | 7/25/03 | ||||||||||||||||||
13454 Sunrise Valley Road (O) |
Herndon, VA | — | 2,899 | 11,986 | 3,162 | 2,899 | 15,148 | 18,047 | (3,940 | ) | 1998 | 7/25/03 | ||||||||||||||||||
F-59
| |
|
|
Initial Cost | |
Gross Amounts Carried At Close of Period | |
|
|
||||||||||||||||||||||||
|---|---|---|---|---|---|---|---|---|---|---|---|---|---|---|---|---|---|---|---|---|---|---|---|---|---|---|---|---|---|---|---|---|
| |
|
|
Costs Capitalized Subsequent to Acquisition |
|
|
|
||||||||||||||||||||||||||
Property (Type)(1)
|
Location | Encumbrances(2) | Land | Building and Land Improvements |
Land | Building and Land Improvements |
Total(3)(4) | Accumulated Depreciation(5) |
Year Built or Renovated |
Date Acquired(6) |
||||||||||||||||||||||
135 National Business Parkway (O) |
Annapolis Junction, MD | 10,105 | 2,484 | 9,750 | 1,634 | 2,484 | 11,384 | 13,868 | (4,611 | ) | 1998 | 12/30/98 | ||||||||||||||||||||
1362 Mellon Road (O) |
Hanover, MD | — | 1,706 | 8,404 | — | 1,706 | 8,404 | 10,110 | (636 | ) | 2006 | 2/10/06 | ||||||||||||||||||||
140 National Business Parkway (O) |
Annapolis Junction, MD | — | 3,407 | 24,167 | 631 | 3,407 | 24,798 | 28,205 | (5,064 | ) | 2003 | 12/31/03 | ||||||||||||||||||||
141 National Business Parkway (O) |
Annapolis Junction, MD | 9,902 | 2,398 | 9,590 | 1,755 | 2,398 | 11,345 | 13,743 | (4,043 | ) | 1990 | 9/28/98 | ||||||||||||||||||||
14280 Park Meadow Drive (O) |
Chantilly, VA | — | 3,731 | 15,953 | 798 | 3,731 | 16,751 | 20,482 | (4,033 | ) | 1999 | 9/29/04 | ||||||||||||||||||||
1460 Dorsey Road (L) |
Hanover, MD | — | 1,800 | — | — | 1,800 | — | 1,800 | — | (8) | 2/28/06 | |||||||||||||||||||||
14840 Conference Center Drive (O) |
Chantilly, VA | — | 1,572 | 8,175 | 37 | 1,572 | 8,212 | 9,784 | (3,223 | ) | 2000 | 7/25/03 | ||||||||||||||||||||
14850 Conference Center Drive (O) |
Chantilly, VA | — | 1,615 | 8,358 | 21 | 1,615 | 8,379 | 9,994 | (3,262 | ) | 2000 | 7/25/03 | ||||||||||||||||||||
14900 Conference Center Drive (O) |
Chantilly, VA | — | 3,436 | 14,402 | 3,192 | 3,436 | 17,594 | 21,030 | (5,049 | ) | 1999 | 7/25/03 | ||||||||||||||||||||
15 West Gude Drive (O) |
Rockville, MD | — | 3,120 | 16,150 | 3,642 | 3,120 | 19,792 | 22,912 | (3,519 | ) | 1986 | 4/7/05 | ||||||||||||||||||||
15000 Conference Center Drive (O) |
Chantilly, VA | 54,000 | 5,193 | 47,180 | 14,672 | 5,193 | 61,852 | 67,045 | (18,873 | ) | 1989 | 11/30/01 | ||||||||||||||||||||
1501 South Clinton Street (O) |
Baltimore, MD | — | 27,964 | 34,059 | 2,510 | 27,964 | 36,569 | 64,533 | (3,492 | ) | 2006 | 10/27/09 | ||||||||||||||||||||
15010 Conference Center Drive (O) |
Chantilly, VA | 96,000 | 3,500 | 41,921 | 167 | 3,500 | 42,088 | 45,588 | (5,447 | ) | 2006 | 11/30/01 | ||||||||||||||||||||
15049 Conference Center Drive (O) |
Chantilly, VA | — | 4,415 | 20,365 | 718 | 4,415 | 21,083 | 25,498 | (6,510 | ) | 1997 | 8/14/02 | ||||||||||||||||||||
15059 Conference Center Drive (O) |
Chantilly, VA | — | 5,753 | 13,615 | 1,030 | 5,753 | 14,645 | 20,398 | (4,456 | ) | 2000 | 8/14/02 | ||||||||||||||||||||
1550 West Nursery Road (O) |
Linthicum, MD | — | 14,071 | 16,930 | — | 14,071 | 16,930 | 31,001 | (1,274 | ) | 2009 | 10/28/09 | ||||||||||||||||||||
1550 Westbranch Drive (O) |
McLean, VA | — | 5,595 | 26,212 | 116 | 5,595 | 26,328 | 31,923 | (1,479 | ) | 2002 | 6/28/10 | ||||||||||||||||||||
1560A Cable Ranch Road (O) |
San Antonio, TX | — | 1,097 | 3,770 | 6 | 1,097 | 3,776 | 4,873 | (537 | ) | 1985/2007 | 6/19/08 | ||||||||||||||||||||
1560B Cable Ranch Road (O) |
San Antonio, TX | — | 2,299 | 6,545 | 11 | 2,299 | 6,556 | 8,855 | (910 | ) | 1985/2006 | 6/19/08 | ||||||||||||||||||||
16442 Commerce Drive (O) |
Dahlgren, VA | 2,352 | 613 | 2,582 | 538 | 613 | 3,120 | 3,733 | (571 | ) | 2002 | 12/21/04 | ||||||||||||||||||||
16480 Commerce Drive (O) |
Dahlgren, VA | — | 1,856 | 7,425 | 164 | 1,856 | 7,589 | 9,445 | (1,446 | ) | 2000 | 12/28/04 | ||||||||||||||||||||
16501 Commerce Drive (O) |
Dahlgren, VA | 1,923 | 522 | 2,090 | 176 | 522 | 2,266 | 2,788 | (527 | ) | 2002 | 12/21/04 | ||||||||||||||||||||
16539 Commerce Drive (O) |
Dahlgren, VA | — | 688 | 2,860 | 1,371 | 688 | 4,231 | 4,919 | (996 | ) | 1990 | 12/21/04 | ||||||||||||||||||||
16541 Commerce Drive (O) |
Dahlgren, VA | — | 773 | 3,094 | 1,030 | 773 | 4,124 | 4,897 | (946 | ) | 1996 | 12/21/04 | ||||||||||||||||||||
16543 Commerce Drive (O) |
Dahlgren, VA | 1,603 | 436 | 1,742 | 1 | 436 | 1,743 | 2,179 | (305 | ) | 2002 | 12/21/04 | ||||||||||||||||||||
1670 North Newport Road (O) |
Colorado Springs, CO | 4,480 | 853 | 6,014 | 581 | 853 | 6,595 | 7,448 | (515 | ) | 1986/1987 | 9/30/05 | ||||||||||||||||||||
1751 Pinnacle Drive (O) |
McLean, VA | 31,060 | 10,486 | 42,339 | 11,501 | 10,486 | 53,840 | 64,326 | (14,013 | ) | 1989/1995 | 9/23/04 | ||||||||||||||||||||
1753 Pinnacle Drive (O) |
McLean, VA | 25,064 | 8,275 | 34,353 | 8,421 | 8,275 | 42,774 | 51,049 | (9,203 | ) | 1976/2004 | 9/23/04 | ||||||||||||||||||||
1915 Aerotech Drive (O) |
Colorado Springs, CO | 3,394 | 556 | 3,094 | 471 | 556 | 3,565 | 4,121 | (954 | ) | 1985 | 6/8/06 | ||||||||||||||||||||
1925 Aerotech Drive (O) |
Colorado Springs, CO | 3,717 | 556 | 3,067 | 385 | 556 | 3,452 | 4,008 | (623 | ) | 1985 | 6/8/06 | ||||||||||||||||||||
200 International Circle (O) |
Hunt Valley, MD | — | 2,016 | 10,851 | 3,604 | 2,016 | 14,455 | 16,471 | (3,424 | ) | 1987 | 12/22/05 | ||||||||||||||||||||
201 International Circle (O) |
Hunt Valley, MD | — | 1,303 | 6,071 | 2,092 | 1,303 | 8,163 | 9,466 | (2,028 | ) | 1982 | 12/22/05 | ||||||||||||||||||||
F-60
| |
|
|
Initial Cost | |
Gross Amounts Carried At Close of Period | |
|
|
||||||||||||||||||||||||
|---|---|---|---|---|---|---|---|---|---|---|---|---|---|---|---|---|---|---|---|---|---|---|---|---|---|---|---|---|---|---|---|---|
| |
|
|
Costs Capitalized Subsequent to Acquisition |
|
|
|
||||||||||||||||||||||||||
Property (Type)(1)
|
Location | Encumbrances(2) | Land | Building and Land Improvements |
Land | Building and Land Improvements |
Total(3)(4) | Accumulated Depreciation(5) |
Year Built or Renovated |
Date Acquired(6) |
||||||||||||||||||||||
201 Technology Drive (O) |
Lebanon, VA | — | 726 | 31,091 | 60 | 726 | 31,151 | 31,877 | (3,243 | ) | 2007 | 10/5/07 | ||||||||||||||||||||
206 Research Boulevard (O) |
Aberdeen, MD | — | 1,813 | 15,956 | — | 1,813 | 15,956 | 17,769 | — | (7) | 9/14/07 | |||||||||||||||||||||
209 Research Boulevard (O) |
Aberdeen, MD | — | 1,045 | 16,063 | — | 1,045 | 16,063 | 17,108 | (458 | ) | 2010 | 9/14/07 | ||||||||||||||||||||
210 Research Boulevard (O) |
Aberdeen, MD | — | 1,065 | 13,081 | — | 1,065 | 13,081 | 14,146 | (192 | ) | 2010 | 9/14/07 | ||||||||||||||||||||
222 Schilling Circle (O) |
Hunt Valley, MD | — | 754 | 857 | 443 | 754 | 1,300 | 2,054 | (109 | ) | 1978/1997 | 1/10/07 | ||||||||||||||||||||
22289 Exploration Drive (O) |
Lexington Park, MD | — | 1,422 | 5,719 | 820 | 1,422 | 6,539 | 7,961 | (1,669 | ) | 2000 | 3/24/04 | ||||||||||||||||||||
22299 Exploration Drive (O) |
Lexington Park, MD | — | 1,362 | 5,791 | 620 | 1,362 | 6,411 | 7,773 | (1,866 | ) | 1998 | 3/24/04 | ||||||||||||||||||||
22300 Exploration Drive (O) |
Lexington Park, MD | — | 1,094 | 5,038 | 169 | 1,094 | 5,207 | 6,301 | (1,369 | ) | 1997 | 11/9/04 | ||||||||||||||||||||
22309 Exploration Drive (O) |
Lexington Park, MD | — | 2,243 | 10,419 | 204 | 2,243 | 10,623 | 12,866 | (3,059 | ) | 1984/1997 | 3/24/04 | ||||||||||||||||||||
224 Schilling Circle (O) |
Hunt Valley, MD | — | 734 | 468 | 866 | 734 | 1,334 | 2,068 | (262 | ) | 1978/1997 | 1/10/07 | ||||||||||||||||||||
226 Schilling Circle (O) |
Hunt Valley, MD | — | 1,877 | 9,891 | 392 | 1,877 | 10,283 | 12,160 | (2,066 | ) | 1980 | 12/22/05 | ||||||||||||||||||||
23535 Cottonwood Parkway (O) |
California, MD | — | 692 | 3,051 | 223 | 692 | 3,274 | 3,966 | (650 | ) | 1984 | 3/24/04 | ||||||||||||||||||||
2500 Riva Road (O) |
Annapolis, MD | — | 2,791 | 12,145 | 1 | 2,791 | 12,146 | 14,937 | (3,040 | ) | 2000 | 3/4/03 | ||||||||||||||||||||
2691 Technology Drive (O) |
Annapolis Junction, MD | 24,000 | 2,098 | 17,334 | 4,934 | 2,098 | 22,268 | 24,366 | (3,783 | ) | 2005 | 5/26/00 | ||||||||||||||||||||
2701 Technology Drive (O) |
Annapolis Junction, MD | 14,044 | 1,737 | 15,266 | 55 | 1,737 | 15,321 | 17,058 | (4,970 | ) | 2001 | 5/26/00 | ||||||||||||||||||||
2711 Technology Drive (O) |
Annapolis Junction, MD | 19,709 | 2,251 | 21,611 | 1,032 | 2,251 | 22,643 | 24,894 | (7,170 | ) | 2002 | 11/13/00 | ||||||||||||||||||||
2720 Technology Drive (O) |
Annapolis Junction, MD | 24,511 | 3,863 | 29,272 | 36 | 3,863 | 29,308 | 33,171 | (5,369 | ) | 2004 | 1/31/02 | ||||||||||||||||||||
2721 Technology Drive (O) |
Annapolis Junction, MD | — | 4,611 | 14,597 | 33 | 4,611 | 14,630 | 19,241 | (4,451 | ) | 2000 | 10/21/99 | ||||||||||||||||||||
2730 Hercules Road (O) |
Annapolis Junction, MD | 33,327 | 8,737 | 31,612 | 2,829 | 8,737 | 34,441 | 43,178 | (10,797 | ) | 1990 | 9/28/98 | ||||||||||||||||||||
2900 Towerview Road (O) |
Herndon, VA | — | 3,207 | 16,342 | 5,220 | 3,207 | 21,562 | 24,769 | (2,924 | ) | 1982/2008 | 12/20/05 | ||||||||||||||||||||
300 Sentinel Drive (O) |
Annapolis Junction, MD | — | 1,517 | 58,445 | 119 | 1,517 | 58,564 | 60,081 | (2,564 | ) | 2009 | 11/14/03 | ||||||||||||||||||||
302 Sentinel Drive (O) |
Annapolis Junction, MD | 23,111 | 2,648 | 29,395 | 330 | 2,648 | 29,725 | 32,373 | (2,873 | ) | 2007 | 11/14/03 | ||||||||||||||||||||
304 Sentinel Drive (O) |
Annapolis Junction, MD | 37,280 | 3,411 | 24,917 | 105 | 3,411 | 25,022 | 28,433 | (3,716 | ) | 2005 | 11/14/03 | ||||||||||||||||||||
306 Sentinel Drive (O) |
Annapolis Junction, MD | 21,353 | 3,260 | 22,592 | 59 | 3,260 | 22,651 | 25,911 | (2,973 | ) | 2006 | 11/14/03 | ||||||||||||||||||||
308 Sentinel Drive (O) |
Annapolis Junction, MD | — | 1,422 | 25,357 | — | 1,422 | 25,357 | 26,779 | (460 | ) | 2010 | 11/14/03 | ||||||||||||||||||||
310 The Bridge Street (O) |
Huntsville, AL | — | 261 | 26,576 | — | 261 | 26,576 | 26,837 | (535 | ) | 2009 | 8/4/11 | ||||||||||||||||||||
3120 Fairview Park Drive (O) |
Falls Church, VA | — | 6,863 | 35,606 | 2,676 | 6,863 | 38,282 | 45,145 | (991 | ) | 2008 | 11/23/10 | ||||||||||||||||||||
314 Sentinel Way (O) |
Annapolis Junction, MD | — | 1,254 | 1,325 | — | 1,254 | 1,325 | 2,579 | (116 | ) | 2008 | 11/14/03 | ||||||||||||||||||||
316 Sentinel Way (O) |
Annapolis Junction, MD | — | 2,748 | 26,670 | — | 2,748 | 26,670 | 29,418 | (162 | ) | 2011 | 11/14/03 | ||||||||||||||||||||
318 Sentinel Way (O) |
Annapolis Junction, MD | 22,649 | 2,185 | 28,426 | — | 2,185 | 28,426 | 30,611 | (4,138 | ) | 2005 | 11/14/03 | ||||||||||||||||||||
320 Sentinel Way (O) |
Annapolis Junction, MD | — | 2,067 | 21,623 | — | 2,067 | 21,623 | 23,690 | (2,148 | ) | 2007 | 11/14/03 | ||||||||||||||||||||
322 Sentinel Way (O) |
Annapolis Junction, MD | 22,310 | 2,605 | 22,812 | — | 2,605 | 22,812 | 25,417 | (2,860 | ) | 2006 | 11/14/03 | ||||||||||||||||||||
324 Sentinel Way (O) |
Annapolis Junction, MD | — | 1,656 | 22,730 | — | 1,656 | 22,730 | 24,386 | (796 | ) | 2010 | 6/29/06 | ||||||||||||||||||||
3535 Northrop Grumman Point (O) |
Colorado Springs, CO | 18,308 | — | 21,380 | 187 | — | 21,567 | 21,567 | (2,735 | ) | 2008 | 6/10/08 | ||||||||||||||||||||
F-61
| |
|
|
Initial Cost | |
Gross Amounts Carried At Close of Period | |
|
|
||||||||||||||||||||||||
|---|---|---|---|---|---|---|---|---|---|---|---|---|---|---|---|---|---|---|---|---|---|---|---|---|---|---|---|---|---|---|---|---|
| |
|
|
Costs Capitalized Subsequent to Acquisition |
|
|
|
||||||||||||||||||||||||||
Property (Type)(1)
|
Location | Encumbrances(2) | Land | Building and Land Improvements |
Land | Building and Land Improvements |
Total(3)(4) | Accumulated Depreciation(5) |
Year Built or Renovated |
Date Acquired(6) |
||||||||||||||||||||||
375 West Padonia Road (O) |
Timonium, MD | — | 2,483 | 10,415 | 4,016 | 2,483 | 14,431 | 16,914 | (4,289 | ) | 1986 | 12/21/99 | ||||||||||||||||||||
400 Professional Drive (O) |
Gaithersburg, MD | 14,934 | 3,673 | 9,198 | 1,571 | 3,673 | 10,769 | 14,442 | (3,053 | ) | 2000 | 3/5/04 | ||||||||||||||||||||
410 National Business Parkway (O) |
Annapolis Junction, MD | — | 1,831 | 13,902 | — | 1,831 | 13,902 | 15,733 | — | (7) | 6/29/03 | |||||||||||||||||||||
4230 Forbes Boulevard (O) |
Lanham, MD | — | 511 | 4,346 | — | 511 | 4,346 | 4,857 | (1,726 | ) | 2003 | 12/24/02 | ||||||||||||||||||||
430 National Business Parkway (O) |
Annapolis Junction, MD | — | 1,852 | 17,921 | — | 1,852 | 17,921 | 19,773 | (38 | ) | 2011 | 6/29/06 | ||||||||||||||||||||
44408 Pecan Court (O) |
California, MD | — | 817 | 1,993 | 118 | 817 | 2,111 | 2,928 | (71 | ) | 1986 | 3/24/04 | ||||||||||||||||||||
44414 Pecan Court (O) |
California, MD | — | 405 | 1,619 | 291 | 405 | 1,910 | 2,315 | (393 | ) | 1986 | 3/24/04 | ||||||||||||||||||||
44417 Pecan Court (O) |
California, MD | — | 434 | 1,939 | 72 | 434 | 2,011 | 2,445 | (562 | ) | 1989 | 3/24/04 | ||||||||||||||||||||
44420 Pecan Court (O) |
California, MD | — | 344 | 890 | 126 | 344 | 1,016 | 1,360 | (36 | ) | 1989 | 11/9/04 | ||||||||||||||||||||
44425 Pecan Court (O) |
California, MD | — | 1,309 | 3,506 | 952 | 1,309 | 4,458 | 5,767 | (513 | ) | 1997 | 5/5/04 | ||||||||||||||||||||
45 West Gude Drive (O) |
Rockville, MD | — | 3,102 | 11,869 | 10,722 | 3,102 | 22,591 | 25,693 | (3,493 | ) | 1987 | 4/7/05 | ||||||||||||||||||||
45310 Abell House Lane (O) |
California, MD | — | 2,272 | 14,253 | — | 2,272 | 14,253 | 16,525 | (28 | ) | 2011 | 8/30/10 | ||||||||||||||||||||
46579 Expedition Drive (O) |
Lexington Park, MD | — | 1,406 | 5,796 | 1,066 | 1,406 | 6,862 | 8,268 | (1,848 | ) | 2002 | 3/24/04 | ||||||||||||||||||||
46591 Expedition Drive (O) |
Lexington Park, MD | — | 1,200 | 7,199 | 138 | 1,200 | 7,337 | 8,537 | (898 | ) | 2005 | 3/24/04 | ||||||||||||||||||||
4851 Stonecroft Boulevard (O) |
Chantilly, VA | — | 1,878 | 11,558 | 21 | 1,878 | 11,579 | 13,457 | (2,089 | ) | 2004 | 8/14/02 | ||||||||||||||||||||
4940 Campbell Drive (O) |
White Marsh, MD | — | 1,379 | 3,858 | 830 | 1,379 | 4,688 | 6,067 | (771 | ) | 1990 | 1/9/07 | ||||||||||||||||||||
4969 Mercantile Road (O) |
White Marsh, MD | — | 1,308 | 4,456 | 62 | 1,308 | 4,518 | 5,826 | (563 | ) | 1983 | 1/9/07 | ||||||||||||||||||||
4979 Mercantile Road (O) |
White Marsh, MD | — | 1,299 | 4,686 | 81 | 1,299 | 4,767 | 6,066 | (606 | ) | 1985 | 1/9/07 | ||||||||||||||||||||
5020 Campbell Boulevard (O) |
White Marsh, MD | — | 1,014 | 3,136 | 110 | 1,014 | 3,246 | 4,260 | (556 | ) | 1986 - 1988 | 1/9/07 | ||||||||||||||||||||
5022 Campbell Boulevard (O) |
White Marsh, MD | — | 624 | 1,924 | 282 | 624 | 2,206 | 2,830 | (400 | ) | 1986 - 1988 | 1/9/07 | ||||||||||||||||||||
5024 Campbell Boulevard (O) |
White Marsh, MD | — | 767 | 2,420 | 255 | 767 | 2,675 | 3,442 | (605 | ) | 1986 - 1988 | 1/9/07 | ||||||||||||||||||||
5026 Campbell Boulevard (O) |
White Marsh, MD | — | 700 | 2,138 | 7 | 700 | 2,145 | 2,845 | (344 | ) | 1986 - 1988 | 1/9/07 | ||||||||||||||||||||
525 Babcock Road (O) |
Colorado Springs, CO | — | 355 | 974 | 32 | 355 | 1,006 | 1,361 | (170 | ) | 1967 | 7/12/07 | ||||||||||||||||||||
5325 Nottingham Drive (O) |
White Marsh, MD | — | 816 | 3,976 | 484 | 816 | 4,460 | 5,276 | (598 | ) | 2002 | 1/9/07 | ||||||||||||||||||||
5355 Nottingham Drive (O) |
White Marsh, MD | — | 761 | 3,562 | 1,599 | 761 | 5,161 | 5,922 | (663 | ) | 2005 | 1/9/07 | ||||||||||||||||||||
5520 Research Park Drive (O) |
Catonsville, MD | — | — | 20,027 | — | — | 20,027 | 20,027 | (1,183 | ) | 2009 | 4/4/06 | ||||||||||||||||||||
5522 Research Park Drive (O) |
Catonsville, MD | — | — | 4,550 | — | — | 4,550 | 4,550 | (500 | ) | 2007 | 3/8/06 | ||||||||||||||||||||
565 Space Center Drive (O) |
Colorado Springs, CO | — | 644 | 5,619 | 18 | 644 | 5,637 | 6,281 | (562 | ) | 2009 | 7/8/05 | ||||||||||||||||||||
5725 Mark Dabling Boulevard (O) |
Colorado Springs, CO | 12,882 | 900 | 11,397 | 2,523 | 900 | 13,920 | 14,820 | (3,844 | ) | 1984 | 5/18/06 | ||||||||||||||||||||
5755 Mark Dabling Boulevard (O) |
Colorado Springs, CO | 10,208 | 799 | 10,324 | 2,661 | 799 | 12,985 | 13,784 | (2,762 | ) | 1989 | 5/18/06 | ||||||||||||||||||||
5775 Mark Dabling Boulevard (O) |
Colorado Springs, CO | 12,477 | 1,035 | 12,440 | 1,386 | 1,035 | 13,826 | 14,861 | (3,850 | ) | 1984 | 5/18/06 | ||||||||||||||||||||
5825 University Research Court (O) |
College Park, MD | 16,605 | — | 21,690 | — | — | 21,690 | 21,690 | (1,621 | ) | 2008 | 1/29/08 | ||||||||||||||||||||
5850 University Research Court (O) |
College Park, MD | 22,609 | — | 30,062 | — | — | 30,062 | 30,062 | (1,483 | ) | 2009 | 1/29/08 | ||||||||||||||||||||
655 Space Center Drive (O) |
Colorado Springs, CO | — | 745 | 17,668 | 25 | 745 | 17,693 | 18,438 | (1,626 | ) | 2008 | 7/8/05 | ||||||||||||||||||||
6700 Alexander Bell Drive (O) |
Columbia, MD | 4,000 | 1,755 | 7,019 | 3,751 | 1,755 | 10,770 | 12,525 | (4,195 | ) | 1988 | 5/14/01 | ||||||||||||||||||||
6708 Alexander Bell Drive (O) |
Columbia, MD | 6,320 | 897 | 3,588 | 1,580 | 897 | 5,168 | 6,065 | (2,233 | ) | 1988 | 5/14/01 | ||||||||||||||||||||
F-62
| |
|
|
Initial Cost | |
Gross Amounts Carried At Close of Period | |
|
|
||||||||||||||||||||||||
|---|---|---|---|---|---|---|---|---|---|---|---|---|---|---|---|---|---|---|---|---|---|---|---|---|---|---|---|---|---|---|---|---|
| |
|
|
Costs Capitalized Subsequent to Acquisition |
|
|
|
||||||||||||||||||||||||||
Property (Type)(1)
|
Location | Encumbrances(2) | Land | Building and Land Improvements |
Land | Building and Land Improvements |
Total(3)(4) | Accumulated Depreciation(5) |
Year Built or Renovated |
Date Acquired(6) |
||||||||||||||||||||||
6711 Columbia Gateway Drive (O) |
Columbia, MD | — | 2,683 | 23,218 | 263 | 2,683 | 23,481 | 26,164 | (2,878 | ) | 2006 - 2007 | 9/28/00 | ||||||||||||||||||||
6716 Alexander Bell Drive (O) |
Columbia, MD | — | 1,242 | 4,969 | 1,948 | 1,242 | 6,917 | 8,159 | (3,153 | ) | 1990 | 12/31/98 | ||||||||||||||||||||
6721 Columbia Gateway Drive (O) |
Columbia, MD | 29,782 | 1,753 | 34,090 | — | 1,753 | 34,090 | 35,843 | (2,381 | ) | 2009 | 9/28/00 | ||||||||||||||||||||
6724 Alexander Bell Drive (O) |
Columbia, MD | 10,939 | 449 | 5,039 | 221 | 449 | 5,260 | 5,709 | (1,614 | ) | 2001 | 5/14/01 | ||||||||||||||||||||
6731 Columbia Gateway Drive (O) |
Columbia, MD | — | 2,807 | 19,098 | 1,017 | 2,807 | 20,115 | 22,922 | (5,825 | ) | 2002 | 3/29/00 | ||||||||||||||||||||
6740 Alexander Bell Drive (O) |
Columbia, MD | — | 1,424 | 5,696 | 2,850 | 1,424 | 8,546 | 9,970 | (3,601 | ) | 1992 | 12/31/98 | ||||||||||||||||||||
6741 Columbia Gateway Drive (O) |
Columbia, MD | — | 675 | 1,711 | 114 | 675 | 1,825 | 2,500 | (142 | ) | 2008 | 9/28/00 | ||||||||||||||||||||
6750 Alexander Bell Drive (O) |
Columbia, MD | — | 1,263 | 12,461 | 2,020 | 1,263 | 14,481 | 15,744 | (5,400 | ) | 2001 | 12/31/98 | ||||||||||||||||||||
6760 Alexander Bell Drive (O) |
Columbia, MD | — | 890 | 3,561 | 1,849 | 890 | 5,410 | 6,300 | (2,424 | ) | 1991 | 12/31/98 | ||||||||||||||||||||
6940 Columbia Gateway Drive (O) |
Columbia, MD | 17,300 | 3,545 | 9,916 | 2,620 | 3,545 | 12,536 | 16,081 | (4,760 | ) | 1999 | 11/13/98 | ||||||||||||||||||||
6950 Columbia Gateway Drive (O) |
Columbia, MD | — | 3,596 | 14,269 | 945 | 3,596 | 15,214 | 18,810 | (5,612 | ) | 1998 | 10/22/98 | ||||||||||||||||||||
7000 Columbia Gateway Drive (O) |
Columbia, MD | 15,800 | 3,131 | 12,103 | 291 | 3,131 | 12,394 | 15,525 | (2,888 | ) | 1999 | 5/31/02 | ||||||||||||||||||||
7015 Albert Einstein Drive (O) |
Columbia, MD | 2,746 | 2,058 | 6,093 | 826 | 2,058 | 6,919 | 8,977 | (1,934 | ) | 1999 | 12/1/05 | ||||||||||||||||||||
7061 Columbia Gateway Drive (O) |
Columbia, MD | 2,278 | 729 | 3,094 | 560 | 729 | 3,654 | 4,383 | (1,314 | ) | 2000 | 8/30/01 | ||||||||||||||||||||
7063 Columbia Gateway Drive (O) |
Columbia, MD | 2,732 | 902 | 3,684 | 1,035 | 902 | 4,719 | 5,621 | (1,923 | ) | 2000 | 8/30/01 | ||||||||||||||||||||
7065 Columbia Gateway Drive (O) |
Columbia, MD | 2,650 | 919 | 3,763 | 993 | 919 | 4,756 | 5,675 | (1,715 | ) | 2000 | 8/30/01 | ||||||||||||||||||||
7067 Columbia Gateway Drive (O) |
Columbia, MD | 7,728 | 1,829 | 11,823 | 2,033 | 1,829 | 13,856 | 15,685 | (3,772 | ) | 2001 | 8/30/01 | ||||||||||||||||||||
7125 Columbia Gateway Drive (L) |
Columbia, MD | — | 3,361 | 118 | 279 | 3,361 | 397 | 3,758 | — | (8) | 6/29/06 | |||||||||||||||||||||
7125 Columbia Gateway Drive (O) |
Columbia, MD | 34,538 | 17,126 | 46,994 | 5,876 | 17,126 | 52,870 | 69,996 | (8,824 | ) | 1973/1999 | 6/29/06 | ||||||||||||||||||||
7130 Columbia Gateway Drive (O) |
Columbia, MD | 6,519 | 1,350 | 4,359 | 1,768 | 1,350 | 6,127 | 7,477 | (1,207 | ) | 1989 | 9/19/05 | ||||||||||||||||||||
7134 Columbia Gateway Drive (O) |
Columbia, MD | 2,949 | 704 | 1,971 | 70 | 704 | 2,041 | 2,745 | (446 | ) | 1990 | 9/19/05 | ||||||||||||||||||||
7138 Columbia Gateway Drive (O) |
Columbia, MD | 5,406 | 1,104 | 3,518 | 1,961 | 1,104 | 5,479 | 6,583 | (1,852 | ) | 1990 | 9/19/05 | ||||||||||||||||||||
7142 Columbia Gateway Drive (O) |
Columbia, MD | 6,280 | 1,342 | 3,978 | 1,664 | 1,342 | 5,642 | 6,984 | (1,147 | ) | 1994 | 9/19/05 | ||||||||||||||||||||
7150 Columbia Gateway Drive (O) |
Columbia, MD | 4,850 | 1,032 | 3,429 | 216 | 1,032 | 3,645 | 4,677 | (776 | ) | 1991 | 9/19/05 | ||||||||||||||||||||
7150 Riverwood Drive (O) |
Columbia, MD | — | 1,821 | 4,388 | 754 | 1,821 | 5,142 | 6,963 | (873 | ) | 2000 | 1/10/07 | ||||||||||||||||||||
7160 Riverwood Drive (O) |
Columbia, MD | — | 2,732 | 7,006 | 1,169 | 2,732 | 8,175 | 10,907 | (2,407 | ) | 2000 | 1/10/07 | ||||||||||||||||||||
7170 Riverwood Drive (O) |
Columbia, MD | — | 1,283 | 3,096 | 233 | 1,283 | 3,329 | 4,612 | (566 | ) | 2000 | 1/10/07 | ||||||||||||||||||||
7200 Riverwood Road (O) |
Columbia, MD | — | 4,089 | 16,356 | 2,348 | 4,089 | 18,704 | 22,793 | (6,172 | ) | 1986 | 10/13/98 | ||||||||||||||||||||
7205 Riverwood Drive (O) |
Columbia, MD | — | 1,367 | 13,015 | — | 1,367 | 13,015 | 14,382 | — | (7) | 7/27/05 | |||||||||||||||||||||
7240 Parkway Drive (O) |
Hanover, MD | — | 1,496 | 5,985 | 2,921 | 1,496 | 8,906 | 10,402 | (3,334 | ) | 1985 | 4/18/00 | ||||||||||||||||||||
F-63
| |
|
|
Initial Cost | |
Gross Amounts Carried At Close of Period | |
|
|
||||||||||||||||||||||||
|---|---|---|---|---|---|---|---|---|---|---|---|---|---|---|---|---|---|---|---|---|---|---|---|---|---|---|---|---|---|---|---|---|
| |
|
|
Costs Capitalized Subsequent to Acquisition |
|
|
|
||||||||||||||||||||||||||
Property (Type)(1)
|
Location | Encumbrances(2) | Land | Building and Land Improvements |
Land | Building and Land Improvements |
Total(3)(4) | Accumulated Depreciation(5) |
Year Built or Renovated |
Date Acquired(6) |
||||||||||||||||||||||
7272 Park Circle Drive (O) |
Hanover, MD | 5,375 | 1,479 | 6,300 | 1,499 | 1,479 | 7,799 | 9,278 | (1,349 | ) | 1991/1996 | 1/10/07 | ||||||||||||||||||||
7318 Parkway Drive (O) |
Hanover, MD | — | 972 | 3,888 | 785 | 972 | 4,673 | 5,645 | (1,449 | ) | 1984 | 4/16/99 | ||||||||||||||||||||
7320 Parkway Drive (O) |
Hanover, MD | 7,000 | 905 | 3,570 | 1,140 | 905 | 4,710 | 5,615 | (1,348 | ) | 1983 | 4/4/02 | ||||||||||||||||||||
745 Space Center Drive (O) |
Colorado Springs, CO | — | 654 | 9,203 | 15 | 654 | 9,218 | 9,872 | (1,338 | ) | 2006 | 7/8/05 | ||||||||||||||||||||
7467 Ridge Road (O) |
Hanover, MD | — | 1,629 | 6,516 | 1,917 | 1,629 | 8,433 | 10,062 | (3,045 | ) | 1990 | 4/28/99 | ||||||||||||||||||||
7468 Candlewood Drive (O) |
Hanover, MD | — | 5,599 | 12,198 | 3 | 5,599 | 12,201 | 17,800 | — | 1979/1982 | 12/20/05 | |||||||||||||||||||||
7700 Potranco Road (O) |
San Antonio, TX | — | 14,020 | 38,773 | 7 | 14,020 | 38,780 | 52,800 | (4,733 | ) | 1982/1985 | 3/30/05 | ||||||||||||||||||||
7700-1 Potranco Road (O) |
San Antonio, TX | — | — | 1,066 | — | — | 1,066 | 1,066 | (81 | ) | 2007 | 3/30/05 | ||||||||||||||||||||
7700-5 Potranco Road (O) |
San Antonio, TX | — | — | 1,884 | — | — | 1,884 | 1,884 | (107 | ) | 2009 | 3/30/05 | ||||||||||||||||||||
7740 Milestone Parkway (O) |
Hanover, MD | 16,829 | 3,825 | 26,143 | — | 3,825 | 26,143 | 29,968 | (1,615 | ) | 2009 | 7/2/07 | ||||||||||||||||||||
7770 Backlick Road (O) |
Springfield, VA | 17,875 | 6,387 | 20,614 | — | 6,387 | 20,614 | 27,001 | — | (7) | 3/10/10 | |||||||||||||||||||||
7923 Honeygo Boulevard (O) |
White Marsh, MD | — | 715 | 1,437 | 350 | 715 | 1,787 | 2,502 | (205 | ) | 1985 | 1/10/07 | ||||||||||||||||||||
7939 Honeygo Boulevard (O) |
White Marsh, MD | — | 869 | 2,033 | 139 | 869 | 2,172 | 3,041 | (236 | ) | 1984 | 1/10/07 | ||||||||||||||||||||
7941-7949 Corporate Drive (O) |
White Marsh, MD | — | 2,087 | 3,782 | 12 | 2,087 | 3,794 | 5,881 | (589 | ) | 1996 | 1/9/07 | ||||||||||||||||||||
800 International Drive (O) |
Linthicum, MD | 8,408 | 775 | 3,099 | 1,098 | 775 | 4,197 | 4,972 | (1,531 | ) | 1988 | 4/30/98 | ||||||||||||||||||||
8000 Potranco Road (O) |
San Antonio, TX | — | 1,964 | 22,681 | — | 1,964 | 22,681 | 24,645 | (614 | ) | 2010 | 1/20/06 | ||||||||||||||||||||
8003 Corporate Drive (O) |
White Marsh, MD | — | 611 | 1,611 | 53 | 611 | 1,664 | 2,275 | (270 | ) | 1999 | 1/9/07 | ||||||||||||||||||||
8007 Corporate Drive (O) |
White Marsh, MD | — | 1,434 | 3,336 | 196 | 1,434 | 3,532 | 4,966 | (637 | ) | 1995 | 1/9/07 | ||||||||||||||||||||
8010 Corporate Drive (O) |
White Marsh, MD | — | 1,349 | 3,262 | 1,607 | 1,349 | 4,869 | 6,218 | (629 | ) | 1998 | 1/9/07 | ||||||||||||||||||||
8013 Corporate Drive (O) |
White Marsh, MD | 1,318 | 642 | 1,536 | 256 | 642 | 1,792 | 2,434 | (323 | ) | 1990 | 1/9/07 | ||||||||||||||||||||
8015 Corporate Drive (O) |
White Marsh, MD | 945 | 446 | 1,116 | 185 | 446 | 1,301 | 1,747 | (255 | ) | 1990 | 1/9/07 | ||||||||||||||||||||
8019 Corporate Drive (O) |
White Marsh, MD | 1,561 | 680 | 1,898 | 1,242 | 680 | 3,140 | 3,820 | (469 | ) | 1990 | 1/9/07 | ||||||||||||||||||||
8020 Corporate Drive (O) |
White Marsh, MD | — | 2,184 | 3,767 | 2,172 | 2,184 | 5,939 | 8,123 | (683 | ) | 1997 | 1/9/07 | ||||||||||||||||||||
8023 Corporate Drive (O) |
White Marsh, MD | 1,364 | 651 | 1,603 | 5 | 651 | 1,608 | 2,259 | (223 | ) | 1990 | 1/9/07 | ||||||||||||||||||||
8029 Corporate Drive (O) |
White Marsh, MD | — | 962 | 2,719 | 10 | 962 | 2,729 | 3,691 | (524 | ) | 1988/2004 | 1/9/07 | ||||||||||||||||||||
8030 Potranco Road (O) |
San Antonio, TX | — | 1,964 | 19,584 | — | 1,964 | 19,584 | 21,548 | (612 | ) | 2010 | 1/20/06 | ||||||||||||||||||||
8031 Corporate Drive (O) |
White Marsh, MD | — | 2,548 | 6,975 | — | 2,548 | 6,975 | 9,523 | (1,225 | ) | 1988/2004 | 1/9/07 | ||||||||||||||||||||
8094 Sandpiper Circle (O) |
White Marsh, MD | — | 1,960 | 3,716 | 214 | 1,960 | 3,930 | 5,890 | (698 | ) | 1998 | 1/9/07 | ||||||||||||||||||||
8098 Sandpiper Circle (O) |
White Marsh, MD | — | 1,797 | 3,651 | 71 | 1,797 | 3,722 | 5,519 | (462 | ) | 1998 | 1/9/07 | ||||||||||||||||||||
8100 Potranco Road (L) |
San Antonio, TX | — | 1,964 | 1,396 | — | 1,964 | 1,396 | 3,360 | — | (8) | 6/14/05 | |||||||||||||||||||||
8110 Corporate Drive (O) |
White Marsh, MD | — | 2,285 | 10,117 | 29 | 2,285 | 10,146 | 12,431 | (1,832 | ) | 2001 | 1/9/07 | ||||||||||||||||||||
8114 Sandpiper Circle (O) |
White Marsh, MD | — | 1,634 | 608 | 1,201 | 1,634 | 1,809 | 3,443 | (403 | ) | 1986 | 1/9/07 | ||||||||||||||||||||
8133 Perry Hall Boulevard (O) |
White Marsh, MD | — | 850 | 1,950 | 325 | 850 | 2,275 | 3,125 | (294 | ) | 1988 | 1/10/07 | ||||||||||||||||||||
8140 Corporate Drive (O) |
White Marsh, MD | — | 2,158 | 8,457 | 1,989 | 2,158 | 10,446 | 12,604 | (2,564 | ) | 2003 | 1/9/07 | ||||||||||||||||||||
F-64
| |
|
|
Initial Cost | |
Gross Amounts Carried At Close of Period | |
|
|
||||||||||||||||||||||||
|---|---|---|---|---|---|---|---|---|---|---|---|---|---|---|---|---|---|---|---|---|---|---|---|---|---|---|---|---|---|---|---|---|
| |
|
|
Costs Capitalized Subsequent to Acquisition |
|
|
|
||||||||||||||||||||||||||
Property (Type)(1)
|
Location | Encumbrances(2) | Land | Building and Land Improvements |
Land | Building and Land Improvements |
Total(3)(4) | Accumulated Depreciation(5) |
Year Built or Renovated |
Date Acquired(6) |
||||||||||||||||||||||
849 International Drive (O) |
Linthicum, MD | 11,692 | 1,356 | 5,426 | 2,876 | 1,356 | 8,302 | 9,658 | (3,742 | ) | 1988 | 2/23/99 | ||||||||||||||||||||
8615 Ridgely's Choice (O) |
White Marsh, MD | — | 1,078 | 3,024 | 1,121 | 1,078 | 4,145 | 5,223 | (447 | ) | 2005 | 1/9/07 | ||||||||||||||||||||
8621 Robert Fulton Drive (O) |
Columbia, MD | 11,000 | 2,317 | 12,642 | 199 | 2,317 | 12,841 | 15,158 | (1,968 | ) | 2005 - 2006 | 6/10/05 | ||||||||||||||||||||
8661 Robert Fulton Drive (O) |
Columbia, MD | 6,200 | 1,510 | 3,764 | 1,042 | 1,510 | 4,806 | 6,316 | (1,361 | ) | 2002 | 12/30/03 | ||||||||||||||||||||
8671 Robert Fulton Drive (O) |
Columbia, MD | 7,600 | 1,718 | 4,280 | 1,941 | 1,718 | 6,221 | 7,939 | (1,848 | ) | 2002 | 12/30/03 | ||||||||||||||||||||
870 Elkridge Landing Road (O) |
Linthicum, MD | 18,900 | 2,003 | 9,442 | 6,689 | 2,003 | 16,131 | 18,134 | (6,712 | ) | 1981 | 8/3/01 | ||||||||||||||||||||
881 Elkridge Landing Road (O) |
Linthicum, MD | 11,812 | 1,034 | 4,137 | 1,049 | 1,034 | 5,186 | 6,220 | (1,816 | ) | 1986 | 4/30/98 | ||||||||||||||||||||
891 Elkridge Landing Road (O) |
Linthicum, MD | — | 1,160 | 4,750 | 1,777 | 1,160 | 6,527 | 7,687 | (2,378 | ) | 1984 | 7/2/01 | ||||||||||||||||||||
900 Elkridge Landing Road (O) |
Linthicum, MD | — | 1,993 | 7,972 | 2,495 | 1,993 | 10,467 | 12,460 | (4,260 | ) | 1982 | 4/30/98 | ||||||||||||||||||||
900 International Drive (O) |
Linthicum, MD | 8,008 | 981 | 3,922 | 834 | 981 | 4,756 | 5,737 | (1,791 | ) | 1986 | 4/30/98 | ||||||||||||||||||||
901 Elkridge Landing Road (O) |
Linthicum, MD | — | 1,151 | 4,416 | 1,563 | 1,151 | 5,979 | 7,130 | (1,914 | ) | 1984 | 7/2/01 | ||||||||||||||||||||
9020 Mendenhall Court (O) |
Columbia, MD | — | 1,233 | 2,694 | 392 | 1,233 | 3,086 | 4,319 | (481 | ) | 1982/2005 | 1/9/07 | ||||||||||||||||||||
911 Elkridge Landing Road (O) |
Linthicum, MD | — | 1,215 | 4,861 | 2,024 | 1,215 | 6,885 | 8,100 | (2,564 | ) | 1985 | 4/30/98 | ||||||||||||||||||||
9130 Guilford Road (O) |
Columbia, MD | 771 | 230 | 939 | 101 | 230 | 1,040 | 1,270 | (333 | ) | 1984 | 4/4/02 | ||||||||||||||||||||
9140 Guilford Road (O) |
Columbia, MD | 2,639 | 794 | 3,209 | 791 | 794 | 4,000 | 4,794 | (1,320 | ) | 1983 | 4/4/02 | ||||||||||||||||||||
9150 Guilford Road (O) |
Columbia, MD | 1,062 | 319 | 1,291 | 318 | 319 | 1,609 | 1,928 | (555 | ) | 1984 | 4/4/02 | ||||||||||||||||||||
9160 Guilford Road (O) |
Columbia, MD | 2,209 | 665 | 2,686 | 1,304 | 665 | 3,990 | 4,655 | (1,853 | ) | 1984 | 4/4/02 | ||||||||||||||||||||
920 Elkridge Landing Road (O) |
Linthicum, MD | 7,025 | 2,101 | 9,765 | 687 | 2,101 | 10,452 | 12,553 | (3,844 | ) | 1982 | 7/2/01 | ||||||||||||||||||||
921 Elkridge Landing Road (O) |
Linthicum, MD | — | 1,044 | 4,176 | 639 | 1,044 | 4,815 | 5,859 | (1,864 | ) | 1983 | 4/30/98 | ||||||||||||||||||||
930 International Drive (O) |
Linthicum, MD | 8,488 | 1,013 | 4,053 | 1,100 | 1,013 | 5,153 | 6,166 | (2,024 | ) | 1986 | 4/30/98 | ||||||||||||||||||||
938 Elkridge Landing Road (O) |
Linthicum, MD | 3,899 | 1,204 | 4,727 | 346 | 1,204 | 5,073 | 6,277 | (1,423 | ) | 1984 | 7/2/01 | ||||||||||||||||||||
939 Elkridge Landing Road (O) |
Linthicum, MD | — | 939 | 3,756 | 1,742 | 939 | 5,498 | 6,437 | (2,241 | ) | 1983 | 4/30/98 | ||||||||||||||||||||
940 Elkridge Landing Road (L) |
Linthicum, MD | 2,960 | 1,100 | 4,700 | 170 | 1,100 | 4,870 | 5,970 | (4,879 | ) | (8) | 7/2/01 | ||||||||||||||||||||
9651 Hornbaker Road (D) |
Manassas, VA | — | 6,050 | 187,441 | 54 | 6,050 | 187,495 | 193,545 | (967 | ) | 2010 | 9/14/10 | ||||||||||||||||||||
9690 Deereco Road (O) |
Timonium, MD | — | 3,415 | 13,723 | 4,955 | 3,415 | 18,678 | 22,093 | (7,246 | ) | 1988 | 12/21/99 | ||||||||||||||||||||
9700 Patuxent Woods Drive (O) |
Columbia, MD | 2,001 | 1,329 | 2,668 | 446 | 1,329 | 3,114 | 4,443 | (629 | ) | 1986/2001 | 1/9/07 | ||||||||||||||||||||
9710 Patuxent Woods Drive (O) |
Columbia, MD | 966 | 648 | 1,425 | 254 | 648 | 1,679 | 2,327 | (293 | ) | 1986/2001 | 1/9/07 | ||||||||||||||||||||
9720 Patuxent Woods Drive (O) |
Columbia, MD | 2,638 | 1,701 | 1,915 | 1,295 | 1,701 | 3,210 | 4,911 | (772 | ) | 1986/2001 | 1/9/07 | ||||||||||||||||||||
9730 Patuxent Woods Drive (O) |
Columbia, MD | 2,038 | 1,318 | 2,782 | 143 | 1,318 | 2,925 | 4,243 | (646 | ) | 1986/2001 | 1/9/07 | ||||||||||||||||||||
9740 Patuxent Woods Drive (O) |
Columbia, MD | 2,447 | 1,628 | 3,052 | 755 | 1,628 | 3,807 | 5,435 | (750 | ) | 1986/2001 | 1/9/07 | ||||||||||||||||||||
980 Technology Court (O) |
Colorado Springs, CO | — | 526 | 2,046 | 365 | 526 | 2,411 | 2,937 | (520 | ) | 1995 | 9/28/05 | ||||||||||||||||||||
985 Space Center Drive (O) |
Colorado Springs, CO | — | 777 | 12,287 | 1,501 | 777 | 13,788 | 14,565 | (2,557 | ) | 1989 | 9/28/05 | ||||||||||||||||||||
9900 Franklin Square Drive (O) |
White Marsh, MD | — | 979 | 3,466 | 161 | 979 | 3,627 | 4,606 | (614 | ) | 1999 | 1/9/07 | ||||||||||||||||||||
9910 Franklin Square Drive (O) |
White Marsh, MD | 5,200 | 1,219 | 6,590 | 25 | 1,219 | 6,615 | 7,834 | (1,213 | ) | 2005 | 1/9/07 | ||||||||||||||||||||
9920 Franklin Square Drive (O) |
White Marsh, MD | — | 1,058 | 5,293 | 1,313 | 1,058 | 6,606 | 7,664 | (1,141 | ) | 2006 | 1/9/07 | ||||||||||||||||||||
F-65
| |
|
|
Initial Cost | |
Gross Amounts Carried At Close of Period | |
|
|
||||||||||||||||||||||||
|---|---|---|---|---|---|---|---|---|---|---|---|---|---|---|---|---|---|---|---|---|---|---|---|---|---|---|---|---|---|---|---|---|
| |
|
|
Costs Capitalized Subsequent to Acquisition |
|
|
|
||||||||||||||||||||||||||
Property (Type)(1)
|
Location | Encumbrances(2) | Land | Building and Land Improvements |
Land | Building and Land Improvements |
Total(3)(4) | Accumulated Depreciation(5) |
Year Built or Renovated |
Date Acquired(6) |
||||||||||||||||||||||
9925 Federal Drive (O) |
Colorado Springs, CO | — | 1,129 | 5,166 | 17 | 1,129 | 5,183 | 6,312 | (590 | ) | 2008 | 9/28/05 | ||||||||||||||||||||
9930 Franklin Square Drive (O) |
White Marsh, MD | — | 1,137 | 3,921 | 20 | 1,137 | 3,941 | 5,078 | (702 | ) | 2001 | 1/9/07 | ||||||||||||||||||||
9940 Franklin Square Drive (O) |
White Marsh, MD | — | 1,052 | 3,382 | 281 | 1,052 | 3,663 | 4,715 | (587 | ) | 2000 | 1/9/07 | ||||||||||||||||||||
9945 Federal Drive (O) |
Colorado Springs, CO | — | 1,854 | 1,075 | — | 1,854 | 1,075 | 2,929 | (429 | ) | 2009 | 9/28/05 | ||||||||||||||||||||
9950 Federal Drive (O) |
Colorado Springs, CO | — | 877 | 5,045 | 1,501 | 877 | 6,546 | 7,423 | (1,705 | ) | 2001 | 12/22/05 | ||||||||||||||||||||
9960 Federal Drive (O) |
Colorado Springs, CO | — | 695 | 2,853 | 290 | 695 | 3,143 | 3,838 | (749 | ) | 2001 | 12/22/05 | ||||||||||||||||||||
9965 Federal Drive (L) |
Colorado Springs, CO | — | 466 | — | — | 466 | — | 466 | — | (8) | 12/22/05 | |||||||||||||||||||||
9965 Federal Drive (O) |
Colorado Springs, CO | — | 1,401 | 6,061 | 555 | 1,401 | 6,616 | 8,017 | (775 | ) | 1983/2007 | 1/19/06 | ||||||||||||||||||||
999 Corporate Boulevard (O) |
Linthicum, MD | 13,533 | 1,187 | 8,332 | 556 | 1,187 | 8,888 | 10,075 | (2,912 | ) | 2000 | 8/1/99 | ||||||||||||||||||||
Aerotech Commerce (L) |
Colorado Springs, CO | — | 900 | — | — | 900 | — | 900 | — | (8) | 5/19/06 | |||||||||||||||||||||
Arborcrest (O) |
Blue Bell, PA | — | 22,370 | 142,202 | 1,054 | 22,370 | 143,256 | 165,626 | (32,702 | ) | 1991 - 1996(6)(7) | 10/14/97 | ||||||||||||||||||||
Arundel Preserve (L) |
Hanover, MD | — | — | 5,296 | — | — | 5,296 | 5,296 | — | (8) | (9 | ) | ||||||||||||||||||||
Canton Crossing Land (L) |
Baltimore, MD | — | 16,085 | 1,038 | — | 16,085 | 1,038 | 17,123 | — | (8) | 10/27/09 | |||||||||||||||||||||
Canton Crossing Util Distr Ctr (O) |
Baltimore, MD | — | 7,300 | 15,551 | 490 | 7,300 | 16,041 | 23,341 | (1,132 | ) | 2005 | 10/27/09 | ||||||||||||||||||||
Columbia Gateway Parcel T-11 (L) |
Columbia, MD | — | 6,387 | 2,931 | — | 6,387 | 2,931 | 9,318 | — | (8) | 9/20/04 | |||||||||||||||||||||
Dahlgren Technology Center (L) |
Dahlgren, VA | — | 1,083 | 167 | — | 1,083 | 167 | 1,250 | — | (8) | 3/16/05 | |||||||||||||||||||||
Expedition VII (L) |
Lexington Park, MD | — | 705 | 735 | — | 705 | 735 | 1,440 | — | (8) | 3/24/04 | |||||||||||||||||||||
Fort Ritchie (L) |
Cascade, MD | — | 1,026 | — | — | 1,026 | — | 1,026 | — | (8) | 10/5/06 | |||||||||||||||||||||
Indian Head (L) |
Bryans Road, MD | — | 6,436 | 73 | — | 6,436 | 73 | 6,509 | — | (8) | 10/23/06 | |||||||||||||||||||||
InterQuest (L) |
Colorado Springs, CO | — | 14,515 | 19 | — | 14,515 | 19 | 14,534 | — | (8) | 9/28/05 | |||||||||||||||||||||
M Square Research Park (L) |
College Park, MD | — | — | 3,011 | — | — | 3,011 | 3,011 | — | (8) | 1/29/08 | |||||||||||||||||||||
Military Drive (L) |
San Antonio, TX | — | 9,460 | 4,304 | — | 9,460 | 4,304 | 13,764 | — | (8) | 3/30/05 | |||||||||||||||||||||
National Business Park (L) |
Annapolis Junction, MD | — | 5,510 | 8,497 | — | 5,510 | 8,497 | 14,007 | — | (8) | 11/14/03 | |||||||||||||||||||||
National Business Park North (L) |
Jessup, MD | — | 27,118 | 25,047 | — | 27,118 | 25,047 | 52,165 | — | (8) | 6/29/06 | |||||||||||||||||||||
North Gate Business Park (L) |
Aberdeen, MD | — | 6,486 | 9,783 | — | 6,486 | 9,783 | 16,269 | — | (8) | 9/14/07 | |||||||||||||||||||||
Northwest Crossroads (L) |
San Antonio, TX | — | 7,430 | 836 | — | 7,430 | 836 | 8,266 | — | (8) | 1/20/06 | |||||||||||||||||||||
Old Annapolis Road (O) |
Columbia, MD | — | 1,637 | 5,500 | 2,103 | 1,637 | 7,603 | 9,240 | (2,113 | ) | 1974/1985 | 12/14/00 | ||||||||||||||||||||
Patriot Park (L) |
Colorado Springs, CO | — | 8,768 | 232 | — | 8,768 | 232 | 9,000 | — | (8) | 7/8/05 | |||||||||||||||||||||
Patriot Ridge (L) |
Springfield, VA | — | 18,517 | 25,576 | — | 18,517 | 25,576 | 44,093 | — | (8) | 3/10/10 | |||||||||||||||||||||
Redstone Gateway (L) |
Huntsville, AL | — | — | 15,879 | — | — | 15,879 | 15,879 | — | (8) | 3/23/10 | |||||||||||||||||||||
Riverwood (L) |
Columbia, MD | — | 1,788 | 959 | — | 1,788 | 959 | 2,747 | (122 | ) | (8) | 7/27/05 | ||||||||||||||||||||
F-66
| |
|
|
Initial Cost | |
Gross Amounts Carried At Close of Period | |
|
|
||||||||||||||||||||||||
|---|---|---|---|---|---|---|---|---|---|---|---|---|---|---|---|---|---|---|---|---|---|---|---|---|---|---|---|---|---|---|---|---|
| |
|
|
Costs Capitalized Subsequent to Acquisition |
|
|
|
||||||||||||||||||||||||||
Property (Type)(1)
|
Location | Encumbrances(2) | Land | Building and Land Improvements |
Land | Building and Land Improvements |
Total(3)(4) | Accumulated Depreciation(5) |
Year Built or Renovated |
Date Acquired(6) |
||||||||||||||||||||||
Rockville Corporate Center (L) |
Rockville, MD | — | 2,872 | — | — | 2,872 | — | 2,872 | — | (8) | 4/7/05 | |||||||||||||||||||||
Route 15/Biggs Ford Road (L) |
Frederick, MD | — | 8,703 | 509 | — | 8,703 | 509 | 9,212 | — | (8) | 8/28/08 | |||||||||||||||||||||
Thomas Johnson Drive (L) |
Frederick, MD | — | 1,092 | 1,219 | — | 1,092 | 1,219 | 2,311 | — | (8) | 10/21/05 | |||||||||||||||||||||
West Nursery Road (L) |
Linthicum, MD | — | 1,441 | — | — | 1,441 | — | 1,441 | — | (8) | 10/28/09 | |||||||||||||||||||||
Westfields—Park Center (L) |
Herndon, VA | — | 3,609 | 2,654 | — | 3,609 | 2,654 | 6,263 | — | (8) | 7/18/02 | |||||||||||||||||||||
Westfields Corporate Center (L) |
Herndon, VA | — | 7,141 | 1,333 | — | 7,141 | 1,333 | 8,474 | — | (8) | 7/31/02 | |||||||||||||||||||||
White Marsh (L) |
White Marsh, MD | — | 30,322 | 11,497 | — | 30,322 | 11,497 | 41,819 | — | (8) | 1/9/07 | |||||||||||||||||||||
Woodland Park (L) |
Herndon, VA | — | 9,614 | 81 | — | 9,614 | 81 | 9,695 | — | (8) | 4/29/04 | |||||||||||||||||||||
Other Developments, including intercompany eliminations (V) |
Various | — | 7 | (152 | ) | (438 | ) | 7 | (590 | ) | (583 | ) | 699 | Various | Various | |||||||||||||||||
|
$ | 1,129,611 | $ | 727,222 | $ | 3,022,002 | $ | 289,708 | $ | 727,222 | $ | 3,311,710 | $ | 4,038,932 | $ | (577,601 | ) | |||||||||||||||
F-67
The following table summarizes our changes in cost of properties for the years ended December 31, 2011, 2010 and 2009 (in thousands):
| |
2011 | 2010 | 2009 | |||||||
|---|---|---|---|---|---|---|---|---|---|---|
Beginning balance |
$ | 3,948,487 | $ | 3,452,512 | $ | 3,121,576 | ||||
Acquisitions of operating properties |
26,887 | 187,052 | 119,249 | |||||||
Improvements and other additions |
304,079 | 338,358 | 211,752 | |||||||
Sales |
(75,315 | ) | (29,430 | ) | (65 | ) | ||||
Impairments |
(165,206 | ) | — | — | ||||||
Other |
— | (5 | ) | — | ||||||
Ending balance |
$ | 4,038,932 | $ | 3,948,487 | $ | 3,452,512 | ||||
The following table summarizes our changes in accumulated depreciation for the same time periods (in thousands):
| |
2011 | 2010 | 2009 | |||||||
|---|---|---|---|---|---|---|---|---|---|---|
Beginning balance |
$ | 503,032 | $ | 422,612 | $ | 343,110 | ||||
Depreciation expense |
99,173 | 88,048 | 79,650 | |||||||
Sales |
(9,640 | ) | (7,764 | ) | — | |||||
Impairments |
(15,039 | ) | — | — | ||||||
Other |
75 | 136 | (148 | ) | ||||||
Ending balance |
$ | 577,601 | $ | 503,032 | $ | 422,612 | ||||