Exhibit 99.1
Link to searchable text of slide shown above
Link to searchable text of slide shown above
Link to searchable text of slide shown above
Link to searchable text of slide shown above
Link to searchable text of slide shown above
Link to searchable text of slide shown above
Link to searchable text of slide shown above
Link to searchable text of slide shown above
Link to searchable text of slide shown above
Link to searchable text of slide shown above
Link to searchable text of slide shown above
Link to searchable text of slide shown above
Link to searchable text of slide shown above
Link to searchable text of slide shown above
Link to searchable text of slide shown above
Link to searchable text of slide shown above
Link to searchable text of slide shown above
Link to searchable text of slide shown above
Link to searchable text of slide shown above
Searchable text section of graphics shown above
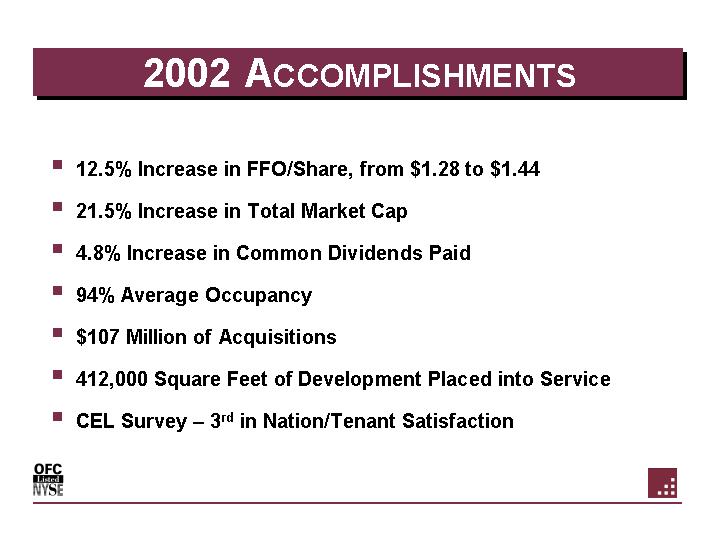
2002 ACCOMPLISHMENTS
• 12.5% Increase in FFO/Share, from $1.28 to $1.44
• 21.5% Increase in Total Market Cap
• 4.8% Increase in Common Dividends Paid
• 94% Average Occupancy
• $107 Million of Acquisitions
• 412,000 Square Feet of Development Placed into Service
• CEL Survey – 3rd in Nation/Tenant Satisfaction
[OFC LISTED NYSE LOGO]
|
|
|
|
|
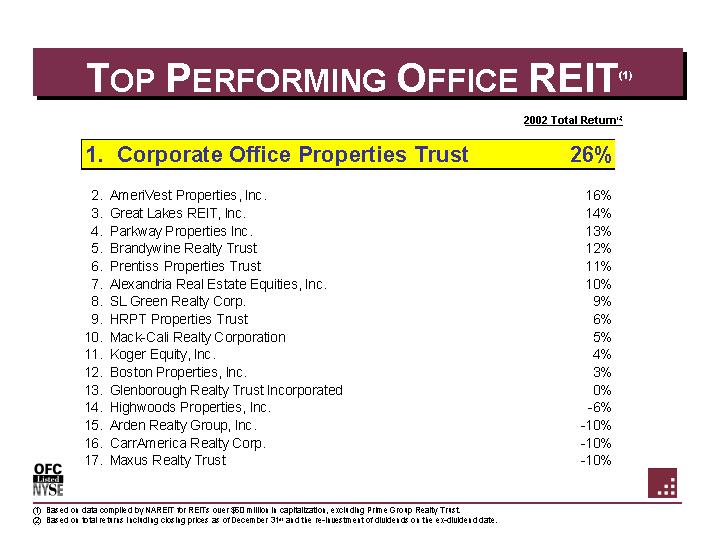
2002 Total Return(2) |
|
|
1. |
|
Corporate Office Properties Trust |
|
26 |
% |
|
2. |
|
AmeriVest Properties, Inc. |
|
16 |
% |
|
3. |
|
Great Lakes REIT, Inc. |
|
14 |
% |
|
4. |
|
Parkway Properties Inc. |
|
13 |
% |
|
5. |
|
Brandywine Realty Trust |
|
12 |
% |
|
6. |
|
Prentiss Properties Trust |
|
11 |
% |
|
7. |
|
Alexandria Real Estate Equities, Inc. |
|
10 |
% |
|
8. |
|
SL Green Realty Corp. |
|
9 |
% |
|
9. |
|
HRPT Properties Trust |
|
6 |
% |
|
10. |
|
Mack-Cali Realty Corporation |
|
5 |
% |
|
11. |
|
Koger Equity, Inc. |
|
4 |
% |
|
12. |
|
Boston Properties, Inc. |
|
3 |
% |
|
13. |
|
Glenborough Realty Trust Incorporated |
|
0 |
% |
|
14. |
|
Highwoods Properties, Inc. |
|
-6 |
% |
|
15. |
|
Arden Realty Group, Inc. |
|
-10 |
% |
|
16. |
|
CarrAmerica Realty Corp. |
|
-10 |
% |
|
17. |
|
Maxus Realty Trust |
|
-10 |
% |
(1) Based on data compiled by NAREIT for REITs over $50 million in capitalization, excluding Prime Group Realty Trust.
(2) Based on total returns including closing prices as of December 31st and the re-investment of dividends on the ex-dividend date.
2
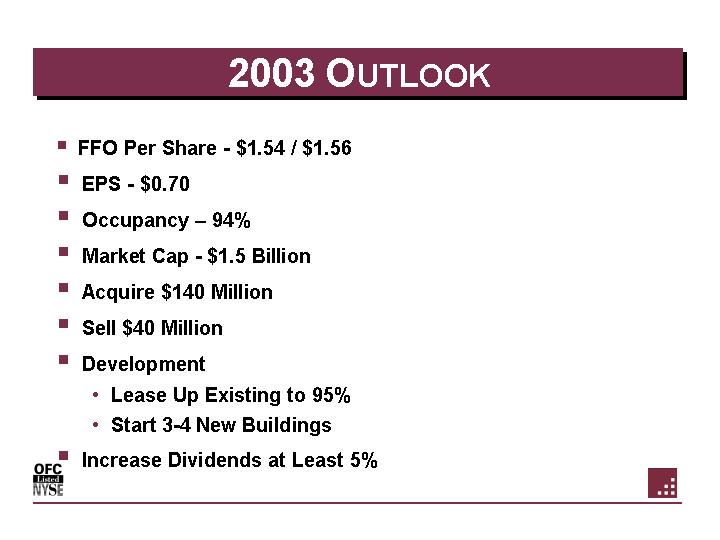
2003 OUTLOOK
• FFO Per Share - $1.54 / $1.56
• EPS - - $0.70
• Occupancy – 94%
• Market Cap - $1.5 Billion
• Acquire $140 Million
• Sell $40 Million
• Development
• Lease Up Existing to 95%
• Start 3-4 New Buildings
• Increase Dividends at Least 5%
3
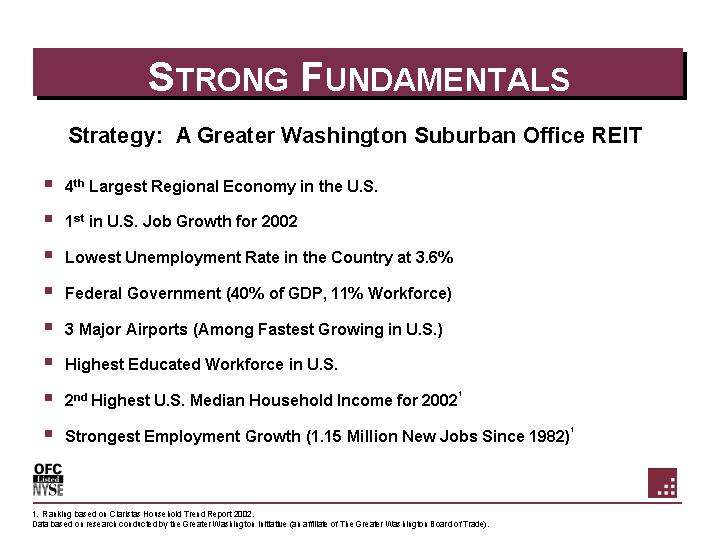
Strategy: A Greater Washington Suburban Office REIT
• 4th Largest Regional Economy in the U.S.
• 1st in U.S. Job Growth for 2002
• Lowest Unemployment Rate in the Country at 3.6%
• Federal Government (40% of GDP, 11% Workforce)
• 3 Major Airports (Among Fastest Growing in U.S.)
• Highest Educated Workforce in U.S.
• 2nd Highest U.S. Median Household Income for 2002(1)
• Strongest Employment Growth (1.15 Million New Jobs Since 1982)(1)
(1) Ranking based on Claristas Household Trend Report 2002.
Data based on research conducted by the Greater Washington Initiative (an affiliate of The Greater Washington Board of Trade).
4
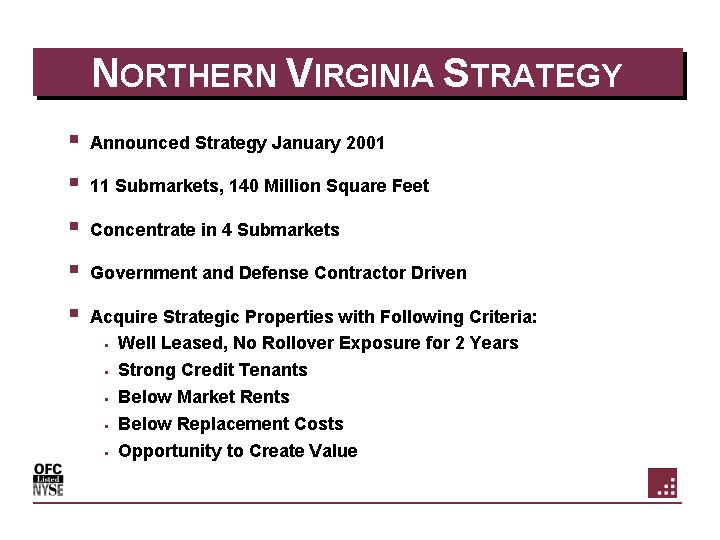
• Announced Strategy January 2001
• 11 Submarkets, 140 Million Square Feet
• Concentrate in 4 Submarkets
• Government and Defense Contractor Driven
• Acquire Strategic Properties with Following Criteria:
• Well Leased, No Rollover Exposure for 2 Years
• Strong Credit Tenants
• Below Market Rents
• Below Replacement Costs
• Opportunity to Create Value
5
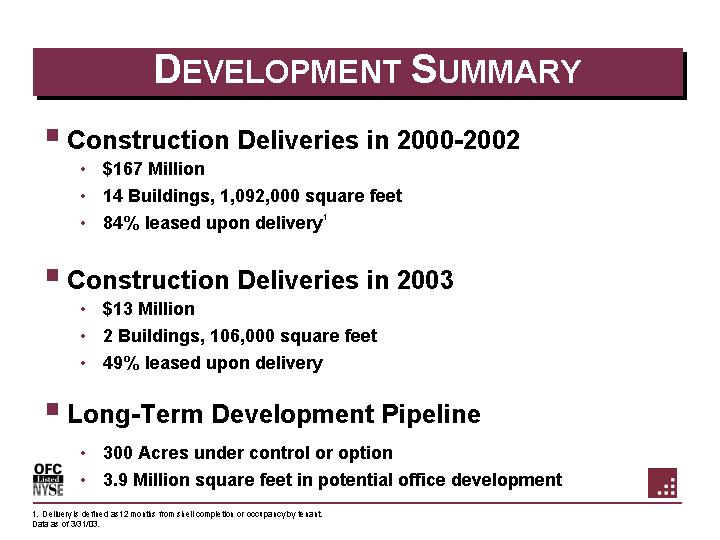
• Construction Deliveries in 2000-2002
• $167 Million
• 14 Buildings, 1,092,000 square feet
• 84% leased upon delivery(1)
• Construction Deliveries in 2003
• $13 Million
• 2 Buildings, 106,000 square feet
• 49% leased upon delivery
• Long-Term Development Pipeline
• 300 Acres under control or option
• 3.9 Million square feet in potential office development
(1) Delivery is defined as 12 months from shell completion or occupancy by tenant.
Data as of 3/31/03.
6
CORPORATE OFFICE SERVICES STRATEGY
• Provide Real Estate Services to Institutional Clients
• Capitalize on Existing Tenant Relationships
• Maximize Existing Management
• Generate Incremental Revenue/Profits
7
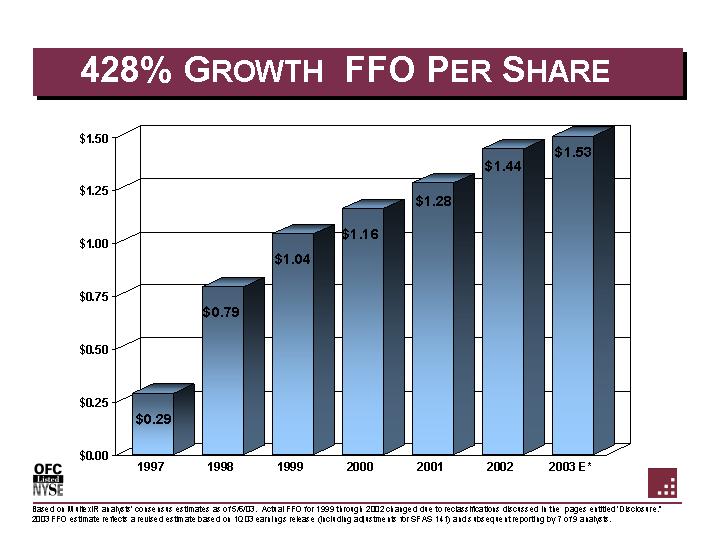
428% GROWTH FFO PER SHARE
[CHART]
|
|
|
1997 |
|
1998 |
|
1999 |
|
2000 |
|
2001 |
|
2002 |
|
2003 E* |
|
|||||||
|
FFO Per Share |
|
$ |
0.29 |
|
$ |
0.79 |
|
$ |
1.04 |
|
$ |
1.16 |
|
$ |
1.28 |
|
$ |
1.44 |
|
$ |
1.53 |
|
Based on MultexIR analysts’ consensus estimates as of 5/6/03. Actual FFO for 1999 through 2002 changed due to reclassifications discussed in the pages entitled ‘Disclosure.” 2003 FFO estimate reflects a revised estimate based on 1Q03 earnings release (including adjustments for SFAS 141) and subsequent reporting by 7 of 9 analysts.
8
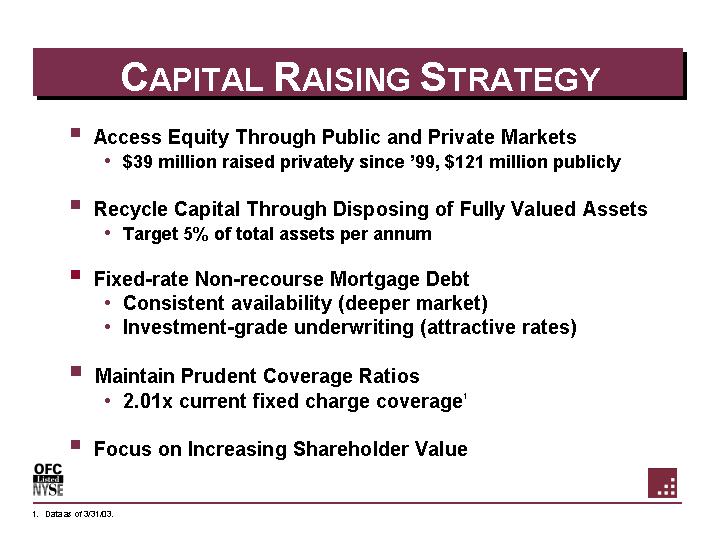
• Access Equity Through Public and Private Markets
• $39 million raised privately since ‘99, $121 million publicly
• Recycle Capital Through Disposing of Fully Valued Assets
• Target 5% of total assets per annum
• Fixed-rate Non-recourse Mortgage Debt
• Consistent availability (deeper market)
• Investment-grade underwriting (attractive rates)
• Maintain Prudent Coverage Ratios
• 2.01x current fixed charge coverage(1)
• Focus on Increasing Shareholder Value
(1) Data as of 3/31/03.
9
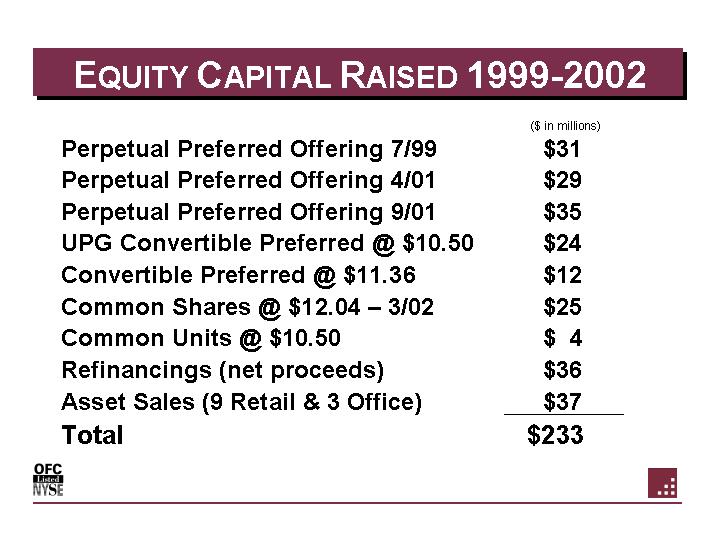
EQUITY CAPITAL RAISED 1999-2002
|
|
|
($ in millions) |
|
|
|
Perpetual Preferred Offering 7/99 |
|
$ |
31 |
|
|
Perpetual Preferred Offering 4/01 |
|
$ |
29 |
|
|
Perpetual Preferred Offering 9/01 |
|
$ |
35 |
|
|
UPG Convertible Preferred @ $10.50 |
|
$ |
24 |
|
|
Convertible Preferred @ $11.36 |
|
$ |
12 |
|
|
Common Shares @ $12.04 – 3/02 |
|
$ |
25 |
|
|
Common Units @ $10.50 |
|
$ |
4 |
|
|
Refinancings (net proceeds) |
|
$ |
36 |
|
|
Asset Sales (9 Retail & 3 Office) |
|
$ |
37 |
|
|
Total |
|
$ |
233 |
|
10
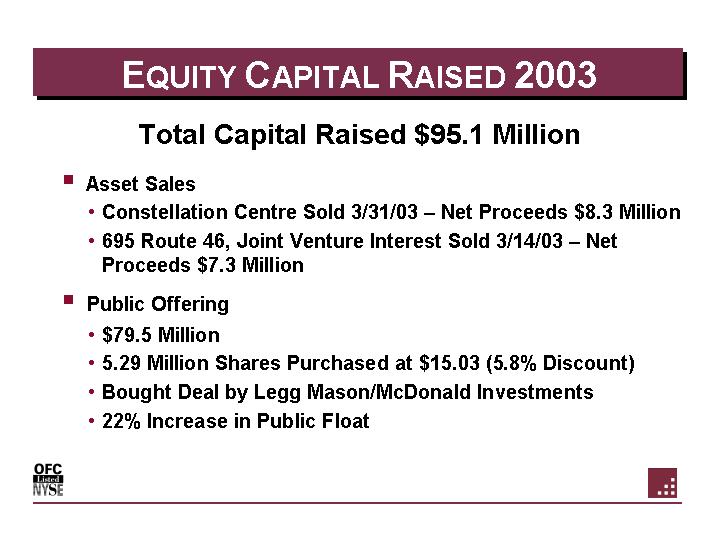
Total Capital Raised $95.1 Million
• Asset Sales
• Constellation Centre Sold 3/31/03 – Net Proceeds $8.3 Million
• 695 Route 46, Joint Venture Interest Sold 3/14/03 – Net Proceeds $7.3 Million
• Public Offering
• $79.5 Million
• 5.29 Million Shares Purchased at $15.03 (5.8% Discount)
• Bought Deal by Legg Mason/McDonald Investments
• 22% Increase in Public Float
11
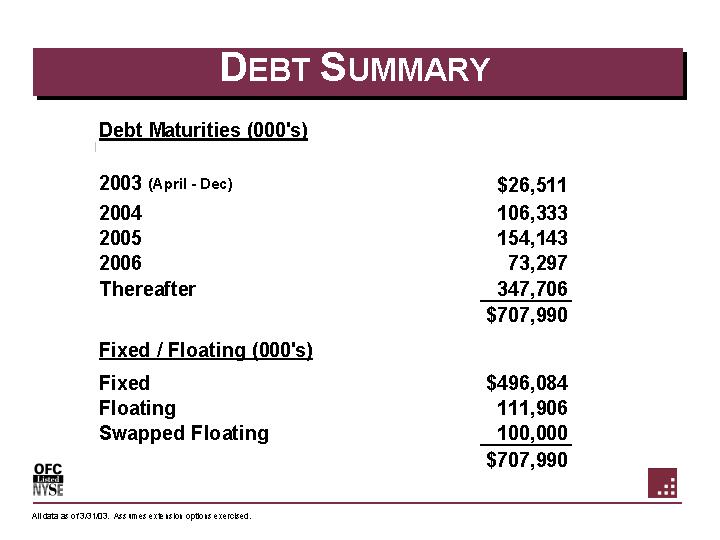
Debt Maturities (000’s)
|
2003 (April - Dec) |
|
$ |
26,511 |
|
|
2004 |
|
106,333 |
|
|
|
2005 |
|
154,143 |
|
|
|
2006 |
|
73,297 |
|
|
|
Thereafter |
|
347,706 |
|
|
|
|
|
$ |
707,990 |
|
Fixed / Floating (000’s)
|
Fixed |
|
$ |
496,084 |
|
|
Floating |
|
111,906 |
|
|
|
Swapped Floating |
|
100,000 |
|
|
|
|
|
$ |
707,990 |
|
All data as of 3/31/03. Assumes extension options exercised.
12
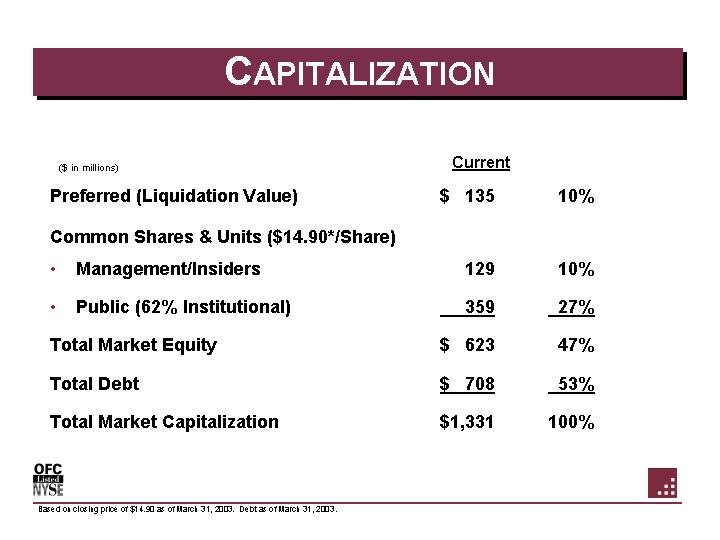
|
($ in millions) |
|
Current |
|
|
|
|
|
|
|
|
|
|
|
|
|
Preferred (Liquidation Value) |
|
$ |
135 |
|
10 |
% |
|
|
|
|
|
|
|
|
|
Common Shares & Units ($14.90*/Share) |
|
|
|
|
|
|
|
|
|
|
|
|
|
|
|
• Management/Insiders |
|
129 |
|
10 |
% |
|
|
|
|
|
|
|
|
|
|
• Public (62% Institutional) |
|
359 |
|
27 |
% |
|
|
|
|
|
|
|
|
|
|
Total Market Equity |
|
$ |
623 |
|
47 |
% |
|
|
|
|
|
|
|
|
|
Total Debt |
|
$ |
708 |
|
53 |
% |
|
|
|
|
|
|
|
|
|
Total Market Capitalization |
|
$ |
1,331 |
|
100 |
% |
Based on closing price of $14.90 as of March 31, 2003. Debt as of March 31, 2003.
13
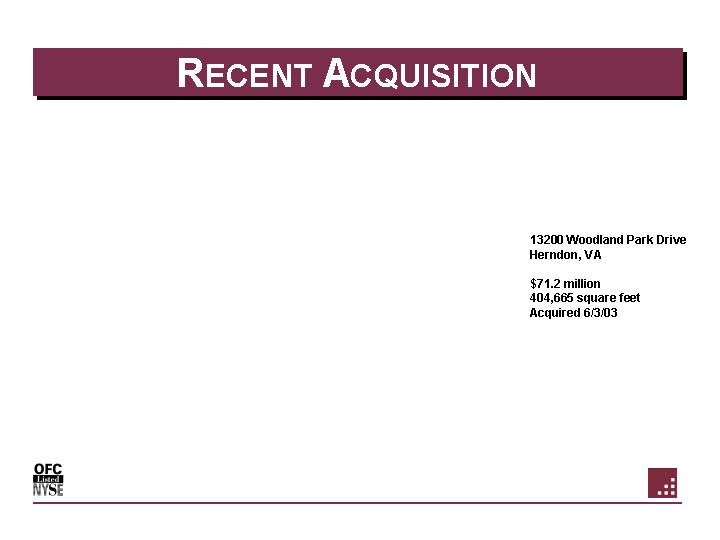
13200 Woodland Park Drive
Herndon, VA
$71.2 million
404,665 square feet
Acquired 6/3/03
14
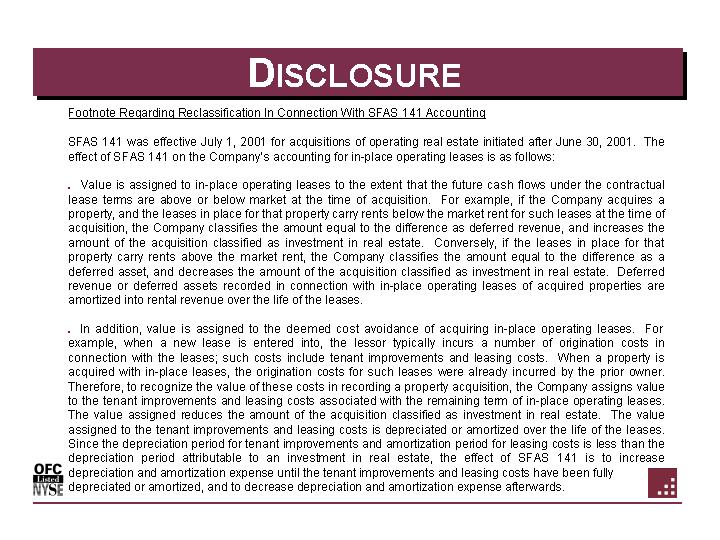
Footnote Regarding Reclassification In Connection With SFAS 141 Accounting
SFAS 141 was effective July 1, 2001 for acquisitions of operating real estate initiated after June 30, 2001. The effect of SFAS 141 on the Company’s accounting for in-place operating leases is as follows:
• Value is assigned to in-place operating leases to the extent that the future cash flows under the contractual lease terms are above or below market at the time of acquisition. For example, if the Company acquires a property, and the leases in place for that property carry rents below the market rent for such leases at the time of acquisition, the Company classifies the amount equal to the difference as deferred revenue, and increases the amount of the acquisition classified as investment in real estate. Conversely, if the leases in place for that property carry rents above the market rent, the Company classifies the amount equal to the difference as a deferred asset, and decreases the amount of the acquisition classified as investment in real estate. Deferred revenue or deferred assets recorded in connection with in-place operating leases of acquired properties are amortized into rental revenue over the life of the leases.
• In addition, value is assigned to the deemed cost avoidance of acquiring in-place operating leases. For example, when a new lease is entered into, the lessor typically incurs a number of origination costs in connection with the leases; such costs include tenant improvements and leasing costs. When a property is acquired with in-place leases, the origination costs for such leases were already incurred by the prior owner. Therefore, to recognize the value of these costs in recording a property acquisition, the Company assigns value to the tenant improvements and leasing costs associated with the remaining term of in-place operating leases. The value assigned reduces the amount of the acquisition classified as investment in real estate. The value assigned to the tenant improvements and leasing costs is depreciated or amortized over the life of the leases. Since the depreciation period for tenant improvements and amortization period for leasing costs is less than the depreciation period attributable to an investment in real estate, the effect of SFAS 141 is to increase depreciation and amortization expense until the tenant improvements and leasing costs have been fully depreciated or amortized, and to decrease depreciation and amortization expense afterwards.
15
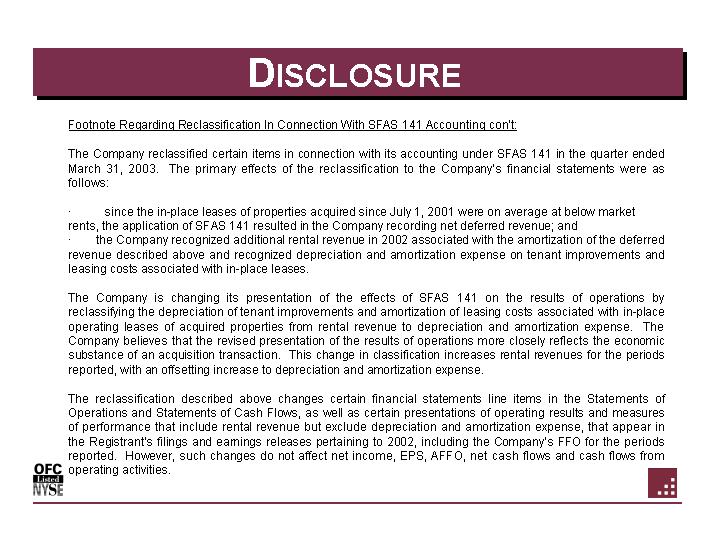
Footnote Regarding Reclassification In Connection With SFAS 141 Accounting con’t:
The Company reclassified certain items in connection with its accounting under SFAS 141 in the quarter ended March 31, 2003. The primary effects of the reclassification to the Company’s financial statements were as follows:
• since the in-place leases of properties acquired since July 1, 2001 were on average at below market rents, the application of SFAS 141 resulted in the Company recording net deferred revenue; and
• the Company recognized additional rental revenue in 2002 associated with the amortization of the deferred revenue described above and recognized depreciation and amortization expense on tenant improvements and leasing costs associated with in-place leases.
The Company is changing its presentation of the effects of SFAS 141 on the results of operations by reclassifying the depreciation of tenant improvements and amortization of leasing costs associated with in-place operating leases of acquired properties from rental revenue to depreciation and amortization expense. The Company believes that the revised presentation of the results of operations more closely reflects the economic substance of an acquisition transaction. This change in classification increases rental revenues for the periods reported, with an offsetting increase to depreciation and amortization expense.
The reclassification described above changes certain financial statements line items in the Statements of Operations and Statements of Cash Flows, as well as certain presentations of operating results and measures of performance that include rental revenue but exclude depreciation and amortization expense, that appear in the Registrant’s filings and earnings releases pertaining to 2002, including the Company’s FFO for the periods reported. However, such changes do not affect net income, EPS, AFFO, net cash flows and cash flows from operating activities.
16
DISCLOSURE
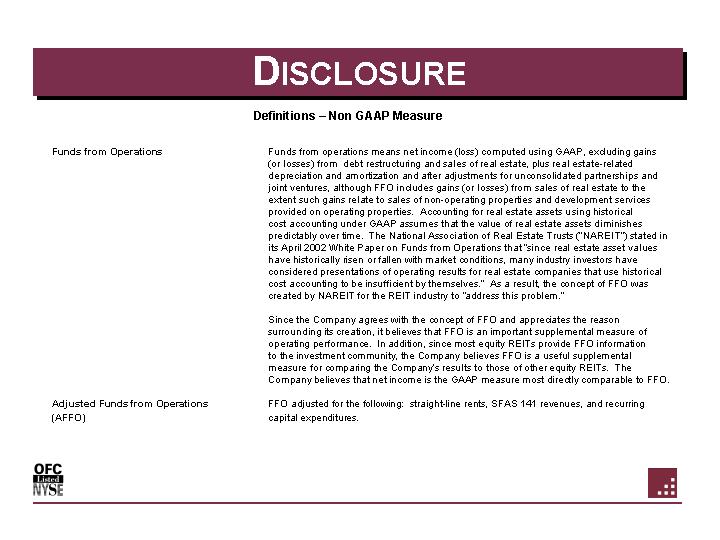
Definitions — Non GAAP Measure
|
Funds from Operations |
|
Funds from operations means net income (loss) computed using GAAP, excluding gains (or losses) from debt restructuring and sales of real estate, plus real estate-related depreciation and amortization and after adjustments for unconsolidated partnerships and joint ventures, although FFO includes gains (or losses) from sales of real estate to the extent such gains relate to sales of non-operating properties and development services provided on operating properties. Accounting for real estate assets using historical cost accounting under GAAP assumes that the value of real estate assets diminishes predictably over time. The National Association of Real Estate Trusts (“NAREIT”) stated in its April 2002 White Paper on Funds from Operations that “since real estate asset values have historically risen or fallen with market conditions, many industry investors have considered presentations of operating results for real estate companies that use historical cost accounting to be insufficient by themselves.” As a result,the concept of FFO was created by NAREIT for the REIT industry to “address this problem.” |
|
|
|
|
|
|
|
Since the Company agrees with the concept of FFO and appreciates the reason surrounding its creation, it believes that FFO is an important supplemental measure of operating performance. In addition, since most equity REITs provide FFO information to the investment community, the Company believes FFO is a useful supplemental measure for comparing the Company’s results to those of other equity REITs. The Company believes that net income is the GAAP measure most directly comparable to FFO. |
|
|
|
|
|
Adjusted Funds from
Operations |
|
FFO adjusted for the following: straight-line rents, SFAS 141 revenues, and recurring capital expenditures. |
|
|
|
|
17
DISCLOSURE
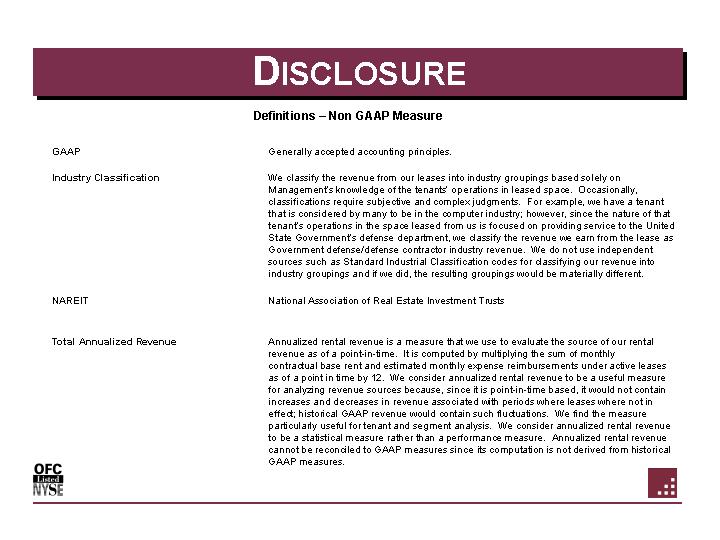
Definitions — Non GAAP Measure
|
GAAP |
|
Generally accepted accounting principles. |
|
|
|
|
|
Industry Classification |
|
We classify the revenue from our leases into industry groupings based solely on Management’s knowledge of the tenants’operations in leased space. Occasionally, classifications require subjective and complex judgments. For example, we have a tenant that is considered by many to be in the computer industry; however, since the nature of that tenant’s operations in the space leased from us is focused on providing service to the United State Government’s defense department, we classify the revenue we earn from the lease as Government defense/defense contractor industry revenue. We do not use independent sources such as Standard Industrial Classification codes for classifying our revenue into industry groupings and if we did, the resulting groupings would be materially different. |
|
|
|
|
|
NAREIT |
|
National Association of Real Estate Investment Trusts |
|
|
|
|
|
Total Annualized Revenue |
|
Annualized rental revenue is a measure that we use to evaluate the source of our rental revenue as of a point-in-time. It is computed by multiplying the sum of monthly contractual base rent and estimated monthly expense reimbursements under active leases as of a point in time by 12. We consider annualized rental revenue to be a useful measure for analyzing revenue sources because, since it is point-in-time based, it would not contain increases and decreases in revenue associated with periods where leases where not in effect; historical GAAP revenue would contain such fluctuations. We find the measure particularly useful for tenant and segment analysis. We consider annualized rental revenue to be a statistical measure rather than a performance measure. Annualized rental revenue cannot be reconciled to GAAP measures since its computation is not derived from historical GAAP measures. |
18
DISCLOSURE
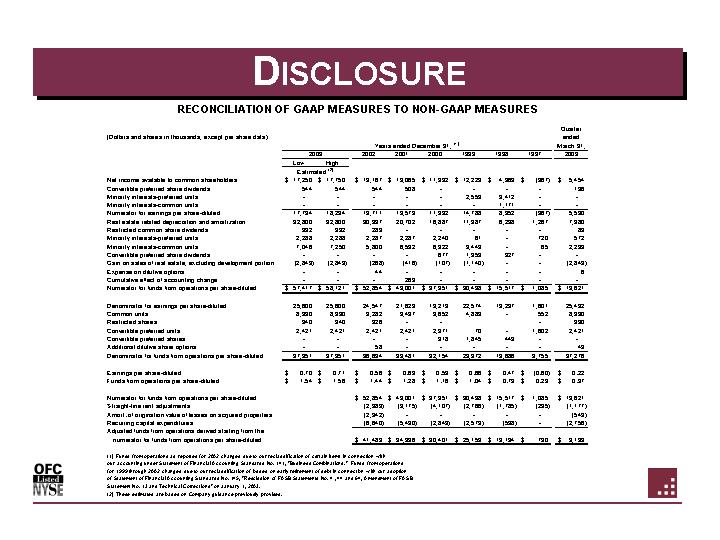
RECONCILIATION OF GAAP MEASURES TO NON-GAAP MEASURES
(Dollars and shares in thousands, except per share data)
|
|
|
Years ended December 31,(1) |
|
Quarter ended March 31, |
|
|||||||||||||||||||||||
|
|
|
2003 |
|
2002 |
|
2001 |
|
2000 |
|
1999 |
|
1998 |
|
1997 |
|
2003 |
|
|||||||||||
|
|
|
Low |
|
High |
|
|
|
|
|
|
|
|
|
|
|
|
|
|
|
|||||||||
|
|
|
Estimated(2) |
|
|
|
|
|
|
|
|
|
|
|
|
|
|
|
|||||||||||
|
Net income available to common shareholders |
|
$ |
17,250 |
|
$ |
17,750 |
|
$ |
13,167 |
|
$ |
13,065 |
|
$ |
11,332 |
|
$ |
12,229 |
|
$ |
4,369 |
|
$ |
(967 |
) |
$ |
5,454 |
|
|
Convertible preferred share dividends |
|
544 |
|
544 |
|
544 |
|
508 |
|
— |
|
— |
|
— |
|
— |
|
136 |
|
|||||||||
|
Minority interests-preferred units |
|
— |
|
— |
|
— |
|
— |
|
— |
|
2,559 |
|
3,412 |
|
— |
|
— |
|
|||||||||
|
Minority interests-common units |
|
— |
|
— |
|
— |
|
— |
|
— |
|
— |
|
1,171 |
|
— |
|
— |
|
|||||||||
|
Numerator for earnings per share-diluted |
|
17,794 |
|
18,294 |
|
13,711 |
|
13,573 |
|
11,332 |
|
14,788 |
|
8,952 |
|
(967 |
) |
5,590 |
|
|||||||||
|
Real estate related depreciation and amortization |
|
32,800 |
|
32,800 |
|
30,997 |
|
20,702 |
|
16,887 |
|
11,987 |
|
6,238 |
|
1,267 |
|
7,980 |
|
|||||||||
|
Restricted common share dividends |
|
332 |
|
332 |
|
283 |
|
— |
|
— |
|
— |
|
— |
|
— |
|
83 |
|
|||||||||
|
Minority interests-preferred units |
|
2,288 |
|
2,288 |
|
2,287 |
|
2,287 |
|
2,240 |
|
61 |
|
— |
|
720 |
|
572 |
|
|||||||||
|
Minority interests-common units |
|
7,046 |
|
7,250 |
|
5,800 |
|
6,592 |
|
6,322 |
|
3,449 |
|
— |
|
65 |
|
2,233 |
|
|||||||||
|
Convertible preferred share dividends |
|
— |
|
— |
|
— |
|
— |
|
677 |
|
1,353 |
|
327 |
|
— |
|
— |
|
|||||||||
|
Gain on sales of real estate, excluding development portion |
|
(2,843 |
) |
(2,843 |
) |
(268 |
) |
(416 |
) |
(107 |
) |
(1,140 |
) |
— |
|
— |
|
(2,843 |
) |
|||||||||
|
Expense on dilutive options |
|
— |
|
— |
|
44 |
|
— |
|
— |
|
— |
|
— |
|
— |
|
6 |
|
|||||||||
|
Cumulative effect of accounting change |
|
— |
|
— |
|
— |
|
263 |
|
— |
|
— |
|
— |
|
— |
|
— |
|
|||||||||
|
Numerator for funds from operations per share-diluted |
|
$ |
57,417 |
|
$ |
58,121 |
|
$ |
52,854 |
|
$ |
43,001 |
|
$ |
37,351 |
|
$ |
30,498 |
|
$ |
15,517 |
|
$ |
1,085 |
|
$ |
13,621 |
|
|
|
|
|
|
|
|
|
|
|
|
|
|
|
|
|
|
|
|
|
|
|||||||||
|
Denominator for earnings per share-diluted |
|
25,600 |
|
25,600 |
|
24,547 |
|
21,623 |
|
19,213 |
|
22,574 |
|
19,237 |
|
1,601 |
|
25,492 |
|
|||||||||
|
Common units |
|
8,990 |
|
8,990 |
|
9,282 |
|
9,437 |
|
9,652 |
|
4,883 |
|
— |
|
552 |
|
8,990 |
|
|||||||||
|
Restricted shares |
|
340 |
|
340 |
|
326 |
|
— |
|
— |
|
|
|
|
|
— |
|
330 |
|
|||||||||
|
Convertible preferred units |
|
2,421 |
|
2,421 |
|
2,421 |
|
2,421 |
|
2,371 |
|
70 |
|
— |
|
1,602 |
|
2,421 |
|
|||||||||
|
Convertible preferred shares |
|
— |
|
— |
|
— |
|
— |
|
918 |
|
1,845 |
|
449 |
|
— |
|
— |
|
|||||||||
|
Additional dilutive share options |
|
— |
|
— |
|
58 |
|
— |
|
— |
|
— |
|
— |
|
— |
|
43 |
|
|||||||||
|
Denominator for funds from operations per share-diluted |
|
37,351 |
|
37,351 |
|
36,634 |
|
33,481 |
|
32,154 |
|
29,372 |
|
19,686 |
|
3,755 |
|
37,276 |
|
|||||||||
|
|
|
|
|
|
|
|
|
|
|
|
|
|
|
|
|
|
|
|
|
|||||||||
|
Earnings per share-diluted |
|
$ |
0.70 |
|
$ |
0.71 |
|
$ |
0.56 |
|
$ |
0.63 |
|
$ |
0.59 |
|
$ |
0.66 |
|
$ |
0.47 |
|
$ |
(0.60 |
) |
$ |
0.22 |
|
|
Funds from operations per share-diluted |
|
$ |
1.54 |
|
$ |
1.56 |
|
$ |
1.44 |
|
$ |
1.28 |
|
$ |
1.16 |
|
$ |
1.04 |
|
$ |
0.79 |
|
$ |
0.29 |
|
$ |
0.37 |
|
|
|
|
|
|
|
|
|
|
|
|
|
|
|
|
|
|
|
|
|
|
|||||||||
|
Numerator for funds from operations per share-diluted |
|
|
|
|
|
$ |
52,854 |
|
$ |
43,001 |
|
$ |
37,351 |
|
$ |
30,498 |
|
$ |
15,517 |
|
$ |
1,085 |
|
$ |
13,621 |
|
||
|
Straight-line rent adjustments |
|
|
|
|
|
(2,389 |
) |
(3,175 |
) |
(4,107 |
) |
(2,766 |
) |
(1,785 |
) |
(295 |
) |
(1,177 |
) |
|||||||||
|
Amort. of origination value of leases on acquired properties |
|
|
|
|
|
(2,342 |
) |
— |
|
— |
|
— |
|
— |
|
— |
|
(549 |
) |
|||||||||
|
Recurring capital expenditures |
|
|
|
|
|
(6,640 |
) |
(5,430 |
) |
(2,843 |
) |
(2,579 |
) |
(538 |
) |
— |
|
(2,756 |
) |
|||||||||
|
Adjusted funds from operations derived starting from the numerator for funds from operations per share-diluted |
|
|
|
|
|
$ |
41,483 |
|
$ |
34,396 |
|
$ |
30,401 |
|
$ |
25,153 |
|
$ |
13,194 |
|
$ |
790 |
|
$ |
9,139 |
|
||
(1) Funds from operations as reported for 2002 changed due to our reclassification of certain items in connection with our accounting under Statement of Financial Accounting Standards No. 141, “Business Combinations.” Funds from operations for 1999 through 2002 changed due to our reclassification of losses on early retirement of debt in connection with our adoption of Statement of Financial Accounting Standards No. 145, “Rescission of FASB Statements No. 4 , 44 and 64, Amendment of FASB Statement No. 13 and Technical Corrections” on January 1, 2003.
(2) These estimates are based on Company guidance previously provided.
19