Exhibit 99.1

Link to searchable text of slide shown above

Link to searchable text of slide shown above
Link to searchable text of slide shown above

Link to searchable text of slide shown above

Link to searchable text of slide shown above
Link to searchable text of slide shown above
Link to searchable text of slide shown above

Link to searchable text of slide shown above
Link to searchable text of slide shown above

Link to searchable text of slide shown above
Searchable text section of graphics shown above
• New York Stock Exchange REIT (symbol “OFC”)
• Class A Suburban Office (113 properties, 9.5 mm s.f.)(1)
• Mid-Atlantic Focus (largest in B/W Corridor)
• $1.3 Billion in Total Market Capitalization(2)
• 7.6% FFO Growth For 2003 ($1.55 per share)(3)
• 25% EPS Growth For 2003(4)
• Secure 5.2% Dividend Yield (58% FFO pay out ratio)(1)
|
[LOGO] |
|
[GRAPHIC] |
(1) Data as of 6/17/03.
(2) Data as of 3/31/03.
(3) Based on (i) 2003 FFO estimate from MultexIR as of 6/17/03 and (ii) actual 2002 FFO of $1.44/share as adjusted for SFAS 141.
(4) Based on Company estimate for 2003 EPS and actual EPS for 2002. See Disclosure for more detail.
1
STRONG OUTLOOK
FFO Per Share Growth
[CHART]
|
|
|
2001 |
|
2002 |
|
2003 |
|
|
NAREIT Average Office(1) |
|
7.6 |
% |
1.0 |
% |
-4.7 |
% |
|
OFC(2) |
|
10.3 |
% |
12.5 |
% |
7.6 |
% |
(1) Based on actual FFO for 2002 and First Call Estimates for 2003 as of 6/17/03. Data provided by Fact Set.
(2) Based on actual FFO for 2000, 2001 and 2002 subsequent to adjustment for SFAS 141, of $1.16, $1.28 and $1.44 per share respectively; and MultexIR for 2003 estimate as of 6/17/03.
2
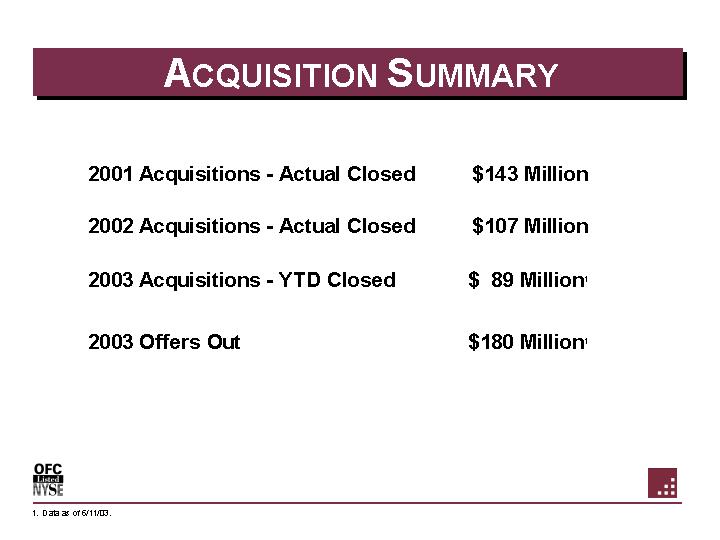
ACQUISITION SUMMARY
|
2001 Acquisitions - Actual Closed |
|
$ |
143 Million |
|
|
|
|
|
|
|
|
2002 Acquisitions - Actual Closed |
|
$ |
107 Million |
|
|
|
|
|
|
|
|
2003 Acquisitions - YTD Closed |
|
$ |
89 Million |
(1) |
|
|
|
|
|
|
|
2003 Offers Out |
|
$ |
180 Million |
(1) |
(1) Data as of 6/11/03.
3
434% GROWTH FFO PER SHARE
[CHART]
|
|
|
1997 |
|
1998 |
|
1999 |
|
2000 |
|
2001 |
|
2002 |
|
2003 E* |
|
|||||||
|
FFO Per Share |
|
$ |
0.29 |
|
$ |
0.79 |
|
$ |
1.04 |
|
$ |
1.16 |
|
$ |
1.28 |
|
$ |
1.44 |
|
$ |
1.55 |
|
* Based on MultexIR analysts’ consensus estimates as of 6/17/03. Actual FFO for 1999 through 2002 changed due to reclassifications discussed in the pages entitled “Disclosure.” 2003 FFO estimate reflects a revised estimate based on 1Q03 earnings release (including adjustments for SFAS 141) and subsequent reporting by 8 of 9 analysts.
4
217% GROWTH EPS PER SHARE
[CHART]
|
|
|
1997 |
|
1998 |
|
1999 |
|
2000 |
|
2001 |
|
2002 |
|
2003 E* |
|
|||||||
|
EPS Per Share |
|
$ |
(0.60 |
) |
$ |
0.47 |
|
$ |
0.66 |
|
$ |
0.59 |
|
$ |
0.63 |
|
$ |
0.56 |
|
$ |
0.70 |
|
* 2003 EPS estimate reflects the Company's guidance previously provided.
5
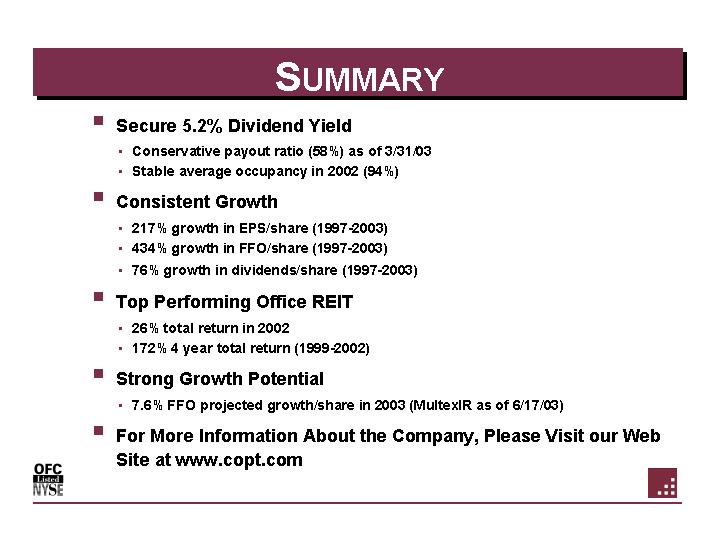
SUMMARY
• Secure 5.2% Dividend Yield
• Conservative payout ratio (58%) as of 3/31/03
• Stable average occupancy in 2002 (94%)
• Consistent Growth
• 217% growth in EPS/share (1997-2003)
• 434% growth in FFO/share (1997-2003)
• 76% growth in dividends/share (1997-2003)
• Top Performing Office REIT
• 26% total return in 2002
• 172% 4 year total return (1999-2002)
• Strong Growth Potential
• 7.6% FFO projected growth/share in 2003 (MultexIR as of 6/17/03)
• For More Information About the Company, Please Visit our Web Site at www.copt.com
6
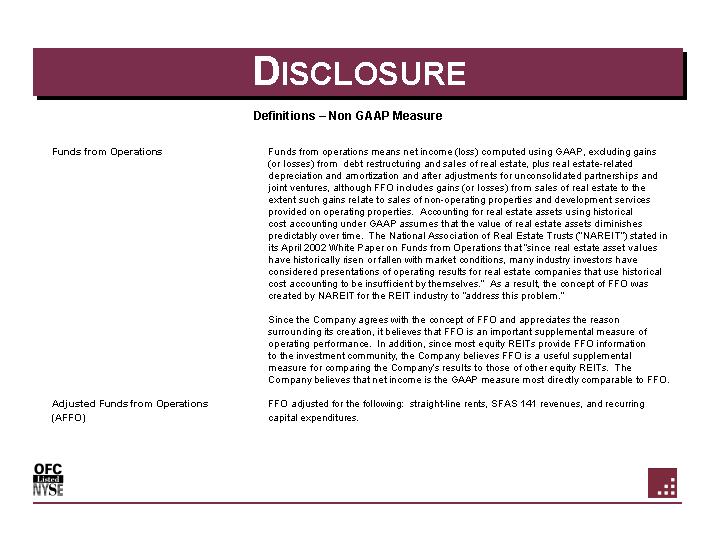
DISCLOSURE
Definitions – Non GAAP Measure
|
Funds from Operations |
|
Funds from operations means net income (loss) computed using GAAP, excluding gains (or losses) from debt restructuring and sales of real estate, plus real estate-related depreciation and amortization and after adjustments for unconsolidated partnerships and joint ventures, although FFO includes gains (or losses) from sales of real estate to the extent such gains relate to sales of non-operating properties and development services provided on operating properties. Accounting for real estate assets using historical cost accounting under GAAP assumes that the value of real estate assets diminishes predictably over time. The National Association of Real Estate Trusts (“NAREIT”) stated in its April 2002 White Paper on Funds from Operations that “since real estate asset values have historically risen or fallen with market conditions, many industry investors have considered presentations of operating results for real estate companies that use historical cost accounting to be insufficient by themselves.” As a result, the concept of FFO was created by NAREIT for the REIT industry to “address this problem.” |
|
|
|
|
|
|
|
Since the Company agrees with the concept of FFO and appreciates the reason surrounding its creation, it believes that FFO is an important supplemental measure of operating performance. In addition, since most equity REITs provide FFO information to the investment community, the Company believes FFO is a useful supplemental measure for comparing the Company’s results to those of other equity REITs. The Company believes that net income is the GAAP measure most directly comparable to FFO. |
|
|
|
|
|
Adjusted Funds from
Operations |
|
FFO adjusted for the following: straight-line rents, SFAS 141 revenues, and recurring capital expenditures. |
7
DISCLOSURE
Definitions – Non GAAP Measure
|
|
Generally accepted accounting principles. |
|
|
|
|
|
|
Industry Classification |
|
We classify the revenue from our leases into industry groupings based solely on Management’s knowledge of the tenants’ operations in leased space. Occasionally, classifications require subjective and complex judgments. For example, we have a tenant that is considered by many to be in the computer industry; however, since the nature of that tenant’s operations in the space leased from us is focused on providing service to the United State Government’s defense department, we classify the revenue we earn from the lease as Government defense/defense contractor industry revenue. We do not use independent sources such as Standard Industrial Classification codes for classifying our revenue into industry groupings and if we did, the resulting groupings would be materially different. |
|
|
|
|
|
NAREIT |
|
National Association of Real Estate Investment Trusts |
|
|
|
|
|
Total Annualized Revenue |
|
Annualized rental revenue is a measure that we use to evaluate the source of our rental revenue as of a point-in-time. It is computed by multiplying the sum of monthly contractual base rent and estimated monthly expense reimbursements under active leases as of a point in time by 12. We consider annualized rental revenue to be a useful measure for analyzing revenue sources because, since it is point-in-time based, it would not contain increases and decreases in revenue associated with periods where leases where not in effect; historical GAAP revenue would contain such fluctuations. We find the measure particularly useful for tenant and segment analysis. We consider annualized rental revenue to be a statistical measure rather than a performance measure. Annualized rental revenue cannot be reconciled to GAAP measures since its computation is not derived from historical GAAP measures. |
8
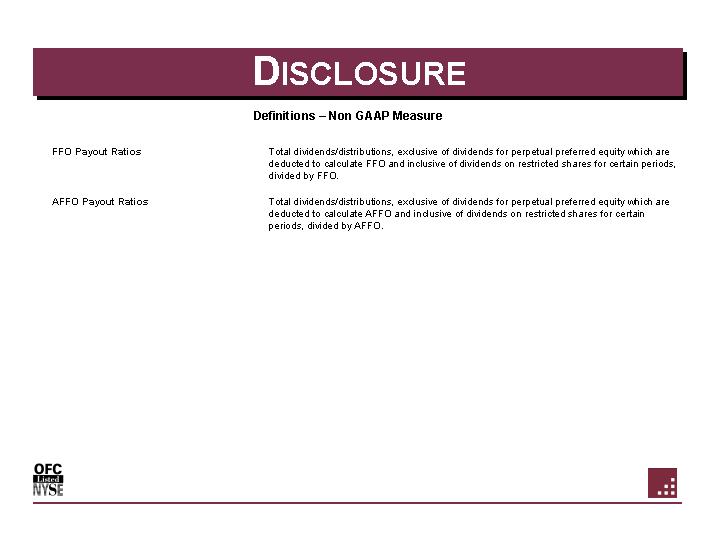
DISCLOSURE
Definitions – Non GAAP Measure
|
|
Total dividends/distributions, exclusive of dividends for perpetual preferred equity which are deducted to calculate FFO and inclusive of dividends on restricted shares for certain periods, divided by FFO. |
|
|
|
|
|
|
AFFO Payout Ratios |
|
Total dividends/distributions, exclusive of dividends for perpetual preferred equity which are deducted to calculate AFFO and inclusive of dividends on restricted shares for certain periods, divided by AFFO. |
9
DISCLOSURE
RECONCILIATION OF GAAP MEASURES TO NON-GAAP MEASURES
|
(Dollars and shares in thousands, except per share data) |
|
Years ended December 31,(1) |
|
Quarter |
|
|||||||||||||||||||||||
|
|
|
2003 |
|
2002 |
|
2001 |
|
2000 |
|
1999 |
|
1998 |
|
1997 |
|
2003 |
|
|||||||||||
|
|
|
Low |
|
High |
|
|
|
|
|
|
|
|
|
|
|
|
|
|
|
|||||||||
|
|
|
Estimated(2) |
|
|
|
|
|
|
|
|
|
|
|
|
|
|
|
|||||||||||
|
Net income available to common shareholders |
|
$ |
17,250 |
|
$ |
17,750 |
|
$ |
13,167 |
|
$ |
13,065 |
|
$ |
11,332 |
|
$ |
12,229 |
|
$ |
4,369 |
|
$ |
(967 |
) |
$ |
5,454 |
|
|
Convertible preferred share dividends |
|
544 |
|
544 |
|
544 |
|
508 |
|
— |
|
— |
|
— |
|
— |
|
136 |
|
|||||||||
|
Minority interests-preferred units |
|
— |
|
— |
|
— |
|
— |
|
— |
|
2,559 |
|
3,412 |
|
— |
|
— |
|
|||||||||
|
Minority interests-common units |
|
— |
|
— |
|
— |
|
— |
|
— |
|
— |
|
1,171 |
|
— |
|
— |
|
|||||||||
|
Numerator for earnings per share-diluted |
|
17,794 |
|
18,294 |
|
13,711 |
|
13,573 |
|
11,332 |
|
14,788 |
|
8,952 |
|
(967 |
) |
5,590 |
|
|||||||||
|
Real estate related depreciation and amortization |
|
32,800 |
|
32,800 |
|
30,997 |
|
20,702 |
|
16,887 |
|
11,987 |
|
6,238 |
|
1,267 |
|
7,980 |
|
|||||||||
|
Restricted common share dividends |
|
332 |
|
332 |
|
283 |
|
— |
|
— |
|
— |
|
— |
|
— |
|
83 |
|
|||||||||
|
Minority interests-preferred units |
|
2,288 |
|
2,288 |
|
2,287 |
|
2,287 |
|
2,240 |
|
61 |
|
— |
|
720 |
|
572 |
|
|||||||||
|
Minority interests-common units |
|
7,046 |
|
7,250 |
|
5,800 |
|
6,592 |
|
6,322 |
|
3,449 |
|
— |
|
65 |
|
2,233 |
|
|||||||||
|
Convertible preferred share dividends |
|
— |
|
— |
|
— |
|
— |
|
677 |
|
1,353 |
|
327 |
|
— |
|
— |
|
|||||||||
|
Gain on sales of real estate, excluding development portion |
|
(2,843 |
) |
(2,843 |
) |
(268 |
) |
(416 |
) |
(107 |
) |
(1,140 |
) |
— |
|
— |
|
(2,843 |
) |
|||||||||
|
Expense on dilutive options |
|
— |
|
— |
|
44 |
|
— |
|
— |
|
— |
|
— |
|
— |
|
6 |
|
|||||||||
|
Cumulative effect of accounting change |
|
— |
|
— |
|
— |
|
263 |
|
— |
|
— |
|
— |
|
— |
|
— |
|
|||||||||
|
Numerator for funds from operations per share-diluted |
|
$ |
57,417 |
|
$ |
58,121 |
|
$ |
52,854 |
|
$ |
43,001 |
|
$ |
37,351 |
|
$ |
30,498 |
|
$ |
15,517 |
|
$ |
1,085 |
|
$ |
13,621 |
|
|
|
|
|
|
|
|
|
|
|
|
|
|
|
|
|
|
|
|
|
|
|||||||||
|
Denominator for earnings per share-diluted |
|
25,600 |
|
25,600 |
|
24,547 |
|
21,623 |
|
19,213 |
|
22,574 |
|
19,237 |
|
1,601 |
|
25,492 |
|
|||||||||
|
Common units |
|
8,990 |
|
8,990 |
|
9,282 |
|
9,437 |
|
9,652 |
|
4,883 |
|
— |
|
552 |
|
8,990 |
|
|||||||||
|
Restricted shares |
|
340 |
|
340 |
|
326 |
|
— |
|
— |
|
|
|
|
|
— |
|
330 |
|
|||||||||
|
Convertible preferred units |
|
2,421 |
|
2,421 |
|
2,421 |
|
2,421 |
|
2,371 |
|
70 |
|
— |
|
1,602 |
|
2,421 |
|
|||||||||
|
Convertible preferred shares |
|
— |
|
— |
|
— |
|
— |
|
918 |
|
1,845 |
|
449 |
|
— |
|
— |
|
|||||||||
|
Additional dilutive share options |
|
— |
|
— |
|
58 |
|
— |
|
— |
|
— |
|
— |
|
— |
|
43 |
|
|||||||||
|
Denominator for funds from operations per share-diluted |
|
37,351 |
|
37,351 |
|
36,634 |
|
33,481 |
|
32,154 |
|
29,372 |
|
19,686 |
|
3,755 |
|
37,276 |
|
|||||||||
|
|
|
|
|
|
|
|
|
|
|
|
|
|
|
|
|
|
|
|
|
|||||||||
|
Earnings per share-diluted |
|
$ |
0.70 |
|
$ |
0.71 |
|
$ |
0.56 |
|
$ |
0.63 |
|
$ |
0.59 |
|
$ |
0.66 |
|
$ |
0.47 |
|
$ |
(0.60 |
) |
$ |
0.22 |
|
|
Funds from operations per share-diluted |
|
$ |
1.54 |
|
$ |
1.56 |
|
$ |
1.44 |
|
$ |
1.28 |
|
$ |
1.16 |
|
$ |
1.04 |
|
$ |
0.79 |
|
$ |
0.29 |
|
$ |
0.37 |
|
|
|
|
|
|
|
|
|
|
|
|
|
|
|
|
|
|
|
|
|
|
|||||||||
|
Numerator for funds from operations per share-diluted |
|
|
|
|
|
$ |
52,854 |
|
$ |
43,001 |
|
$ |
37,351 |
|
$ |
30,498 |
|
$ |
15,517 |
|
$ |
1,085 |
|
$ |
13,621 |
|
||
|
Straight-line rent adjustments |
|
|
|
|
|
(2,389 |
) |
(3,175 |
) |
(4,107 |
) |
(2,766 |
) |
(1,785 |
) |
(295 |
) |
(1,177 |
) |
|||||||||
|
Amort. of origination value of leases on acquired properties |
|
|
|
|
|
(2,342 |
) |
— |
|
— |
|
— |
|
— |
|
— |
|
(549 |
) |
|||||||||
|
Recurring capital expenditures |
|
|
|
|
|
(6,640 |
) |
(5,430 |
) |
(2,843 |
) |
(2,579 |
) |
(538 |
) |
— |
|
(2,756 |
) |
|||||||||
|
Adjusted funds from operations derived starting from the numerator for funds from operations per share-diluted |
|
|
|
|
|
$ |
41,483 |
|
$ |
34,396 |
|
$ |
30,401 |
|
$ |
25,153 |
|
$ |
13,194 |
|
$ |
790 |
|
$ |
9,139 |
|
||
(1) Funds from operations as reported for 2002 changed due to our reclassification of certain items in connection with our accounting under Statement of Financial Accounting Standards No. 141, “Business Combinations.” Funds from operations for 1999 through 2002 changed due to our reclassification of losses on early retirement of debt in connection with our adoption of Statement of Financial Accounting Standards No. 145, “Rescission of FASB Statements No. 4 , 44 and 64, Amendment of FASB Statement No. 13 and Technical Corrections” on January 1, 2003.
(2) These estimates are based on Company guidance previously provided.
10