
1 Safe Harbor Safe Harbor Unless otherwise noted, information in this presentation represents the Company’s consolidated portfolio as of or for the quarter ended June 30 , 2020 . This presentation may contain “forward - looking” statements, as defined in Section 27 A of the Securities Act of 1933 and Section 21 E of the Securities Exchange Act of 1934 , that are based on the Company’s current expectations, estimates and projections about future events and financial trends affecting the Company . These statements may include, without limitation, statements regarding : our belief that we are well - positioned to maintain relatively normal operations through the COVID - 19 crisis ; our expectations as to renewal leasing, rent relief requests, development leasing and development projects ; our liquidity situation ; and our dividend . Forward - looking statements are inherently subject to risks and uncertainties, many of which the Company cannot anticipate or predict with accuracy . Although the Company believes that expectations, estimates and projections reflected in such forward - looking statements are based on reasonable assumptions at the time made, the Company can give no assurance that these expectations, estimates and projections will be achieved . Future events and actual results may differ materially from those discussed in the forward - looking statements and the Company undertakes no obligation to update or supplement any forward - looking statements . The areas of risk that may affect these expectations, estimates and projections include, but are not limited to, those risks described in Item 1 A of the Company’s Annual Report on Form 10 - K for the year ended December 31 , 2019 and Quarterly Reports on Form 10 - Q for the quarters ended March 31 , 2020 and June 30 , 2020 .
2 Exhibit 99.1 Corporate Office Properties Trust Supplemental Operating and Financial Information
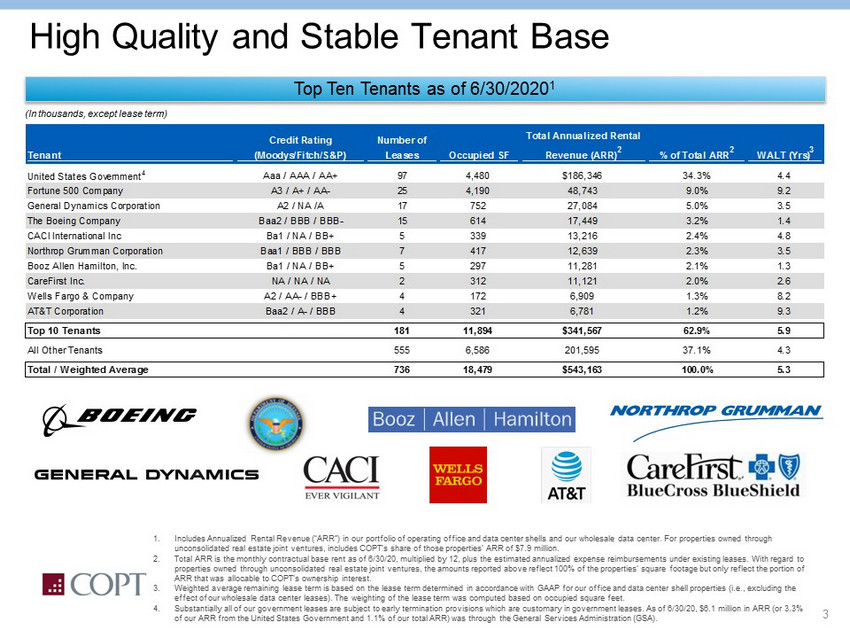
3 High Quality and Stable Tenant Base Top Ten Tenants as of 6/30/2020 1 (In thousands, except lease term) Tenant Credit Rating (Moodys/Fitch/S&P) Number of Leases Occupied SF Total Annualized Rental Revenue (ARR) 2 % of Total ARR 2 WALT (Yrs) 3 United States Government 4 Aaa / AAA / AA+ 97 4,480 $186,346 34.3% 4.4 Fortune 500 Company A3 / A+ / AA- 25 4,190 48,743 9.0% 9.2 General Dynamics Corporation A2 / NA /A 17 752 27,084 5.0% 3.5 The Boeing Company Baa2 / BBB / BBB- 15 614 17,449 3.2% 1.4 CACI International Inc Ba1 / NA / BB+ 5 339 13,216 2.4% 4.8 Northrop Grumman Corporation Baa1 / BBB / BBB 7 417 12,639 2.3% 3.5 Booz Allen Hamilton, Inc. Ba1 / NA / BB+ 5 297 11,281 2.1% 1.3 CareFirst Inc. NA / NA / NA 2 312 11,121 2.0% 2.6 Wells Fargo & Company A2 / AA- / BBB+ 4 172 6,909 1.3% 8.2 AT&T Corporation Baa2 / A- / BBB 4 321 6,781 1.2% 9.3 Top 10 Tenants 181 11,894 $341,567 62.9% 5.9 All Other Tenants 555 6,586 201,595 37.1% 4.3 Total / Weighted Average 736 18,479 $543,163 100.0% 5.3 1. Includes Annualized Rental Revenue (“ARR”) in our portfolio of operating office and data center shells and our wholesale data ce nter. For properties owned through unconsolidated real estate joint ventures, includes COPT’s share of those properties’ ARR of $7.9 million. 2. Total ARR is the monthly contractual base rent as of 6/30/20, multiplied by 12, plus the estimated annualized expense reimbur sem ents under existing leases. With regard to properties owned through unconsolidated real estate joint ventures, the amounts reported above reflect 100% of the properties ’ s quare footage but only reflect the portion of ARR that was allocable to COPT’s ownership interest. 3. Weighted average remaining lease term is based on the lease term determined in accordance with GAAP for our office and data c ent er shell properties (i.e., excluding the effect of our wholesale data center leases). The weighting of the lease term was computed based on occupied square feet. 4. Substantially all of our government leases are subject to early termination provisions which are customary in government leas es. As of 6/30/20, $6.1 million in ARR (or 3.3% of our ARR from the United States Government and 1.1% of our total ARR) was through the General Services Administration (GSA) .
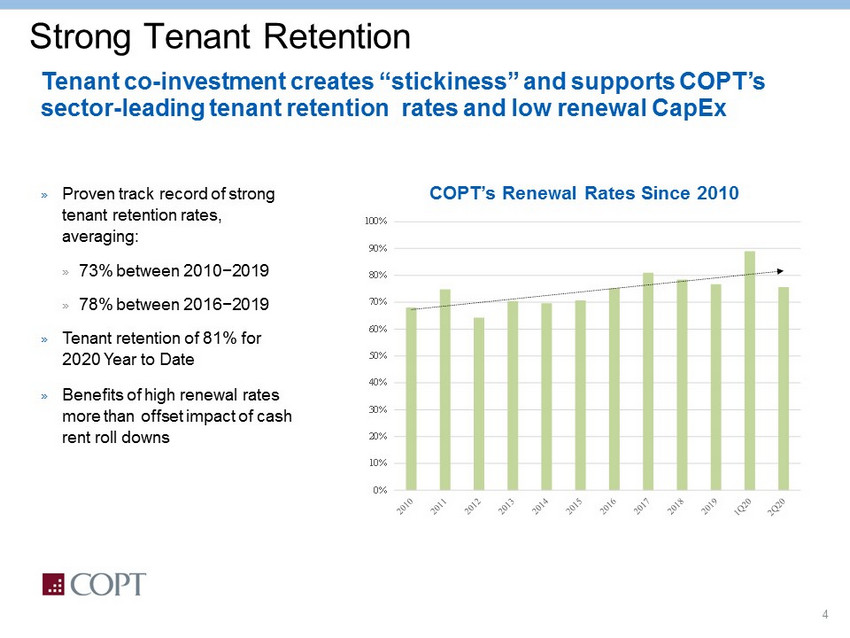
4 Tenant co - investment creates “stickiness” and supports COPT’s sector - leading tenant retention rates and low renewal CapEx Strong Tenant Retention » Proven track record of strong tenant retention rates, averaging: » 73% between 2010−2019 » 78% between 2016−2019 » Tenant retention of 81% for 2020 Year to Date » Benefits of high renewal rates more than offset impact of cash rent roll downs COPT’s Renewal Rates Since 2010 0% 10% 20% 30% 40% 50% 60% 70% 80% 90% 100%
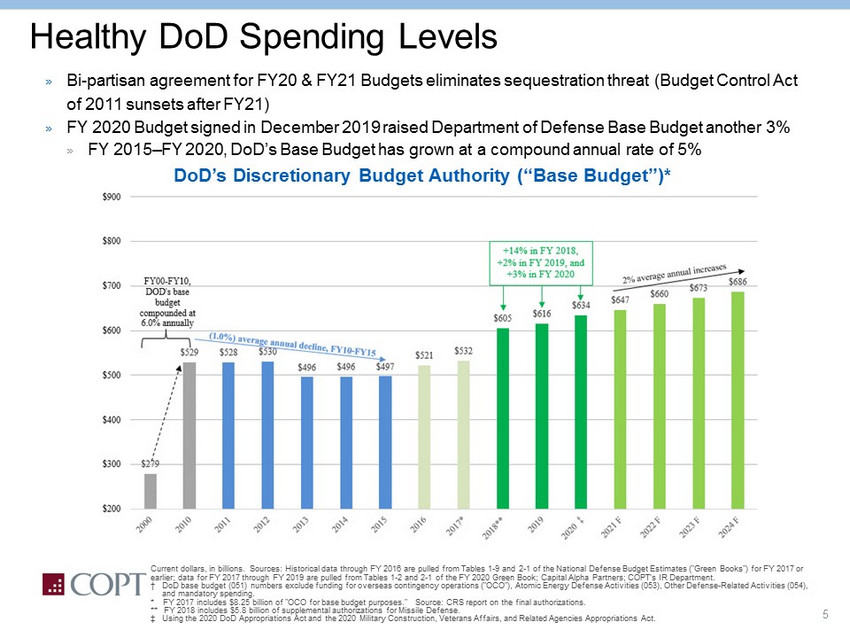
5 SEQUESTRATION Healthy DoD Spending Levels » Bi - partisan agreement for FY20 & FY21 Budgets eliminates sequestration threat (Budget Control Act of 2011 sunsets after FY21) » FY 2020 Budget signed in December 2019 raised Department of Defense Base Budget another 3% » FY 2015 – FY 2020, DoD’s Base Budget has grown at a compound annual rate of 5% DoD’s Discretionary Budget Authority (“Base Budget”)* Current dollars, in billions. Sources: Historical data through FY 2016 are pulled from Tables 1 - 9 and 2 - 1 of the National Defen se Budget Estimates ("Green Books") for FY 2017 or earlier; data for FY 2017 through FY 2019 are pulled from Tables 1 - 2 and 2 - 1 of the FY 2020 Green Book; Capital Alpha Partners; COPT’s IR Department. † DoD base budget (051) numbers exclude funding for overseas contingency operations ("OCO"), Atomic Energy Defense Activiti es (053), Other Defense - Related Activities (054), and mandatory spending. * FY 2017 includes $8.25 billion of "OCO for base budget purposes." Source: CRS report on the final authorizations. ** FY 2018 includes $5.8 billion of supplemental authorizations for Missile Defense. ‡ Using the 2020 DoD Appropriations Act and the 2020 Military Construction, Veterans Affairs, and Related Agencies Appropri ati ons Act.
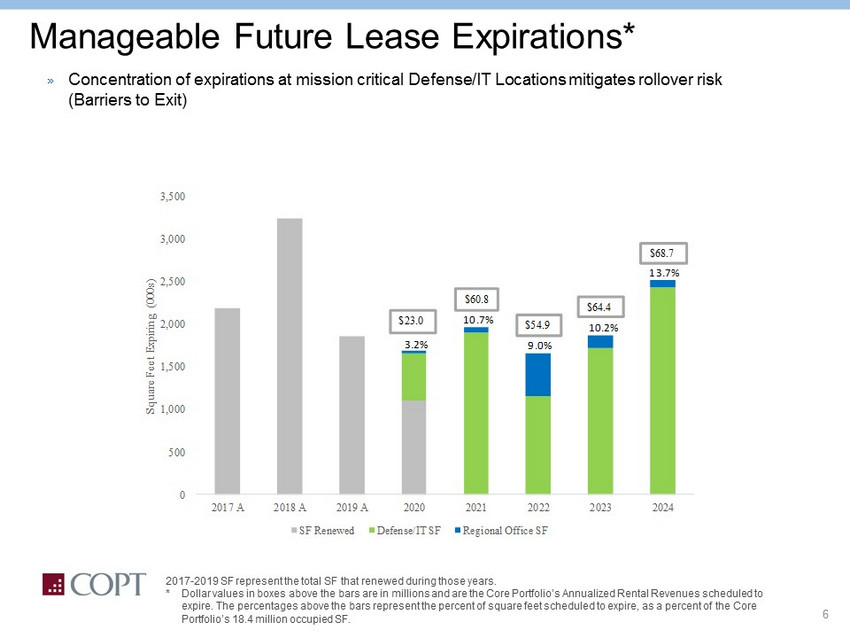
6 Manageable Future Lease Expirations* » Concentration of expirations at mission critical Defense/IT Locations mitigates rollover risk (Barriers to Exit) 2017 - 2019 SF represent the total SF that renewed during those years. * Dollar values in boxes above the bars are in millions and are the Core Portfolio’s Annualized Rental Revenues scheduled to expire. The percentages above the bars represent the percent of square feet scheduled to expire, as a percent of the Core Portfolio’s 18.4 million occupied SF. 0 500 1,000 1,500 2,000 2,500 3,000 3,500 2017 A 2018 A 2019 A 2020 2021 2022 2023 2024 Square Feet Expiring (000s) SF Renewed Defense/IT SF Regional Office SF 10.7% 9.0% 10.2% 13.7% 3.2% $23.0 $60.8 $54.9 $64.4 $68.7
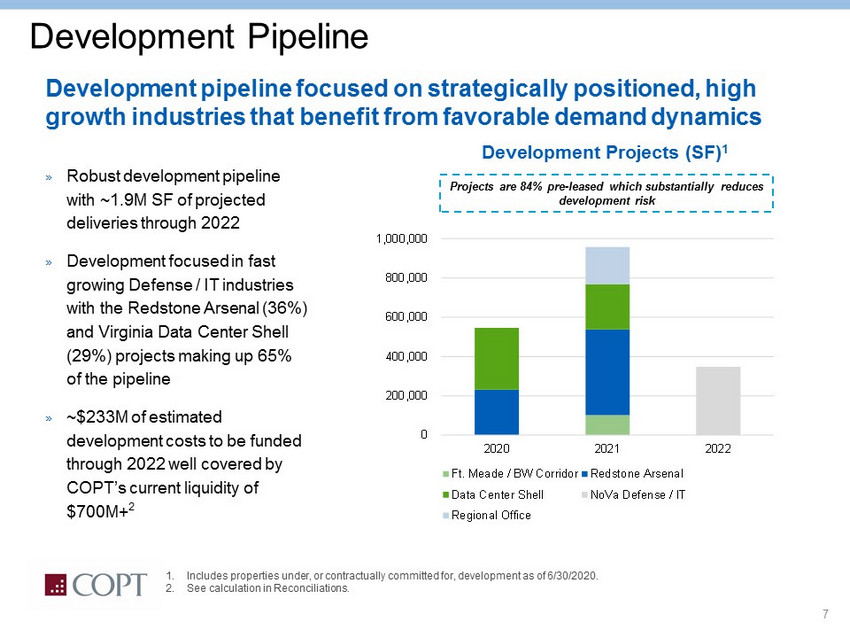
7 1. Includes properties under, or contractually committed for, development as of 6/30/2020. 2. See calculation in Reconciliations. Development Pipeline Development Projects (SF) 1 0 200,000 400,000 600,000 800,000 1,000,000 2020 2021 2022 Ft. Meade / BW Corridor Redstone Arsenal Data Center Shell NoVa Defense / IT Regional Office Development pipeline focused on strategically positioned, high growth industries that benefit from favorable demand dynamics » Robust development pipeline with ~1.9M SF of projected deliveries through 2022 » Development focused in fast growing Defense / IT industries with the Redstone Arsenal (36%) and Virginia Data Center Shell (29%) projects making up 65% of the pipeline » ~$233M of estimated development costs to be funded through 2022 well covered by COPT’s current liquidity of $700M+ 2 Projects are 84% pre - leased which substantially reduces development risk
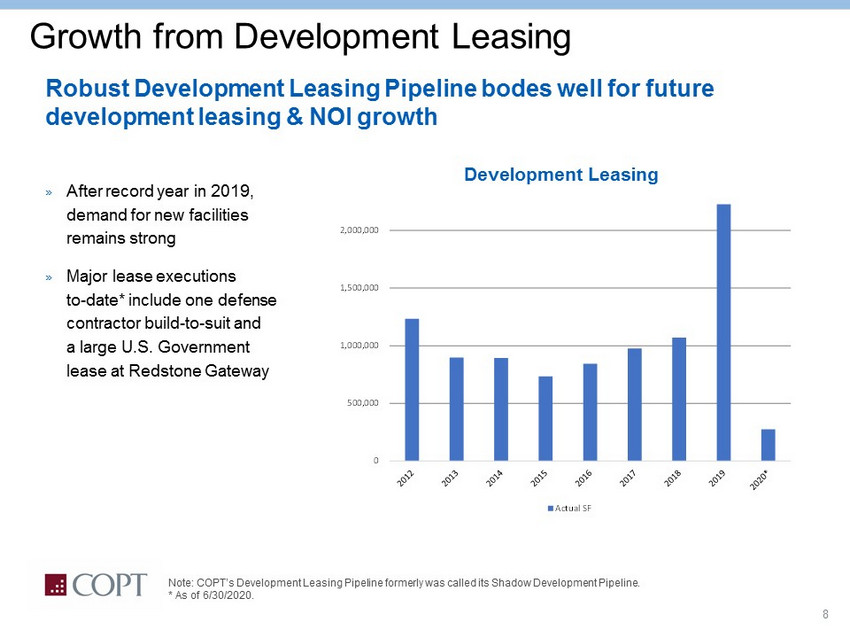
8 Growth from Development Leasing Note: COPT’s Development Leasing Pipeline formerly was called its Shadow Development Pipeline. * As of 6/30/2020. Development Leasing » After record year in 2019, demand for new facilities remains strong » Major lease executions to - date* include one defense contractor build - to - suit and a large U.S. Government lease at Redstone Gateway Robust Development Leasing Pipeline bodes well for future development leasing & NOI growth 0 500,000 1,000,000 1,500,000 2,000,000 Actual SF
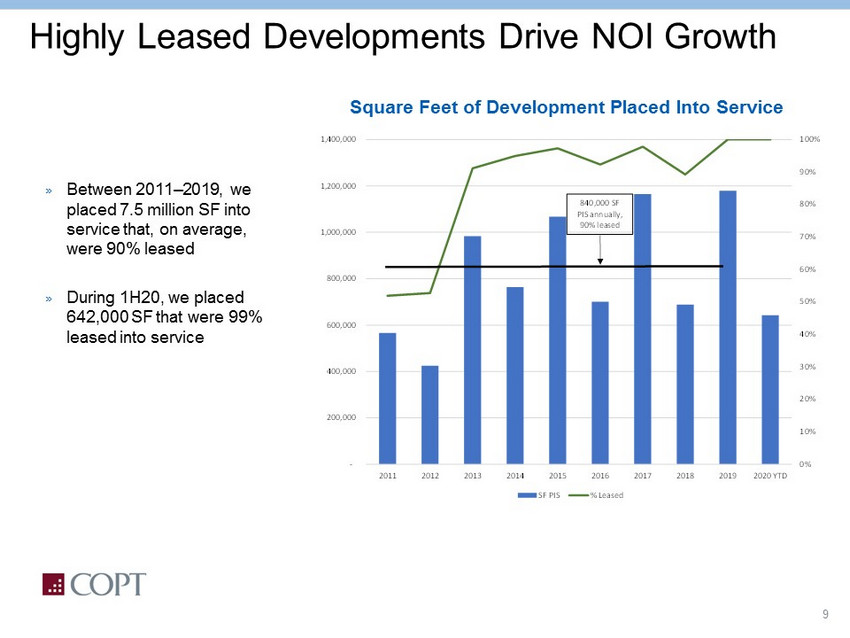
9 Highly Leased Developments Drive NOI Growth » Between 2011 – 2019, we placed 7.5 million SF into service that, on average, were 90% leased » During 1H20, we placed 642,000 SF that were 99% leased into service Square Feet of Development Placed Into Service 0% 10% 20% 30% 40% 50% 60% 70% 80% 90% 100% - 200,000 400,000 600,000 800,000 1,000,000 1,200,000 1,400,000 2011 2012 2013 2014 2015 2016 2017 2018 2019 2020 YTD SF PIS % Leased 840,000 SF PIS annually, 90% leased
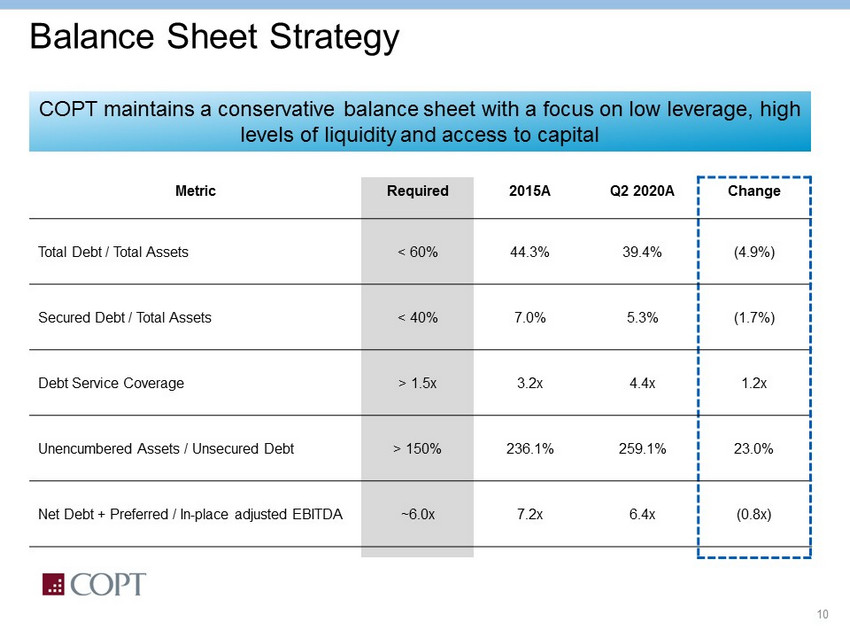
10 Balance Sheet Strategy COPT maintains a conservative balance sheet with a focus on low leverage, high levels of liquidity and access to capital Metric Required 2015A Q2 2020A Change Total Debt / Total Assets < 60% 44.3% 39.4% (4.9%) Secured Debt / Total Assets < 40% 7.0% 5.3% (1.7%) Debt Service Coverage > 1.5x 3.2x 4.4x 1.2x Unencumbered Assets / Unsecured Debt > 150% 236.1% 259.1% 23.0% Net Debt + Preferred / In - place adjusted EBITDA ~6.0x 7.2x 6.4x (0.8x)
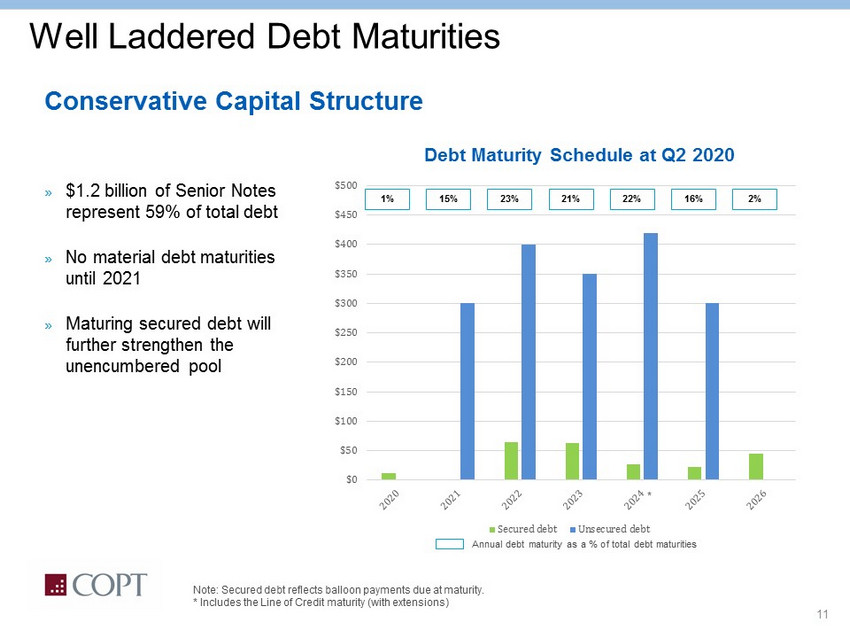
11 Well Laddered Debt Maturities Conservative Capital Structure » $1.2 billion of Senior Notes represent 59% of total debt » No material debt maturities until 2021 » Maturing secured debt will further strengthen the unencumbered pool Debt Maturity Schedule at Q2 2020 $0 $50 $100 $150 $200 $250 $300 $350 $400 $450 $500 Secured debt Unsecured debt Note: Secured debt reflects balloon payments due at maturity. * Includes the Line of Credit maturity (with extensions) * 1% 15% 23% 21% 22% 16% 2% Annual debt maturity as a % of total debt maturities
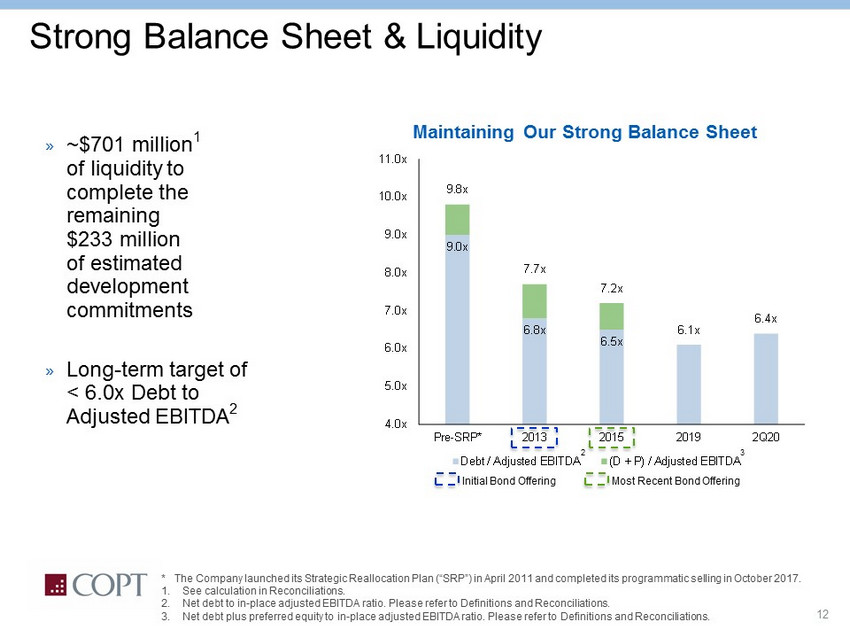
12 Strong Balance Sheet & Liquidity » ~$701 million 1 of liquidity to complete the remaining $233 million of estimated development commitments » Long - term target of < 6.0x Debt to Adjusted EBITDA 2 * The Company launched its Strategic Reallocation Plan (“SRP”) in April 2011 and completed its programmatic selling in Octo ber 2017. 1. See calculation in Reconciliations. 2. Net debt to in - place adjusted EBITDA ratio. Please refer to Definitions and Reconciliations. 3. Net debt plus preferred equity to in - place adjusted EBITDA ratio. Please refer to Definitions and Reconciliations. Maintaining Our Strong Balance Sheet 9.0x 6.8x 6.5x 9.8x 7.7x 7.2x 6.1x 6.4x 4.0x 5.0x 6.0x 7.0x 8.0x 9.0x 10.0x 11.0x Pre-SRP* 2013 2015 2019 2Q20 Debt / Adjusted EBITDA (D + P) / Adjusted EBITDA 2 3 Initial Bond Offering Most Recent Bond Offering

13 Appendices A. Definitions & Glossary B. Reconciliations
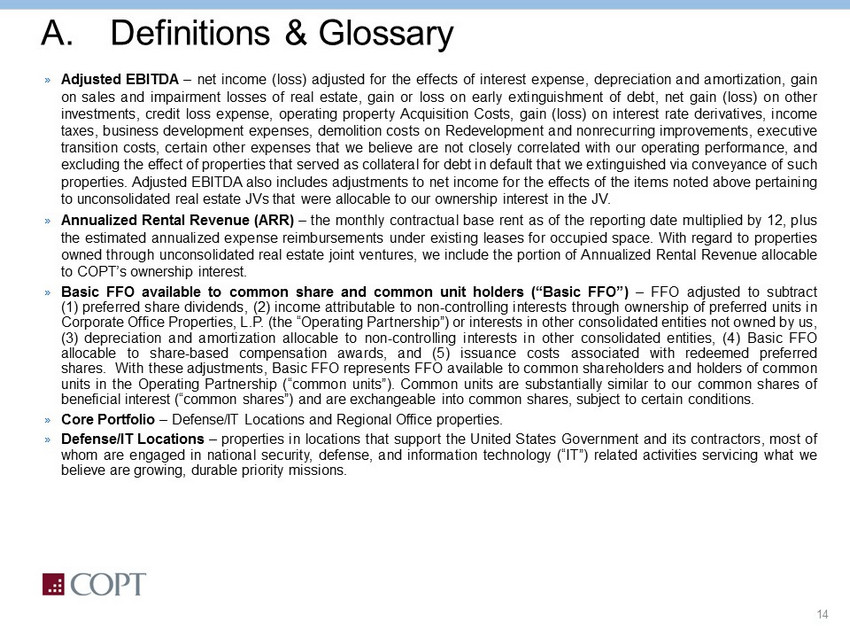
14 A. Definitions & Glossary » Adjusted EBITDA – net income (loss) adjusted for the effects of interest expense, depreciation and amortization, gain on sales and impairment losses of real estate, gain or loss on early extinguishment of debt, net gain (loss) on other investments, credit loss expense, operating property Acquisition Costs, gain (loss) on interest rate derivatives, income taxes, business development expenses, demolition costs on Redevelopment and nonrecurring improvements, executive transition costs, certain other expenses that we believe are not closely correlated with our operating performance, and excluding the effect of properties that served as collateral for debt in default that we extinguished via conveyance of such properties . Adjusted EBITDA also includes adjustments to net income for the effects of the items noted above pertaining to unconsolidated real estate JVs that were allocable to our ownership interest in the JV . » Annualized Rental Revenue (ARR) – the monthly contractual base rent as of the reporting date multiplied by 12 , plus the estimated annualized expense reimbursements under existing leases for occupied space . With regard to properties owned through unconsolidated real estate joint ventures, we include the portion of Annualized Rental Revenue allocable to COPT’s ownership interest . » Basic FFO available to common share and common unit holders (“Basic FFO”) – FFO adjusted to subtract ( 1 ) preferred share dividends, ( 2 ) income attributable to non - controlling interests through ownership of preferred units in Corporate Office Properties, L . P . (the “Operating Partnership”) or interests in other consolidated entities not owned by us, ( 3 ) depreciation and amortization allocable to non - controlling interests in other consolidated entities, ( 4 ) Basic FFO allocable to share - based compensation awards, and ( 5 ) issuance costs associated with redeemed preferred shares . With these adjustments, Basic FFO represents FFO available to common shareholders and holders of common units in the Operating Partnership (“common units”) . Common units are substantially similar to our common shares of beneficial interest (“common shares”) and are exchangeable into common shares, subject to certain conditions . » Core Portfolio – Defense/IT Locations and Regional Office properties . » Defense/IT Locations – properties in locations that support the United States Government and its contractors, most of whom are engaged in national security, defense, and information technology (“IT”) related activities servicing what we believe are growing, durable priority missions .
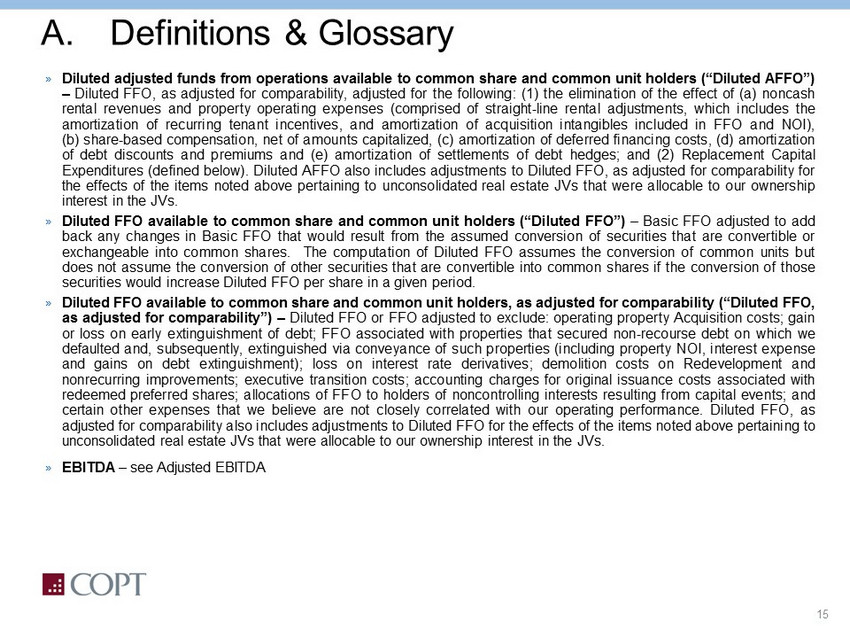
15 A. Definitions & Glossary » Diluted adjusted funds from operations available to common share and common unit holders (“Diluted AFFO”) – Diluted FFO, as adjusted for comparability, adjusted for the following : ( 1 ) the elimination of the effect of (a) noncash rental revenues and property operating expenses (comprised of straight - line rental adjustments, which includes the amortization of recurring tenant incentives, and amortization of acquisition intangibles included in FFO and NOI), (b) share - based compensation, net of amounts capitalized, (c) amortization of deferred financing costs, (d) amortization of debt discounts and premiums and (e) amortization of settlements of debt hedges ; and ( 2 ) Replacement Capital Expenditures (defined below) . Diluted AFFO also includes adjustments to Diluted FFO, as adjusted for comparability for the effects of the items noted above pertaining to unconsolidated real estate JVs that were allocable to our ownership interest in the JVs . » Diluted FFO available to common share and common unit holders (“Diluted FFO”) – Basic FFO adjusted to add back any changes in Basic FFO that would result from the assumed conversion of securities that are convertible or exchangeable into common shares . The computation of Diluted FFO assumes the conversion of common units but does not assume the conversion of other securities that are convertible into common shares if the conversion of those securities would increase Diluted FFO per share in a given period . » Diluted FFO available to common share and common unit holders, as adjusted for comparability (“Diluted FFO, as adjusted for comparability”) – Diluted FFO or FFO adjusted to exclude : operating property Acquisition costs ; gain or loss on early extinguishment of debt ; FFO associated with properties that secured non - recourse debt on which we defaulted and, subsequently, extinguished via conveyance of such properties (including property NOI, interest expense and gains on debt extinguishment) ; loss on interest rate derivatives ; demolition costs on Redevelopment and nonrecurring improvements ; executive transition costs ; accounting charges for original issuance costs associated with redeemed preferred shares ; allocations of FFO to holders of noncontrolling interests resulting from capital events ; and certain other expenses that we believe are not closely correlated with our operating performance . Diluted FFO, as adjusted for comparability also includes adjustments to Diluted FFO for the effects of the items noted above pertaining to unconsolidated real estate JVs that were allocable to our ownership interest in the JVs . » EBITDA – see Adjusted EBITDA
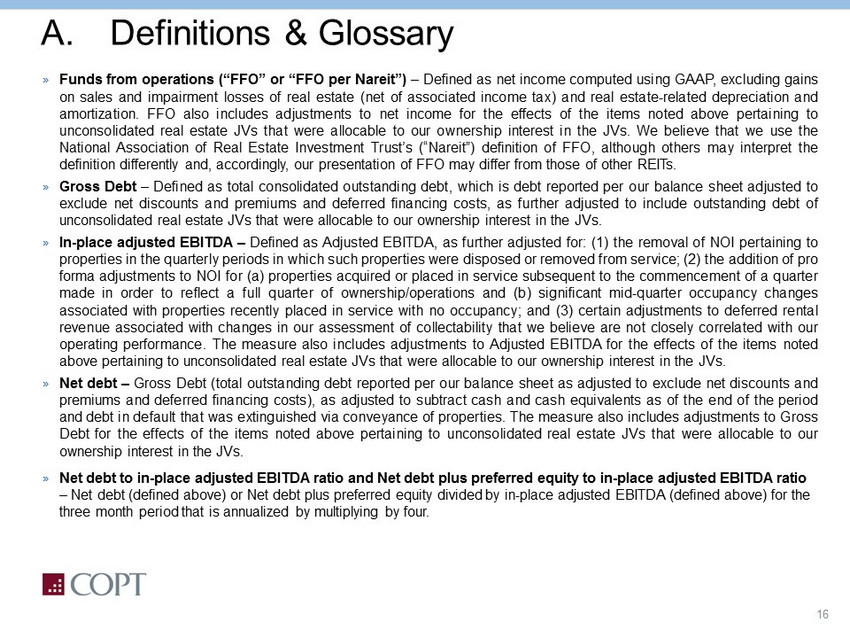
16 A. Definitions & Glossary » Funds from operations (“FFO” or “FFO per Nareit ”) – Defined as net income computed using GAAP, excluding gains on sales and impairment losses of real estate (net of associated income tax) and real estate - related depreciation and amortization . FFO also includes adjustments to net income for the effects of the items noted above pertaining to unconsolidated real estate JVs that were allocable to our ownership interest in the JVs . We believe that we use the National Association of Real Estate Investment Trust’s (“ Nareit ”) definition of FFO, although others may interpret the definition differently and, accordingly, our presentation of FFO may differ from those of other REITs . » Gross Debt – Defined as total consolidated outstanding debt, which is debt reported per our balance sheet adjusted to exclude net discounts and premiums and deferred financing costs, as further adjusted to include outstanding debt of unconsolidated real estate JVs that were allocable to our ownership interest in the JVs . » In - place adjusted EBITDA – Defined as Adjusted EBITDA, as further adjusted for : ( 1 ) the removal of NOI pertaining to properties in the quarterly periods in which such properties were disposed or removed from service ; ( 2 ) the addition of pro forma adjustments to NOI for (a) properties acquired or placed in service subsequent to the commencement of a quarter made in order to reflect a full quarter of ownership/operations and (b) significant mid - quarter occupancy changes associated with properties recently placed in service with no occupancy ; and ( 3 ) certain adjustments to deferred rental revenue associated with changes in our assessment of collectability that we believe are not closely correlated with our operating performance . The measure also includes adjustments to Adjusted EBITDA for the effects of the items noted above pertaining to unconsolidated real estate JVs that were allocable to our ownership interest in the JVs . » Net debt – Gross Debt (total outstanding debt reported per our balance sheet as adjusted to exclude net discounts and premiums and deferred financing costs), as adjusted to subtract cash and cash equivalents as of the end of the period and debt in default that was extinguished via conveyance of properties . The measure also includes adjustments to Gross Debt for the effects of the items noted above pertaining to unconsolidated real estate JVs that were allocable to our ownership interest in the JVs . » Net debt to in - place adjusted EBITDA ratio and Net debt plus preferred equity to in - place adjusted EBITDA ratio – Net debt (defined above) or Net debt plus preferred equity divided by in - place adjusted EBITDA (defined above) for the three month period that is annualized by multiplying by four.
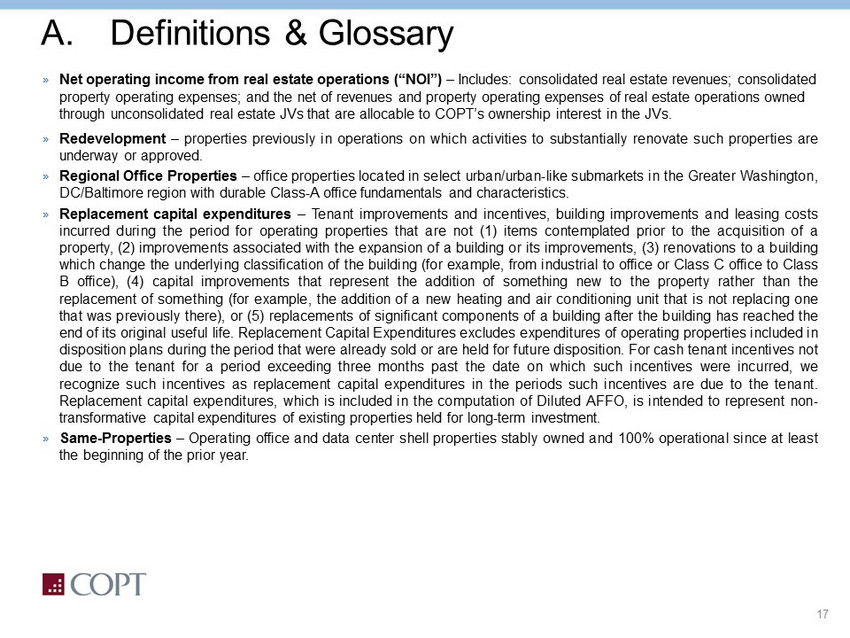
17 A. Definitions & Glossary » Net operating income from real estate operations (“NOI”) – Includes: consolidated real estate revenues; consolidated property operating expenses; and the net of revenues and property operating expenses of real estate operations owned through unconsolidated real estate JVs that are allocable to COPT’s ownership interest in the JVs. » Redevelopment – properties previously in operations on which activities to substantially renovate such properties are underway or approved . » Regional Office Properties – office properties located in select urban/urban - like submarkets in the Greater Washington, DC/Baltimore region with durable Class - A office fundamentals and characteristics . » Replacement capital expenditures – Tenant improvements and incentives, building improvements and leasing costs incurred during the period for operating properties that are not ( 1 ) items contemplated prior to the acquisition of a property, ( 2 ) improvements associated with the expansion of a building or its improvements, ( 3 ) renovations to a building which change the underlying classification of the building (for example, from industrial to office or Class C office to Class B office), ( 4 ) capital improvements that represent the addition of something new to the property rather than the replacement of something (for example, the addition of a new heating and air conditioning unit that is not replacing one that was previously there), or ( 5 ) replacements of significant components of a building after the building has reached the end of its original useful life . Replacement Capital Expenditures excludes expenditures of operating properties included in disposition plans during the period that were already sold or are held for future disposition . For cash tenant incentives not due to the tenant for a period exceeding three months past the date on which such incentives were incurred, we recognize such incentives as replacement capital expenditures in the periods such incentives are due to the tenant . Replacement capital expenditures, which is included in the computation of Diluted AFFO, is intended to represent non - transformative capital expenditures of existing properties held for long - term investment . » Same - Properties – Operating office and data center shell properties stably owned and 100 % operational since at least the beginning of the prior year .
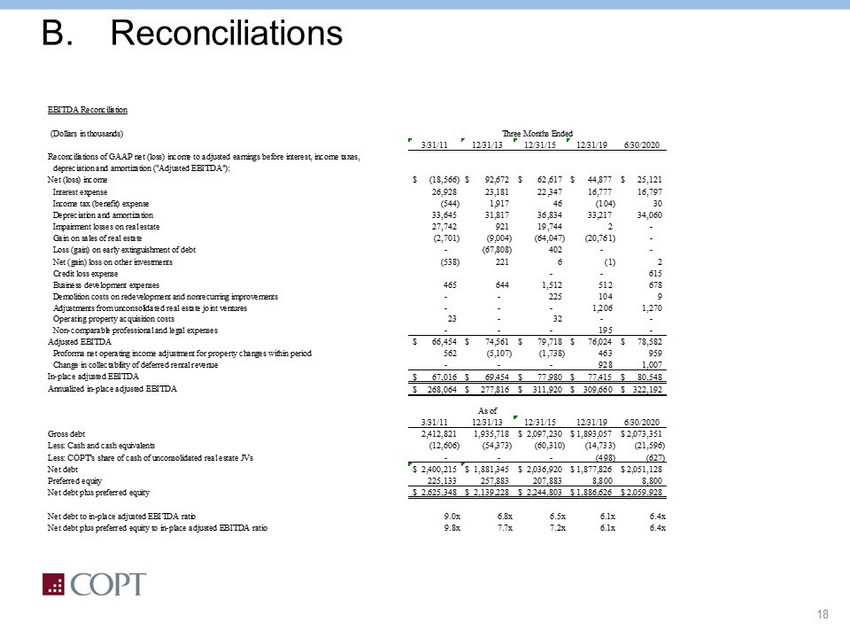
18 B. Reconciliations EBITDA Reconciliation (Dollars in thousands) 3/31/11 12/31/13 12/31/15 12/31/19 6/30/2020 Reconciliations of GAAP net (loss) income to adjusted earnings before interest, income taxes, depreciation and amortization ("Adjusted EBITDA"): Net (loss) income (18,566)$ 92,672$ 62,617$ 44,877$ 25,121$ Interest expense 26,928 23,181 22,347 16,777 16,797 Income tax (benefit) expense (544) 1,917 46 (104) 30 Depreciation and amortization 33,645 31,817 36,834 33,217 34,060 Impairment losses on real estate 27,742 921 19,744 2 - Gain on sales of real estate (2,701) (9,004) (64,047) (20,761) - Loss (gain) on early extinguishment of debt - (67,808) 402 - - Net (gain) loss on other investments (538) 221 6 (1) 2 Credit loss expense - - 615 Business development expenses 465 644 1,512 512 678 Demolition costs on redevelopment and nonrecurring improvements - - 225 104 9 Adjustments from unconsolidated real estate joint ventures - - - 1,206 1,270 Operating property acquisition costs 23 - 32 - - Non-comparable professional and legal expenses - - - 195 - Adjusted EBITDA 66,454$ 74,561$ 79,718$ 76,024$ 78,582$ Proforma net operating income adjustment for property changes within period 562 (5,107) (1,738) 463 959 Change in collectability of deferred rental revenue - - - 928 1,007 In-place adjusted EBITDA 67,016$ 69,454$ 77,980$ 77,415$ 80,548$ Annualized in-place adjusted EBITDA 268,064$ 277,816$ 311,920$ 309,660$ 322,192$ 3/31/11 12/31/13 12/31/15 12/31/19 6/30/2020 Gross debt 2,412,821 1,935,718 2,097,230$ 1,893,057$ 2,073,351$ Less: Cash and cash equivalents (12,606) (54,373) (60,310) (14,733) (21,596) Less: COPT's share of cash of unconsolidated real estate JVs - - - (498) (627) Net debt 2,400,215$ 1,881,345$ 2,036,920$ 1,877,826$ 2,051,128$ Preferred equity 225,133 257,883 207,883 8,800 8,800 Net debt plus preferred equity 2,625,348$ 2,139,228$ 2,244,803$ 1,886,626$ 2,059,928$ Net debt to in-place adjusted EBITDA ratio 9.0x 6.8x 6.5x 6.1x 6.4x Net debt plus preferred equity to in-place adjusted EBITDA ratio 9.8x 7.7x 7.2x 6.1x 6.4x As of Three Months Ended
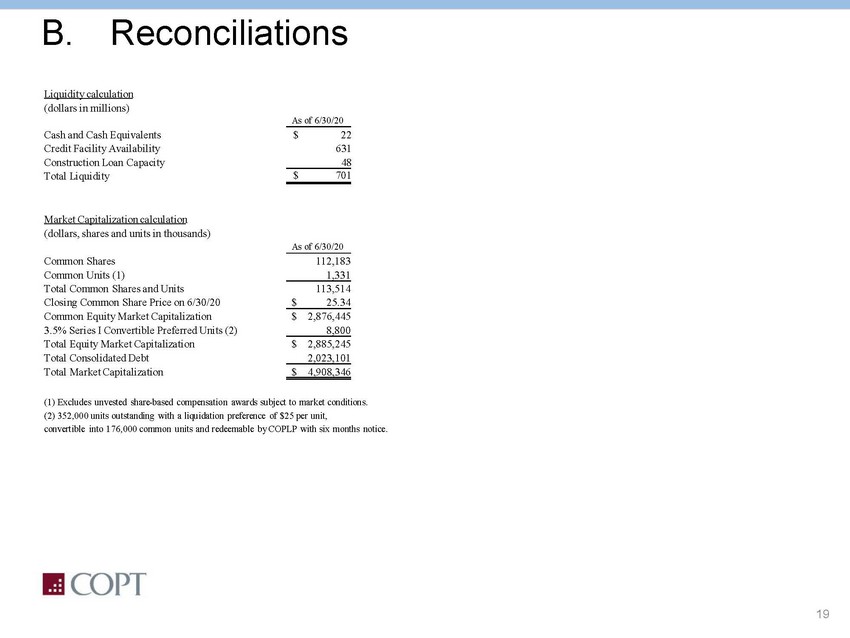
19 B. Reconciliations Liquidity calculation (dollars in millions) As of 6/30/20 Cash and Cash Equivalents $ 22 Credit Facility Availability 631 Construction Loan Capacity 48 Total Liquidity $ 701 Market Capitalization calculation (dollars, shares and units in thousands) As of 6/30/20 Common Shares 112,183 Common Units (1) 1,331 Total Common Shares and Units 113,514 Closing Common Share Price on 6/30/20 $ 25.34 Common Equity Market Capitalization $ 2,876,445 3.5% Series I Convertible Preferred Units (2) 8,800 Total Equity Market Capitalization $ 2,885,245 Total Consolidated Debt 2,023,101 Total Market Capitalization $ 4,908,346 (1) Excludes unvested share-based compensation awards subject to market conditions. (2) 352,000 units outstanding with a liquidation preference of $25 per unit, convertible into 176,000 common units and redeemable by COPLP with six